. 2019 Jul 3;8(7):672.
doi: 10.3390/cells8070672.

Possible Involvement of Intracellular Calcium-Independent Phospholipase A2 in the Release of Secretory Phospholipases from Mast Cells-Increased Expression in Ileal Mast Cells of Crohn's Disease

Affiliations

Possible Involvement of Intracellular Calcium-Independent Phospholipase A2 in the Release of Secretory Phospholipases from Mast Cells-Increased Expression in Ileal Mast Cells of Crohn's Disease

Ulrika Christerson et al. Cells. .

Abstract

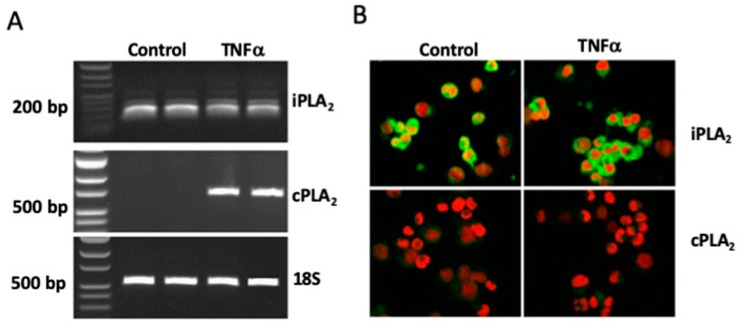
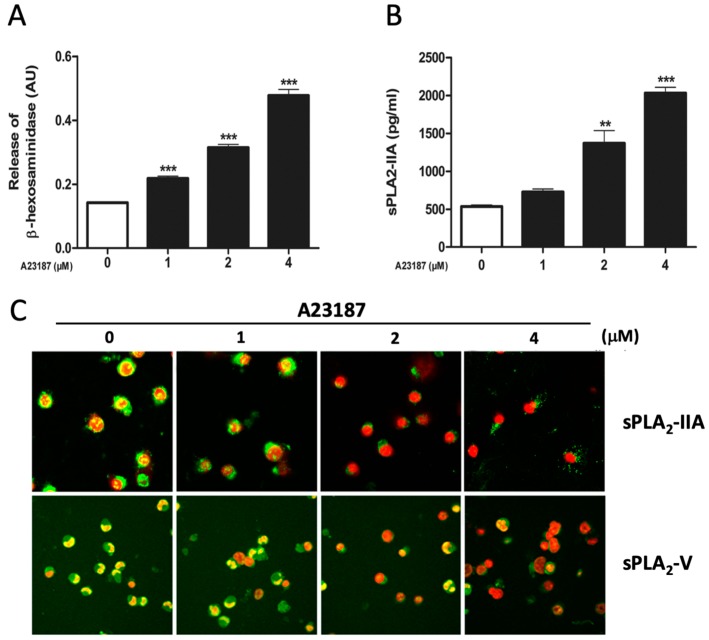
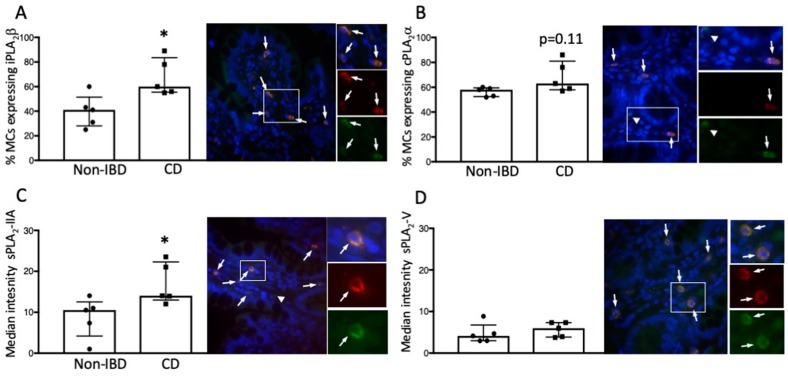
Increased activity of secretory phospholipases A2 (sPLA2) type-II was previously observed in ileum of Crohn's disease (CD). Our aims were to explore the involvement of calcium-independent (i)PLA2β in the release of sPLA2s from the human mast cell (MC) line (HMC-1) and investigate expressions of cytosolic (c)PLA2α, iPLA2β, sPLA2-IIA and sPLA2-V in MCs of CD ileum. The release of sPLA2 was investigated in HMC-1 by immunocytochemistry and ELISA. The expression intensities of PLA2s in mucosal MCs, and the proportion of PLA2-positive MCs, were investigated in normal ileum and in ileum from patients with CD by immunohistochemistry. The calcium ionophore-stimulated release of sPLA2-IIA and sPLA2-V from HMC-1 was reduced by the iPLA2-inhibitor bromoenol lactone. All four PLA2s were detectable in mucosal MCs, both in normal ileum and in CD, but the proportion of iPLA2β-containing mucosal MCs and the expression intensity of sPLA2-IIA was increased in CD. Results indicate that iPLA2β is involved in the secretion of sPLA2s from HMC-1, and suggest that iPLA2β-mediated release of sPLA2 from intestinal MCs may contribute to CD pathophysiology. Ex vivo studies on isolated mucosal mast cells are however needed to clarify the precise role of MC PLA2s in the inflammatory processes of CD.

Keywords: Crohn’s disease; inflammation; mast cells; phospholipases A2.


Conflict of interest statement

The authors declare no conflict of interest.

Figures

Figure 1
Figure 1
Expression of iPLA2β and cPLA2α in HMC-1. Cells were stimulated with TNFα (25 ng/mL) or culture medium (control) for 48 h. (A) Reverse Transcriptase-PCR analysis; PCR products were identified as iPLA2α (184 bp), cPLA2β (737 bp) or 18S rRNA (531 bp). Results are presented as duplicate samples representative of three independent experiments. (B) Immunocytochemical analysis; green staining is for either iPLA2β or cPLA2α. Cell nuclei were visualized with propidium iodide staining (red) (magnification × 600). Results are representative for three independent experiments.
Figure 2
Figure 2
Expression of sPLA2-IIA and sPLA2-V in HMC-1. Cells were either stimulated with TNFα (25 ng/mL) or culture medium (control) for 48 h. (A) Reverse Transcriptase-PCR analysis; the PCR products were identified as sPLA2-IIA (238 bp), sPLA2-V (559 bp) or 18S rRNA (531 bp). Note that the cDNA for sPLA2-IIA was diluted ten times compared to the cDNA for sPLA2-V. Samples are two representatives out of seven independent runs. (B) Immunocytochemical analysis. Green staining is for sPLA2-IIA or sPLA2-V and red staining is for visualization of cell nuclei (magnification × 600). Results are representative for three independent experiments.
Figure 3
Figure 3
Release of radiolabeled fatty acids from A23187-stimulated HMC-1 cells. Control cells were incubated with culture medium only. (A) Time-dependent release of arachidonic acid (AA). (B) Time-dependent release of oleic acid (OA). (C) Effect of combined stimulation with calcium ionophore A23187 and phorbol myristate acetate (PMA) on the release of AA. PMA and/or A23187 were added for 4 h. * p < 0.05, ** p < 0.01, *** p < 0.001 vs. control cells. Data from three independent experiments.
Figure 4
Figure 4
Effect of PLA2 inhibitors on the calcium ionophore A23187-stimulated release of radiolabeled arachidonic acid (AA) from HMC-1. Cells were pre-treated for 30 min with various concentrations of PLA2 inhibitors, prior to incubation with A23187 (2 µM) for an additional 4 h. (A) Effect of the combined cPLA2 and iPLA2 inhibitor methyl arachidonyl fluoro-phosphonate (MAFP). (B) Effect of the specific iPLA2 inhibitor bromoenol lactone (BEL). *p < 0.05, ** p < 0.01, *** p < 0.001 vs. A23187-stimulated cells. Data from three independent experiments.
Figure 5
Figure 5
Degranulation and release of sPLA2-IIA and sPLA2-V in A23187-stimulated HMC-1. Cells were stimulated for 4 h with various concentrations of calcium ionophore A23187. Control cells were incubated with culture medium only. (A) Release of β-hexosaminidase. (B) ELISA analysis. Release of sPLA2-IIA. (C) Immunocytochemical analysis, visualizing the effect of A23187 on the release of sPLA2-IIA and sPLA2-V. Green staining is for sPLA2-IIA or sPLA2-V and red staining is for visualization of cell nuclei (magnification × 600). Note that the expression of sPLA2-V had to be upregulated by TNFα, as described in Figure 2A and B. **p < 0.01, ***p < 0.001 vs. controls. Data from three independent experiments.
Figure 6
Figure 6
Effect of iPLA2 inhibition on A23187-induced degranulation and release of sPLA2-IIA and sPLA2-V in HMC-1. (A) Effect of the specific iPLA2 inhibitor bromoenol lactone (BEL) on the release of β-hexosaminidase. (B) Effect of the specific iPLA2 inhibitor BEL on the release of sPLA2-IIA measured by ELISA. (C) Immunocytochemical analysis, visualizing the effect on the release of sPLA2-IIA and sPLA2-V. Green staining is for sPLA2-IIA or sPLA2-V and red staining is for visualization of cell nuclei (magnification × 600). Note that the expression of sPLA2-V had to be upregulated by TNFα, as described in Figure 2A and B, to be illustrated. ** p < 0.01, *** p < 0.001 vs. controls. Data from three independent experiments.
Figure 7
Figure 7
Expression of iPLA2β, cPLA2α, sPLA2-IIA and sPLA2-V on mast cells (MCs) in the intestinal mucosa of 5 patients with Crohn’s disease (CD) and 5 controls. (A) Percentage of MCs expressing iPLA2β. Arrows indicate MCs co-localizing with iPLA2β in a patient with CD. (B) Percentage of MCs expressing cPLA2α. Arrows indicate MCs co-localizing with cPLA2α in a control patient. Arrow-head indicates cPLA2α expression in a cell not positive for MC tryptase. (C) Expression intensity of sPLA2-IIA on MCs. Arrows indicate MCs co-localizing with sPLA2-IIA in a patient with CD. Arrow-head indicates sPLA2-IIA expression in a cell not positive for MC tryptase. (D) Expression intensity of sPLA2-V on MCs. Arrows indicate MCs co-localizing with sPLA2-V in a control patient.

Similar articles

References

    1. Hamilton M.J., Frei S.M., Stevens R.L. The multifaceted mast cell in inflammatory bowel disease. Inflamm. Bowel Dis. 2014;20:2364–2378. doi: 10.1097/MIB.0000000000000142. - DOI - PMC - PubMed
    1. Bischoff S., Gebhardt T. Role of mast cells and eosinophils in neuroimmune interactions regulating mucosal inflammation in inflammatory bowel disease. Adv. Exp. Med. Biol. 2006;579:177–208. - PubMed
    1. Gelbmann C., Mestermann S., Gross V., Köllinger M., Schölmerich J., Falk W. Strictures in Crohn´s disease are characterised by an accumulation of mast cells colocalised with laminin but not with fibronectin or vitronectin. Gut. 1999;45:210–217. doi: 10.1136/gut.45.2.210. - DOI - PMC - PubMed
    1. Boeckxstaens G. Mast cells and inflammatory bowel disease. Curr. Opin. Pharmacol. 2015;25:45–49. doi: 10.1016/j.coph.2015.11.005. - DOI - PubMed
    1. Bischoff S.C. Mast cells in gastrointestinal disorders. Eur. J. Pharmacol. 2016;778:139–145. doi: 10.1016/j.ejphar.2016.02.018. - DOI - PubMed

Publication types

MeSH terms