. 2019 Jul 3;11(7):603.
doi: 10.3390/v11070603.

Role of NS1 and TLR3 in Pathogenesis and Immunity of WNV

Affiliations

Role of NS1 and TLR3 in Pathogenesis and Immunity of WNV

Sameera Patel et al. Viruses. .

Abstract

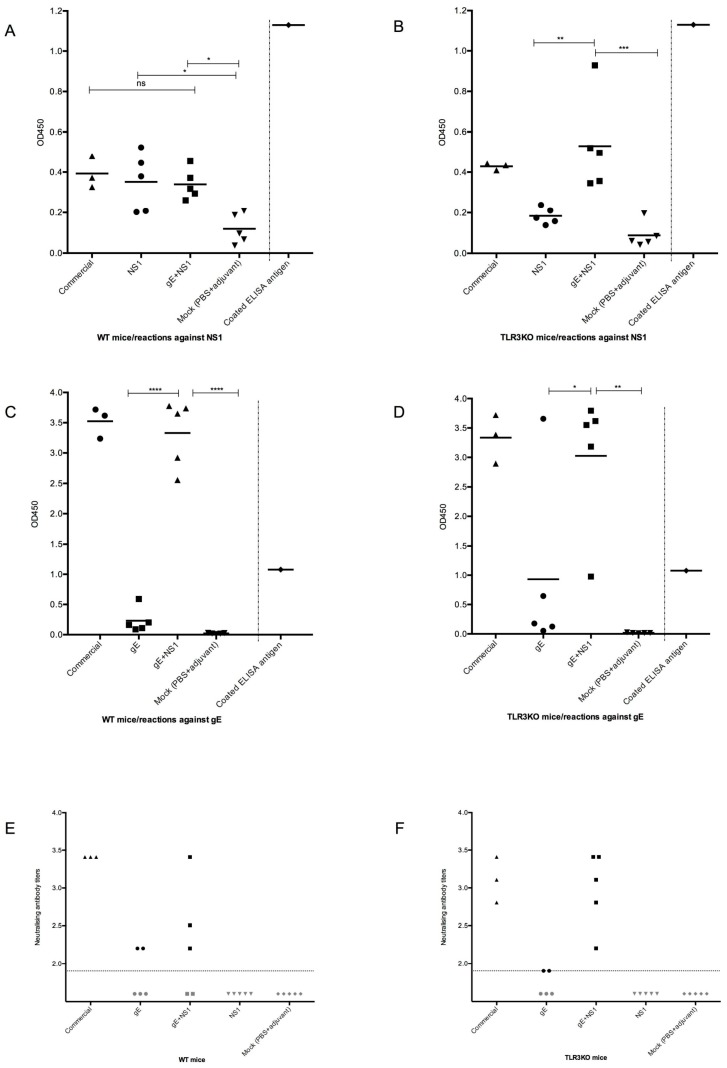
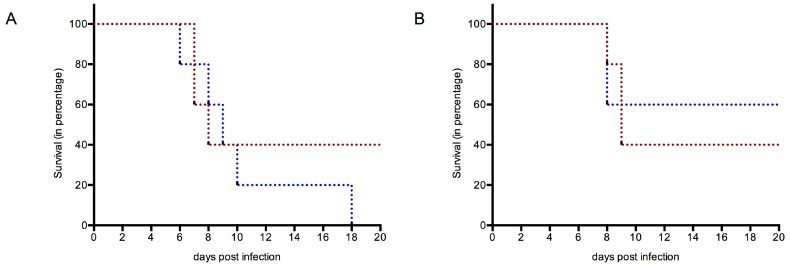
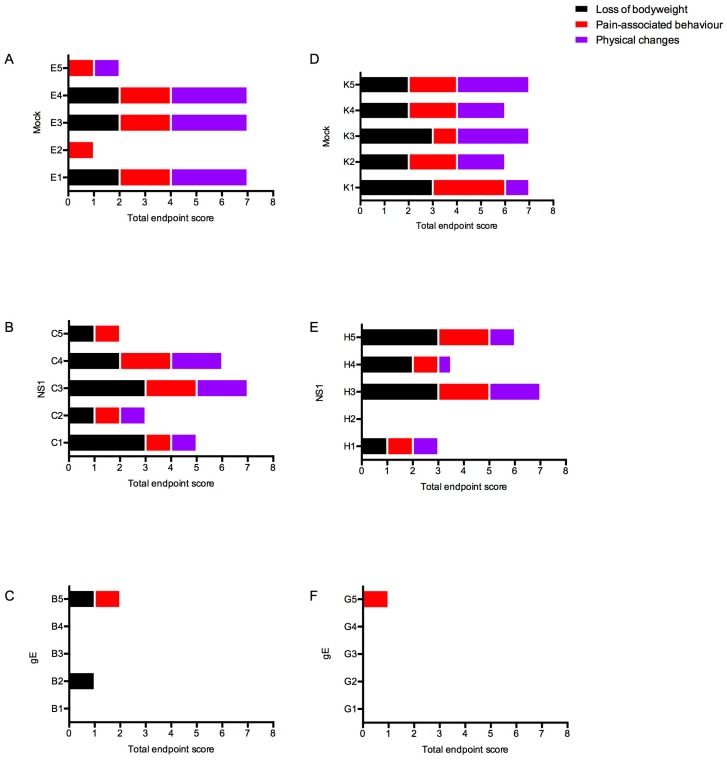
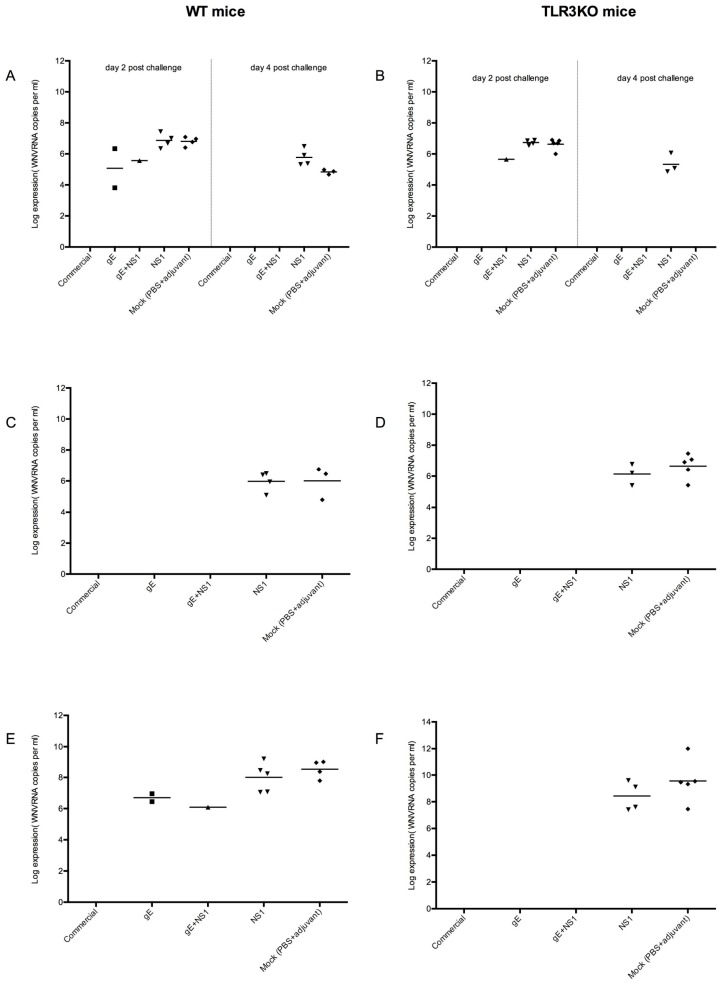
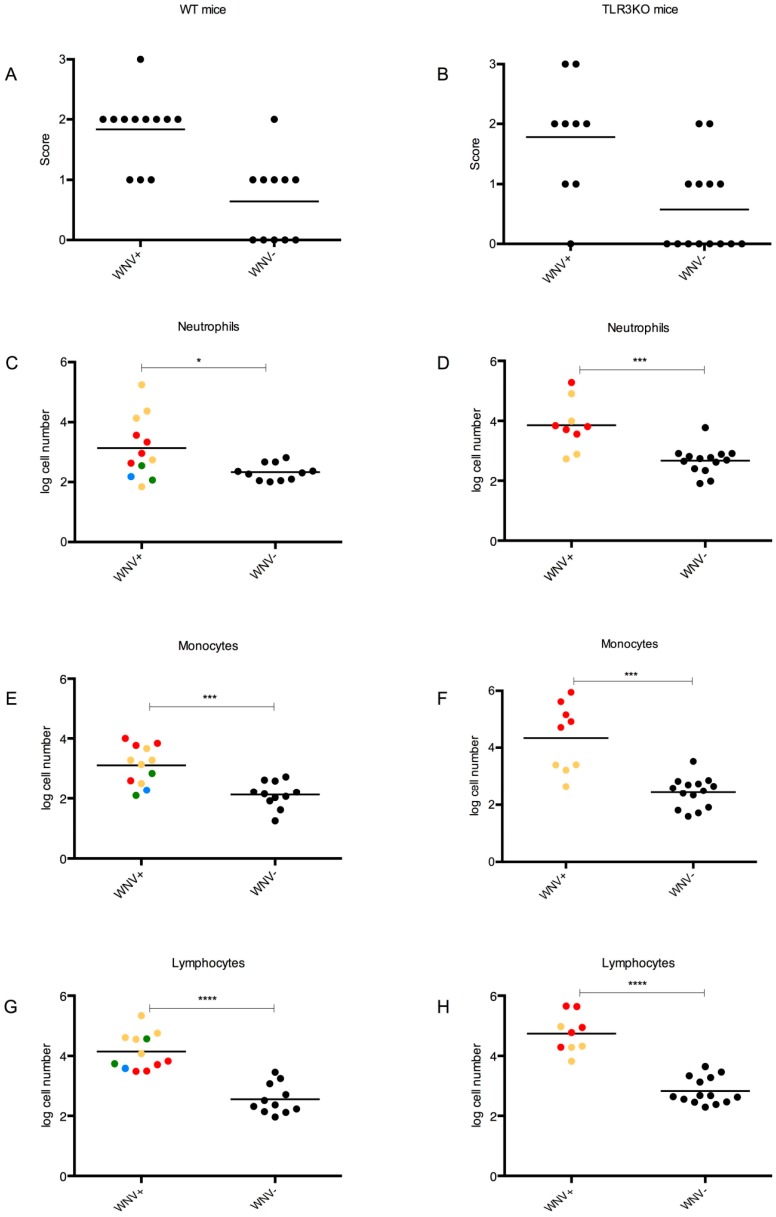
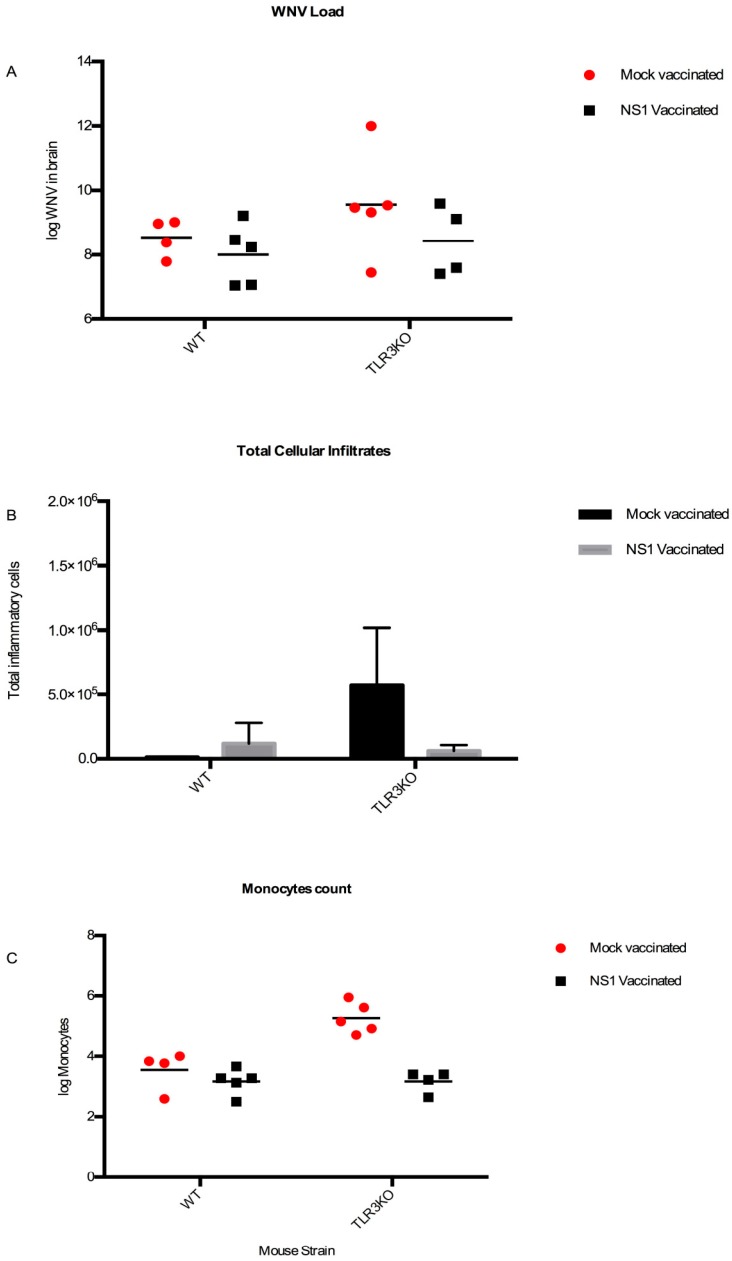
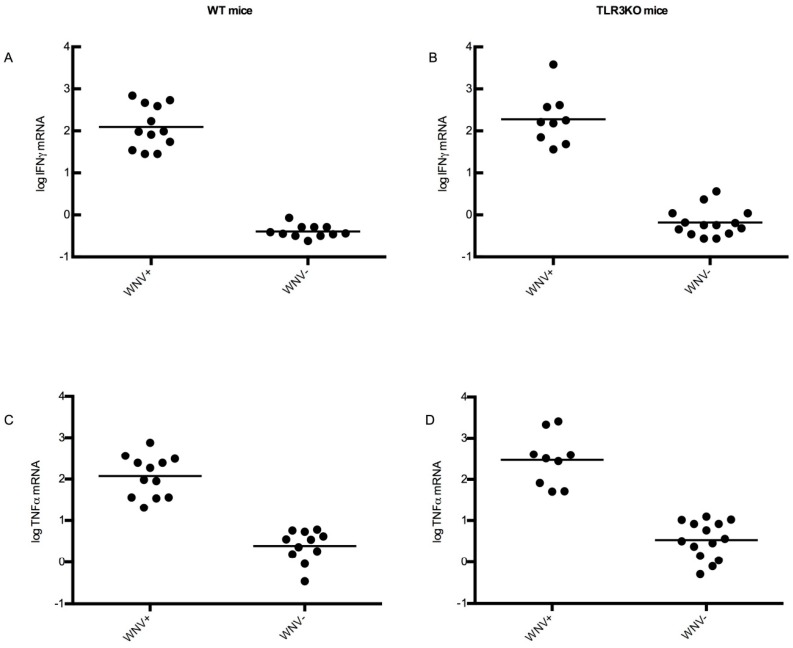
West Nile Virus (WNV) is a mosquito-transmitted flavivirus which causes encephalitis especially in elderly and immunocompromised individuals. Previous studies have suggested the protective role of the Toll-like receptor 3 (TLR3) pathway against WNV entry into the brain, while the WNV non-structural protein 1 (NS1) interferes with the TLR3 signaling pathway, besides being a component of viral genome replication machinery. In this study, we investigated whether immunization with NS1 could protect against WNV neuroinvasion in the context of TLR3 deficiency. We immunized mice with either an intact or deleted TLR3 system (TLR3KO) with WNV envelope glycoprotein (gE) protein, NS1, or a combination of gE and NS1. Immunization with gE or gE/NS1, but not with NS1 alone, induced WNV neutralizing antibodies and protected against WNV brain invasion and inflammation. The presence of intact TLR3 signaling had no apparent effect on WNV brain invasion. However, mock-immunized TLR3KO mice had higher inflammatory cell invasion upon WNV brain infection than NS1-immunized TLR3KO mice and wild type mice. Thus, immunization against NS1 may reduce brain inflammation in a context of TLR3 signaling deficiency.

Keywords: NS1; TLR3; West Nile Virus; West Nile neuroinvasive disease; immunity; pathogenesis; subunit vaccine.


Conflict of interest statement

The authors declare no conflict of interest.

Figures

Figure 1
Figure 1
Schematic representation of the West Nile Virus (WNV) N-terminal polyprotein with numbered amino acids (one-letter codes; beginning from the N-terminal (H2N) methionine (M)) and predicted transmembrane domains (bold numbers 1–7). The gE sequence is presented in blue with its neutralization domain III in yellow. NS1 is depicted in grey. External parts of the sequence (labeled extra) are depicted above the symbolic membrane and cytoplasmic parts are shown below (labeled intra). For producing immunizing antigens, the external domains of gE and NS1, respectively, were bracketed each with a synthetic N-terminal signal sequence and two C-terminal tag epitopes (V5 and 6× his). For the ELISA antigens, the DIII domain of gE was supplemented with the synthetic N-terminal signal sequence and with a C-terminal c-myc-GST-tail. Similarly, the NS1 fragment from aa 792 to 1050 was bracketed with the same features. (Picture exported from PROTTER, Protter: interactive protein feature visualization and integration with experimental proteomic data) [49].
Figure 2
Figure 2
Antibody responses prior to WNV challenge infection. The groups of mice tested (see Table 1) are indicated on the x-axis. Panels (A), (C), and (E) represent WT mice; panels (B), (D), and (F) represent TLR3KO mice. Each symbol represents an individual mouse; the horizontal line indicates the mean value for each group. Panels (AD) show ELISA values as measured at OD450 nm (y-axis). (A,B): ELISA for NS1 antibodies; (C,D): ELISA for gE antibodies. All sera were tested on the same plate. Separated by a dotted line on the right of each panel (AD) the value of a positive control is given, which was determined by using an anti-C-myc monoclonal antibody for testing the amount of coated antigen. Panels (E,F): WNV-neutralizing antibodies as detected by plaque reduction neutralization assay (PRNT), with the titer indicated on the y-axis. The horizontal dotted line indicates the negative cut-off value, which equals a serum dilution of 1:80, the lowest dilution used in the assay. The values below this cut-off are fictional. Where applicable, one-way ANOVA with Tukey’s test for multiple comparisons was used to investigate statistical differences between the groups. Significant differences are indicated by asterisks.
Figure 3
Figure 3
Survival of mice after experimental WNV infection. (A) Mock immunized; (B) NS1 immunized. Red dotted lines used to show WT mice; blue dotted lines used to indicate TLR3KO mice. The time in days is given on the x-axis, starting at the day of experimental inoculation with 100 LD50 of WNV Italy 09. The y-axis gives the percentage of surviving animals (for additional information see Table 1). Note: In order to not overload the figure, the data of groups with a 100% survival rate were not included in this figure.
Figure 4
Figure 4
Clinical scores post challenge with WNV. Panels (A), (B), and (C) show data for wild type mice; (D), (E), and (F) show data for TLR3KO mice. (A,D): mock-immunized animals; (B,E): NS1-immunized animals; (C,F): gE-immunized animals. Each bar represents the cumulative clinical score of one individual mouse at its day of euthanasia. The y-axis represents the individual mice per immunized group having a total score of 1 or more. Mice counted as survivors were euthanized at day 19 post challenge. The bars are color-coded as follows: black represents points allocated for weight loss; red represents pain-associated behavior; purple represents physical changes. Note: In order to not overload the figure with empty graphs, the data of mice immunized with both gE and NS1, all of which did not show any measurable disease signs, are not included in this figure.
Figure 5
Figure 5
Levels of WNV RNA in the organs of WNV-infected mice. Separate panels are shown for plasma (A and B are each split into day 2 on the left and day 4 on the right), spleen (C,D), and brain (E,F) samples. Panels (A,C,E): WT mice; (B,D,F): TLR3KO mice. The loads of WNV in the individual samples were determined by RT-qPCR and each dot in each panel represents one single animal. The y-axis of each panel represents the logarithmic value of viral genome copies detected per mL of either blood plasma or organ suspension. The individual groups of animals are listed on the x-axis. Note: Samples which did not provide a Ct value, i.e. where WNV could not be detected, have been excluded from the figure.
Figure 6
Figure 6
Leukocyte infiltration upon WNV infection of the brain. The brains of all experimental wild type (A,C,E,G) and TLR3KO mice (B,D,F,H) were subjected to histological scoring (A,B) and flow cytometric analysis (FACS) for the detection and quantification of inflammatory cells, including neutrophils (C,D), monocytes (E,F), and lymphocytes (G,D). To recognize the role of WNV in the context of CNS inflammation, the individuals were stratified into those with detectable WNV RNA in their brains (WNV+) and those without (WNV). WNV+ individuals have been further color coded to represent different groups: gE green, NS1 yellow, gE + NS1 blue, and mock red, respectively. In addition to the individual values, the mean is also presented. The Mann-Whitney test was used to investigate statistical differences between the groups. Significant differences are indicated by asterisks with *, p < 0.05; ***, p < 0.001; ****, p < 0.0001.
Figure 7
Figure 7
WNV loads and total cellular and monocytic infiltrates after NS1- or mock-vaccination. (A) log WNV viral copies per mL (y-axis) in the brains of the WNV-positive NS1- and mock-immunized mice, respectively. (B) The number of granulocytes, monocytes, and lymphocytes were added to each other to give the total amount of infiltrating inflammatory cells in the brains (y-axis) of the same mice. (C) log monocyte counts in the brains (y-axis) of WNV-positive NS1- (black) and mock- (red) immunized mice, respectively.
Figure 8
Figure 8
Cytokine response upon WNV infection of the brain. RNA was extracted from brains of all experimental mice and analyzed for cytokine RNAs by qRT-PCR. The Ct values were set in relation to beta-actin mRNA as described in Materials and Methods. On the y-axis, the results of these calculations are shown as log10 values. The data were stratified into a group representing animals with WNV RNA in their brain tissue (WNV+) and those without (WNV). Panel (A): IFNγ mRNA in WT mice. Panel (B): the same in TLR3KO mice. Panel (C): TNFα mRNA in WT mice. Panel (D): the same in TLR3KO mice. All individual values as well as the mean are indicated.
Figure 9
Figure 9
Viral load in the CNS correlates largely with TNFα expression but not with lymphocyte counts. The WNV load in the brains of both WT and TLR3KO mice were expressed as log10 values and paired with (A) log10 values of either TNFα mRNA or (B) with log10 values of lymphocyte counts in the CNS of each individual before being presented in an X,Y graph. The regression formula as well as the R2 values are indicated in each graph.

Similar articles

Cited by

References

    1. Kramer L.D., Styer L.M., Ebel G.D. A Global Perspective on the Epidemiology of West Nile Virus. Annu. Rev. Entomol. 2008;53:61–81. doi: 10.1146/annurev.ento.53.103106.093258. - DOI - PubMed
    1. Sotelo E., Gutierrez-Guzmán A., Del Amo J., Llorente F., El-Harrak M., Pérez-Ramírez E., Blanco J., Höfle U., Jiménez-Clavero M. Pathogenicity of two recent Western Mediterranean West Nile virus isolates in a wild bird species indigenous to Southern Europe: The red-legged partridge. Vet. Res. 2011;42:11. doi: 10.1186/1297-9716-42-11. - DOI - PMC - PubMed
    1. Del Amo J., Llorente F., Figuerola J., Soriguer R.C., Moreno A.M., Cordioli P., Weissenböck H., Jiménez-Clavero M.Á. Experimental infection of house sparrows (Passer domesticus) with West Nile virus isolates of Euro-Mediterranean and North American origins. Vet. Res. 2014;45:33. doi: 10.1186/1297-9716-45-33. - DOI - PMC - PubMed
    1. Pérez-Ramírez E., Llorente F., del Amo J., Nowotny N., Jiménez-Clavero M.Á. Susceptibility and role as competent host of the red-legged partridge after infection with lineage 1 and 2 West Nile virus isolates of Mediterranean and Central European origin. Vet. Microbiol. 2018;222:39–45. doi: 10.1016/j.vetmic.2018.06.012. - DOI - PubMed
    1. Monath T.P., Liu J., Kanesa-Thasan N., Myers G.A., Nichols R., Deary A., McCarthy K., Johnson C., Ermak T., Shin S., et al. A live, attenuated recombinant West Nile virus vaccine. Proc. Natl. Acad. Sci. USA. 2006;103:6694–6699. doi: 10.1073/pnas.0601932103. - DOI - PMC - PubMed

Publication types

MeSH terms