. 2019 Jul 3;7(3):60.
doi: 10.3390/vaccines7030060.

Potential Role of Rainbow Trout Erythrocytes as Mediators in the Immune Response Induced by a DNA Vaccine in Fish

Affiliations

Potential Role of Rainbow Trout Erythrocytes as Mediators in the Immune Response Induced by a DNA Vaccine in Fish

Sara Puente-Marin et al. Vaccines (Basel). .

Abstract

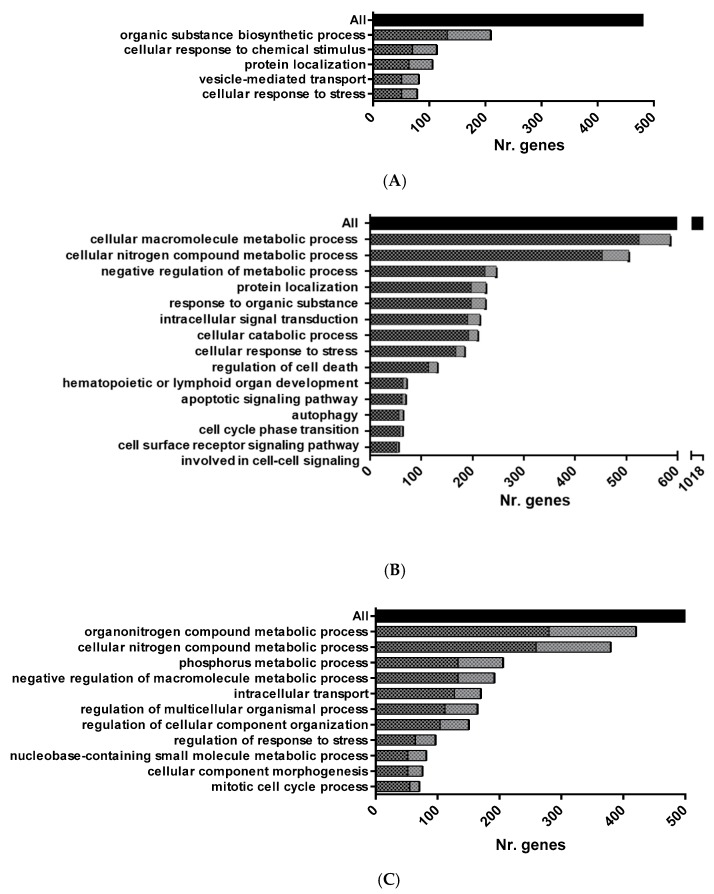
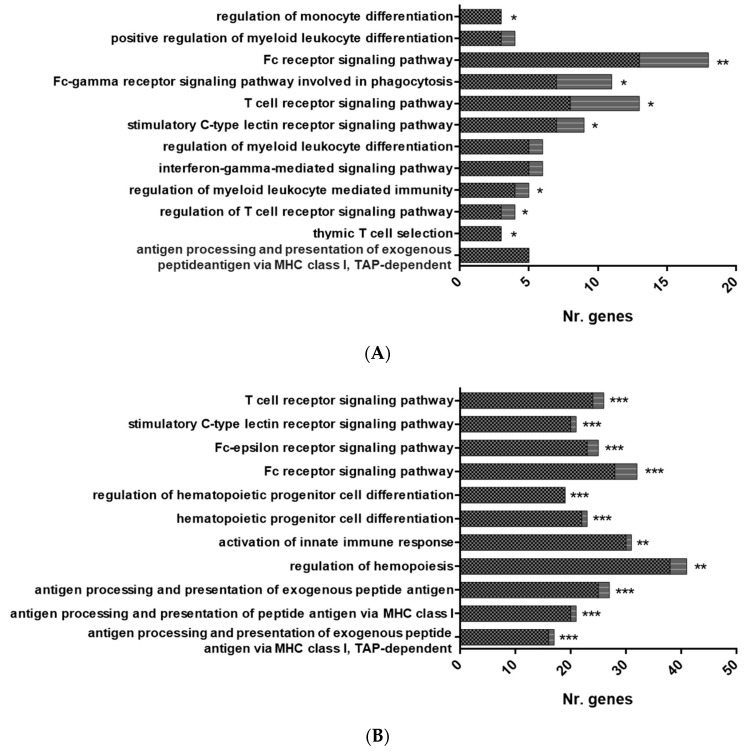
In recent years, fish nucleated red blood cells (RBCs) have been implicated in the response against viral infections. We have demonstrated that rainbow trout RBCs can express the antigen encoded by a DNA vaccine against viral hemorrhagic septicemia virus (VHSV) and mount an immune response to the antigen in vitro. In this manuscript, we show, for the first time, the role of RBCs in the immune response triggered by DNA immunization of rainbow trout with glycoprotein G of VHSV (GVHSV). Transcriptomic and proteomic profiles of RBCs revealed genes and proteins involved in antigen processing and presentation of exogenous peptide antigen via MHC class I, the Fc receptor signaling pathway, the autophagy pathway, and the activation of the innate immune response, among others. On the other hand, GVHSV-transfected RBCs induce specific antibodies against VHSV in the serum of rainbow trout which shows that RBCs expressing a DNA vaccine are able to elicit a humoral response. These results open a new direction in the research of vaccination strategies for fish since rainbow trout RBCs actively participate in the innate and adaptive immune response in DNA vaccination. Based on our findings, we suggest the use of RBCs as target cells or carriers for the future design of novel vaccine strategies.

Keywords: GVHSV; antigen presentation; erythrocytes; proteome; rainbow trout; red blood cells; transcriptome.


Conflict of interest statement

The authors declare no conflict of interest

Figures

Figure 1
Figure 1
The general workflow of experimental steps from sample collection, 14 dpi, to data analysis.
Figure 2
Figure 2
Overrepresented functional pathways in RBCs from GVHSV-immunized fish. Main overrepresented GO Biological Process Database terms were identified by the Cytoscape ClueGO. (A) Overrepresented pathways in HK-RBC transcriptome profile. (B) Overrepresented pathways in PB-RBC transcriptome profile. (C) Overrepresented pathways in PB-RBC proteome profile. Black squares represent upregulated genes or proteins, and gray squares represent downregulated genes or proteins identified in each GO term. The black bar represents the total number of genes or proteins with FDR < 0.05 and FC p-value < 0.05. All GO terms overrepresented were statistically significant with p-value < 0.05.
Figure 3
Figure 3
Overrepresented functional pathways in RBCs from GVHSV-immunized fish. Overrepresented GO Immune System Process terms were identified by the Cytoscape ClueGO. (A) Overrepresented pathways in the HK-RBC transcriptome profile. (B) Overrepresented pathways in the PB-RBC transcriptome profile. (C) Overrepresented pathways in the PB-RBC proteome profile. Black squares represent upregulated genes or proteins, and gray squares represent downregulated genes or proteins identified in each GO term. Asterisks denote GO-term significance: * p-value < 0.05, ** p-value < 0.01 and *** p-value < 0.001. Overrepresented terms in the GO Immune System Process network are shown in the (D) HK-RBC transcriptome profile, (E) PB-RBC transcriptome profile, and (F) PB-RBC proteome profile. Each node represents a GO term from an Immune System Process. Node size shows GO term significance (p-value); a smaller p-value is represented by a larger node size. Edges between nodes indicate the presence of common genes; a thicker line implies a larger overlap. The most significant GO term for each group is labeled.
Figure 3
Figure 3
Overrepresented functional pathways in RBCs from GVHSV-immunized fish. Overrepresented GO Immune System Process terms were identified by the Cytoscape ClueGO. (A) Overrepresented pathways in the HK-RBC transcriptome profile. (B) Overrepresented pathways in the PB-RBC transcriptome profile. (C) Overrepresented pathways in the PB-RBC proteome profile. Black squares represent upregulated genes or proteins, and gray squares represent downregulated genes or proteins identified in each GO term. Asterisks denote GO-term significance: * p-value < 0.05, ** p-value < 0.01 and *** p-value < 0.001. Overrepresented terms in the GO Immune System Process network are shown in the (D) HK-RBC transcriptome profile, (E) PB-RBC transcriptome profile, and (F) PB-RBC proteome profile. Each node represents a GO term from an Immune System Process. Node size shows GO term significance (p-value); a smaller p-value is represented by a larger node size. Edges between nodes indicate the presence of common genes; a thicker line implies a larger overlap. The most significant GO term for each group is labeled.
Figure 4
Figure 4
The protein–protein interaction (PPI) network of the set of DEGs/DEPs identified in the overrepresented GO Immune System Process terms. PPI networks were constructed using the STRING software. (A) The PPI network of identified DEGs from the HK-RBC transcriptome profile. (B) The PPI network of identified DEGs from the PB-RBC transcriptome profile. (C) The PPI network of identified DEPs from the PB-RBC proteome profile. Nodes represent proteins, while edges denote the interactions between 2 proteins. Different line colors represent the evidence types used in predicting the associations: gene fusion (red), gene neighborhood (green), gene co-occurrence (blue), co-expression (black), from curated databases (teal), experimentally text-mining (yellow), determined (purple), or protein homology (lilac). The PPI enrichment p-value was < 1.0−16 for the 3 networks represented. Red nodes denote proteins implicated in (A) the Fc receptor signaling pathway (GO:0038093), (B) antigen processing and presentation of peptide antigen via MHC class I (GO:0002474), and (C) antigen processing and presentation of exogenous peptide antigen (GO:0002478). Blue nodes denote proteins implicated in (A) T cell receptor signaling pathway (GO:0050852), (B) antigen processing and presentation of exogenous peptide antigen (GO:0002478), and (C) regulation of hemopoiesis (GO:1903706). Green nodes denote proteins implicated in the regulation of myeloid leukocyte differentiation (GO:0002761).
Figure 5
Figure 5
The RT-qPCR analysis of the overrepresented pathways. PB-RBCs were purified from rainbow trout immunized with GVHSV (black bars) or TFP1 (gray bars) at 14 dpi. Gene expression was evaluated by RT-qPCR. Data are displayed as mean ± standard deviation (SD) (n = 6). The ef1α gene was used as an endogenous control. The Mann–Whitney test was performed to compare PB-RBCs between GVHSV- and TFP1-injected individuals.
Figure 6
Figure 6
The white blood cell (WBC) proliferation after coculture with GVHSV-transfected RBCs. RBCs and WBCs were purified from the peripheral blood of rainbow trout. WBCs were cocultured with autologous TFP1-transfected RBCs (control), RBCs and PHA-L (positive control), or GVHSV-transfected RBCs. (A) WBC proliferation was measured after 7 days as a percentage of fluorescent nuclei (Hoechst stain) using the IN Cell Analyzer and calculated using the following formula: ((number of cell nuclei in WBCs and treated RBCs − number of cell nuclei in untreated RBCs) ÷ (the number of cell nuclei in WBCs and control RBCs – number of cell nuclei in untreated RBCs)) × 100. Data are displayed as mean ± SD (n = 4). Data are shown relative to the TFP1 condition (control, red line). A Kruskal–Wallis with Dunn’s multiple comparisons test was performed between each condition and the control. * p-value < 0.05). (B) WBC gene expression of lymphocyte cell markers was measured at 7 days in cocultures of WBCs and GVHSV- or TFP1-transfected RBCs. Gene expression was evaluated by RT-qPCR. Data are displayed as mean ± SD (n = 4). The ef1α gene was used as an endogenous control. Data shown are relative to the TFP1 condition (control, red line). A Wilcoxon test was performed to compare coculture of WBCs and GVHSV-transfected RBCs with WBCs and TFP1-transfected RBCs.
Figure 7
Figure 7
The VHSV-specific antibody detection in serum of GVHSV-transfected RBCs-reinfused/immunized fish. Serum dilution from: (i) im GVHSV-immunized individuals, (ii) iv GVHSV-immunized individuals, and (iii) iv GVHSV-transfected RBCs-reinfused/immunized individuals. Serum obtained from VHSV-challenged survivor trout was used as a positive control, and serum from unimmunized, uninfected fish was used as a negative control. Anti-VHSV antibodies were detected by absorbance readings at 450 nm. Results are expressed as mean ± SD of absorbance (n = 4), performed in triplicate.

Similar articles

Cited by

References

    1. Food and Agriculture Organization of the United Nations (FAO) The State Of World Fisheries and Aquaculture. Meeting the Sustainable Development Goals. FAO; Rome, Italy: 2018.
    1. Collins C., Lorenzen N., Collet B. DNA vaccination for finfish aquaculture. Fish. Shellfish Immunol. 2019;85:106–125. doi: 10.1016/j.fsi.2018.07.012. - DOI - PubMed
    1. Tonheim T.C., Bogwald J., Dalmo R.A. What happens to the DNA vaccine in fish? A review of current knowledge. Fish. Shellfish Immunol. 2008;25:1–18. doi: 10.1016/j.fsi.2008.03.007. - DOI - PubMed
    1. Kurath G. Fish. Novirhabdoviruses. Caister Academic Press; Norfolk, UK: 2012.
    1. Sommerset I., Krossoy B., Biering E., Frost P. Vaccines for fish in aquaculture. Expert Rev. Vaccines. 2005;4:89–101. doi: 10.1586/14760584.4.1.89. - DOI - PubMed