. 2019 Sep 4;103(5):891-908.e6.
doi: 10.1016/j.neuron.2019.05.050. Epub 2019 Jul 2.

Natural and Drug Rewards Engage Distinct Pathways that Converge on Coordinated Hypothalamic and Reward Circuits

Affiliations

Natural and Drug Rewards Engage Distinct Pathways that Converge on Coordinated Hypothalamic and Reward Circuits

Amber L Alhadeff et al. Neuron. .

Abstract

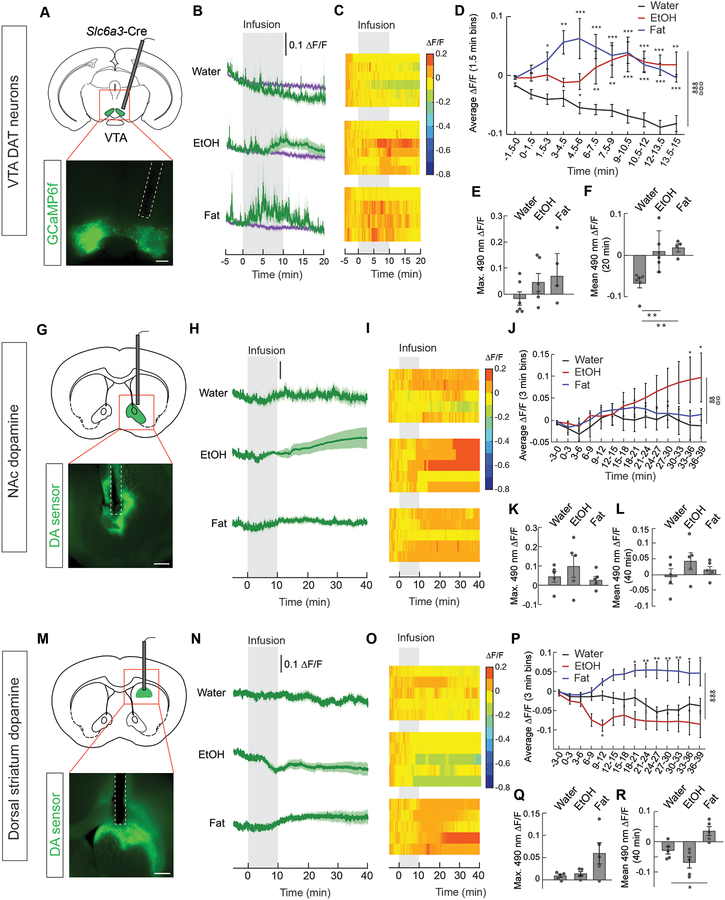
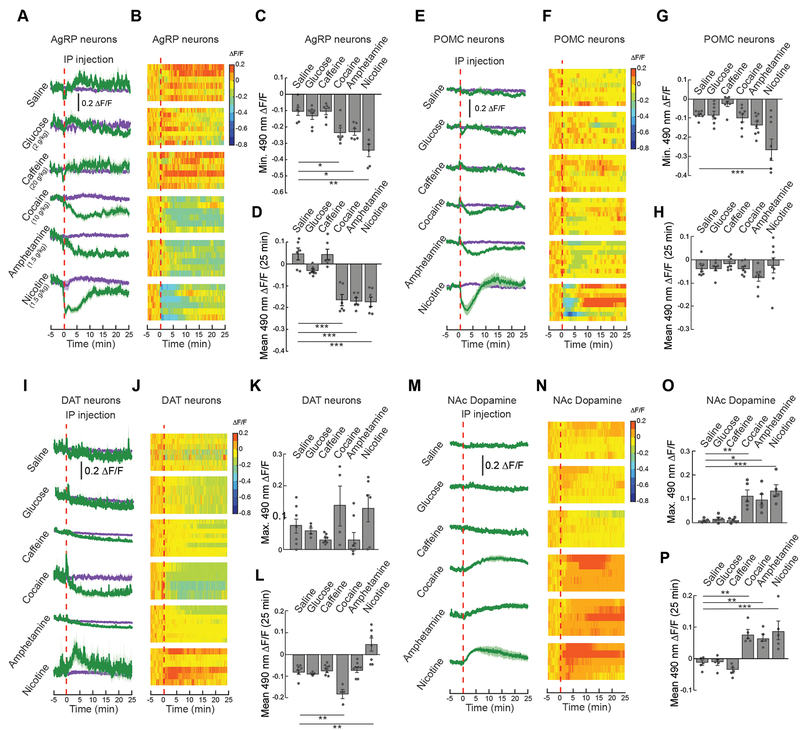
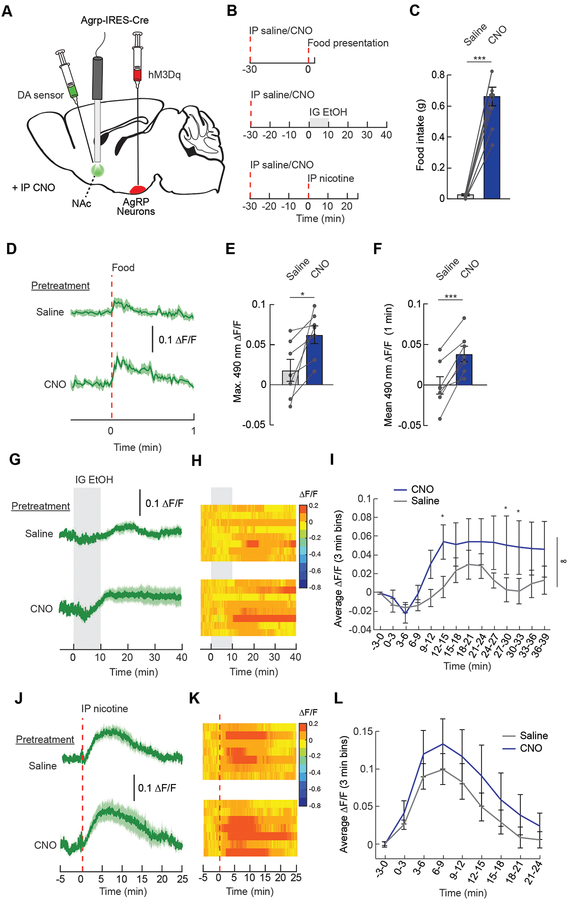
Motivated behavior is influenced by neural networks that integrate physiological needs. Here, we describe coordinated regulation of hypothalamic feeding and midbrain reward circuits in awake behaving mice. We find that alcohol and other non-nutritive drugs inhibit activity in hypothalamic feeding neurons. Interestingly, nutrients and drugs utilize different pathways for the inhibition of hypothalamic neuron activity, as alcohol signals hypothalamic neurons in a vagal-independent manner, while fat and satiation signals require the vagus nerve. Concomitantly, nutrients, alcohol, and drugs also increase midbrain dopamine signaling. We provide evidence that these changes are interdependent, as modulation of either hypothalamic neurons or midbrain dopamine signaling influences reward-evoked activity changes in the other population. Taken together, our results demonstrate that (1) food and drugs can engage at least two peripheral→central pathways to influence hypothalamic neuron activity, and (2) hypothalamic and dopamine circuits interact in response to rewards.


Conflict of interest statement

DECLARATION OF INTERESTS

The authors declare no competing interests.

Figures

Figure 1.
Figure 1.. Intragastric alcohol decreases in vivo AgRP neuron activity.
(A) Dual-wavelength fiber photometry (FP) setup used to record calcium-dependent fluorescence (excited at 490 nm) and calcium-independent fluorescence (excited at 405 nm) in mice during intragastric infusion of ethanol (EtOH). (B) Schematics for monitoring calcium dynamics in hypothalamic neurons, and representative image of GCaMP6s in AgRP (top) and POMC (bottom) neurons. Scale bars, 500 μm. (C) Average ΔF/F of GCaMP6s signals in AgRP neurons of food-restricted mice infused with saline (n=9), 5% EtOH (n=7), or 15% EtOH (n=6). Signals are aligned to the start of infusion. Green, 490-nm signal; purple, 405-nm control signal. Darker lines represent means and lighter shaded areas represent SEMs. (D) Heat maps reporting ΔF/F of the 490-nm signal of the recordings in individual mice in (C). (E) Mean ΔF/F of the 490-nm signal in 3-min bins from mice infused with EtOH in (C) (n=6–9/group, two-way repeated measures ANOVA, p<0.001). (F) Average ΔF/F of GCaMP6s signals in POMC neurons of food-restricted mice infused with water (n=7), 5% EtOH (n=7), or 15% EtOH (n=6). (G) Heat maps reporting ΔF/F of the 490-nm signal of individual mice in (F) (n=7/group). (H) Minimum ΔF/F of the 490-nm signal following gastric infusion of mice in (F) (n=6–7/group, one-way ANOVA, p=ns). (I) Mean ΔF/F of the 490-nm signal from 0 to 30 min following gastric infusion of mice in (F) (n=6–7/group, one-way ANOVA, p=ns). Data are expressed as mean ± SEM, ns p>0.05, t-tests and post-hoc comparisons: **p<0.01, ***p<0.001; ANOVA interaction: ∞∞∞p<0.001; ANOVA main effect of group: ☼☼☼p<0.001. See also Figures S1–S3.
Figure 2.
Figure 2.. Alcohol, unlike glucose, does not condition a preemptive change in AgRP neuron activity.
(A) Habituated, food-restricted mice were given 10% EtOH or control solution and AgRP or POMC neuron activity was recorded. (B) Average ΔF/F of GCaMP6s signals in AgRP neurons of food-restricted mice drinking 10% EtOH (n=11) or control (n=10) solutions. Signals are aligned to the presentation of solution. Green, 490-nm signal; purple, 405-nm control signal. Darker lines represent means and lighter shaded areas represent SEMs. (C) Heat maps reporting ΔF/F of the 490-nm signal of the recordings in individual mice in (B). (D) Mean ΔF/F of the 490-nm signal in 3-min bins from mice drinking 10% EtOH (n=10–11/group, two-way repeated measures ANOVA, p<0.001). (E) Minimum ΔF/F of the 490-nm signal following EtOH drinking (n=10–11/group, one-way ANOVA, p=ns). (F) Mean ΔF/F of the 490-nm signal from 0 to 30 min following EtOH drinking (n=10–11/group, one-way ANOVA, p<0.01). (G) Cumulative 10% EtOH consumed over recording period. (H) Naïve, food-restricted mice were presented with glucose (14%, equicaloric to 10% EtOH) and AgRP or POMC neuron activity was recorded. Data were aligned to the presentation of glucose. (I) Average ΔF/F of GCaMP6s signals in AgRP neurons of food-restricted mice following presentation of glucose (n=13). (J) Food-restricted mice were presented with 14% glucose (naïve), 14% glucose (habituated), or 10% EtOH (habituated) and AgRP neuron activity was recorded. Data are aligned to the first lick. (K) Average ΔF/F of GCaMP6s signals in AgRP neurons of food-restricted mice following first lick of glucose or EtOH (n=8–13/group). (L) Average ΔF/F (5-s average) of the 490-nm signal before the first lick. Data are aligned to first lick at time=0 min (n=8–13/group, two-way repeated measures ANOVA, p<0.001). (M) Schematic for optogenetic activation of AgRP neurons, and representative image of ChR2 in AgRP neurons. Scale bar, 500 μm. (N) Water, EtOH, and glucose intake (in mL) during 1 h of AgRP neuron stimulation (n=11/group, one-way repeated measures ANOVA, p<0.001). (O) EtOH and glucose intake (in kcal) during 1 h of AgRP neuron stimulation (n=11/group, paired t-test, p<0.01). (P) Glucose intake with and without 0.3mM quinine during 1 h of AgRP neuron stimulation (n=6/group, paired t-test, p=ns). (Q) Glucose (0.16 kcal/mL) or glucose+EtOH intake (0.32 kcal/mL, 0.16 kcal/mL glucose and 0.16 kcal/mL EtOH) during 1 h of AgRP neuron stimulation (n=6/group, paired t-test, p=ns). Data are expressed as mean ± SEM, ns p>0.05, t-tests and post-hoc comparisons: **p<0.01, ***p<0.001; ANOVA interaction: ∞∞∞p<0.001; ANOVA main effect of group: ☼☼☼p<0.001. See also Figure S4.
Figure 3.
Figure 3.. Alcohol does not require vagal gut-brain signaling to reduce AgRP neuron activity.
(A) A complete subdiaphragmatic vagotomy (VGX) was performed prior to in vivo neural activity recordings in mice. (B) Food intake in control and VGX mice following IP injection of CCK (n=4/group, two-way repeated measures ANOVA, main effect of group p<0.01). (C) Representative image of Fluoro-Gold in the DMX of control (top) and VGX (bottom) mice. Scale bar, 100 μm. (D) Average ΔF/F of GCaMP6s signals in AgRP neurons of sham or VGX mice following IP injection of CCK or PYY (n=7/group). Signals are aligned to IP injection. Green, 490-nm signal; purple, 405-nm control signal. Darker lines represent means and lighter shaded areas represent SEMs. (E) Heat maps reporting ΔF/F of the 490-nm signal of the recordings in individual mice in (D). (F) Mean ΔF/F of the 490-nm signal (3-min bins) in AgRP neurons in sham or VGX mice following IP injection of CCK (n=7/group, two-way repeated measures ANOVA, p<0.001). (G) Mean ΔF/F of the 490-nm signal (3-min bins) in AgRP neurons in sham or VGX mice following IP injection of PYY (n=4–6/group, two-way repeated measures ANOVA, p<0.01). (H) Average ΔF/F of GCaMP6s signals in AgRP neurons of sham or VGX mice following intragastric infusion of fat or EtOH (n=4/group). (I) Heat maps reporting ΔF/F of the 490-nm signal of the recordings in individual mice in (H). (J) Mean ΔF/F of the 490-nm signal (3-min bins) in AgRP neurons in sham or VGX mice following intragastric infusion of fat (n=4/group, two-way repeated measures ANOVA, p<0.001). (K) Mean ΔF/F of the 490-nm signal (3-min bins) in AgRP neurons in sham or VGX mice following intragastric infusion of EtOH (n=6–10/group, two-way repeated measures ANOVA, p=ns). Data are expressed as mean ± SEM, ns p>0.05, t-tests and post-hoc comparisons: *p<0.05, **p<0.01, ***p<0.001; ANOVA interaction: ∞∞p<0.01, ∞∞∞p<0.001; ANOVA main effect of group: ☼☼p<0.01, ☼☼☼p<0.001. See also Figures S5 and S6.
Figure 4.
Figure 4.. Alcohol acutely reduces food intake in food deprived, but not ad libitum-fed, mice.
(A) Food (chow) intake following intragastric infusion of EtOH in ad libitum-fed mice (n=6–7/group, two-way repeated measures ANOVA, p=ns). (B) Food intake following IP injection of EtOH in ad libitum-fed mice (n=10/group, two-way repeated measures ANOVA, p=ns). (C) Food intake following intragastric infusion of EtOH in 24 h food-deprived mice (n=6–7/group, two-way repeated measures ANOVA, p<0.01). (D) Food intake following IP injection of EtOH in 24 h food-deprived (n=10/group, two-way repeated measures ANOVA, p<0.01) (E) Food intake in ad libitum-fed mice treated daily with IP injection of EtOH (n=9/group, two-way repeated measures ANOVA, p=ns). (F) Body weight (% of original weight) in mice treated daily with IP injection of EtOH (n=9/group, two-way repeated measures ANOVA, p=ns). Data are expressed as mean ± SEM, ns p>0.05.
Figure 5.
Figure 5.. Nutrients and alcohol increase dopamine signaling.
(A) Schematic for monitoring calcium dynamics in dopamine neurons, and representative image of GCaMP6f in neurons expressing dopamine active transporter (Slc6a3, DAT neurons). Scale bar, 500 μm. (B) Average ΔF/F of GCaMP6f signals in DAT neurons of food-restricted mice following intragastric infusion of water (n=6), EtOH (n=6), or fat (n=4). (C) Heat maps reporting ΔF/F of the 490-nm signal of individual mice in (B). (D) Mean ΔF/F of the 490-nm signal in 90-s bins from mice infused with EtOH, fat, or water in (B) (n=4–6/group, two-way repeated measures ANOVA, p<0.001). (E) Maximum ΔF/F of the 490-nm signal following gastric infusion of mice in (B) (n=4–6/group, one-way ANOVA, p=ns). (F) Mean ΔF/F of the 490-nm signal from 0 to 20 min following gastric infusion of mice in (B) (n=4–6/group, one-way ANOVA, p<0.01). (G) Schematic for monitoring dopamine signaling in the nucleus accumbens (NAc), and representative image of neurons expressing the dopamine (DA) sensor. Scale bar, 500 μm. (H) Average ΔF/F of DA sensor in food-restricted mice following intragastric infusion of water, EtOH, or fat (n=5/group). (I) Heat maps reporting ΔF/F of the 490-nm signal of the recordings in individual mice in (H). (J) Mean ΔF/F of the 490-nm signal in 3-min bins from mice infused with EtOH, fat, or water in (H) (n=5/group, two-way repeated measures ANOVA, p<0.01). (K) Maximum ΔF/F of the 490-nm signal following gastric infusion of mice in (H) (n=5/group, one-way ANOVA, p=ns). (L) Mean ΔF/F of the 490-nm signal from 0 to 40 min following gastric infusion of mice in (H) (n=5/group, one-way ANOVA, p=ns). (M) Schematic for monitoring dopamine signaling in the dorsal striatum, and representative image of neurons expressing the dopamine (DA) sensor. Scale bar, 500 μm. (N) Average ΔF/F of DA sensor in food-restricted mice following intragastric infusion of water, EtOH, or fat (n=5/group). (O) Heat maps reporting ΔF/F of the 490-nm signal of the recordings in individual mice in (N). (P) Mean ΔF/F of the 490-nm signal in 3-min bins from mice infused with EtOH, fat, or water in (N) (n=5/group, two-way repeated measures ANOVA, p<0.001). (Q) Maximum ΔF/F of the 490-nm signal following gastric infusion of mice in (N) (n=5/group, one-way ANOVA, p=ns). (R) Mean ΔF/F of the 490-nm signal from 0 to 40 min following gastric infusion of mice in (N) (n=5/group, one-way ANOVA, p<0.05). Data are expressed as mean ± SEM, ns p>0.05, t-tests and post-hoc comparisons: *p<0.05, **p<0.01, ***p<0.001; ANOVA interaction: ∞∞p<0.01, ∞∞∞p<0.001; ANOVA main effect of group: ☼☼p<0.01, ☼☼☼p<0.001.
Figure 6.
Figure 6.. Drugs of abuse inhibit AgRP and POMC neuron activity and potentiate dopamine signaling.
(A) Average ΔF/F of GCaMP6s signals in AgRP neurons following IP injection of saline, glucose (2 g/kg), caffeine (20 mg/kg), cocaine (10 mg/kg), amphetamine (1.5 mg/kg), or nicotine (1.5 mg/kg) (n=6–8/group). Signals are aligned to IP injection. Green, 490-nm signal; purple, 405-nm control signal. Darker lines represent means and lighter shaded areas represent SEMs. (B) Heat maps reporting ΔF/F of the 490-nm signal of the recordings in individual mice in (A). (C) Minimum ΔF/F of the 490-nm signal following IP injection of mice in (A) (n=6–8/group, one-way ANOVA, p<0.001). (D) Mean ΔF/F of the 490-nm signal from 0 to 25 min following IP injection of mice in (A) (n=6–8/group, one-way ANOVA, p<0.001). (E) Average ΔF/F of GCaMP6s signals in POMC neurons following IP injection of glucose or drugs (n=7–8/group). (F) Heat maps reporting ΔF/F of the 490-nm signal of the recordings in individual mice in (E). (G) Minimum ΔF/F of the 490-nm signal following IP injection of mice in (E) (n=7–8/group, one-way ANOVA, p<0.001). (H) Mean ΔF/F of the 490-nm signal from 0 to 25 min following IP injection of mice in (E) (n=7–8/group, one-way ANOVA, p=ns). (I) Average ΔF/F of GCaMP6f signal in neurons expressing dopamine active transporter (DAT neurons) following IP injection of glucose or drugs (n=4–8/group). (J) Heat maps reporting ΔF/F of the 490-nm signal of the recordings in individual mice in (I). (K) Maximum ΔF/F of the 490-nm signal following IP injection of mice in (I) (n=4–8/group, one-way ANOVA, p<0.05). (L) Mean ΔF/F of the 490-nm signal from 0 to 25 min following IP injection of mice in (I) (n=4–8/group, one-way ANOVA, p<0.001). (M) Average ΔF/F of neurons expressing a dopamine (DA) sensor in the nucleus accumbens (NAc) following IP injection of glucose or drugs (n=5/group). (N) Heat maps reporting ΔF/F of the 490-nm signal of the recordings in individual mice in (M). (O) Maximum ΔF/F of the 490-nm signal following IP injection of mice in (M) (n=5/group, one-way ANOVA, p<0.001). (P) Mean ΔF/F of the 490-nm signal from 0 to 25 min following IP injection of mice in (M) (n=5/group, one-way ANOVA, p<0.001). Data are expressed as mean ± SEM, ns p>0.05, t-tests and post-hoc comparisons: *p<0.05, **p<0.01, ***p<0.001.
Figure 7.
Figure 7.. AgRP neuron activity potentiates dopamine signaling in response to food and drugs.
(A) Schematic illustrating the expression of the excitatory DREADD hM3Dq in AgRP neurons and the dopamine (DA) sensor in the nucleus accumbens (NAc). Fiber photometry was used to monitor dopamine signaling in the NAc while manipulating AgRP neuron activity with the DREADD ligand clozapine N-oxide (CNO). (B) Experimental timelines: saline or CNO was injected 30 mins prior to food or drug delivery and NAc dopamine signaling was monitored. (C) Food (chow) intake in ad libitum-fed mice expressing hM3Dq in AgRP neurons and DA sensorin the NAc 1 h following IP injection of saline or CNO (2.5 mg/kg) (n=7/group, paired t-test, p<0.001). (D) Average ΔF/F of DA sensor in ad libitum-fed mice pretreated with IP injections of saline or CNO during food (chow) presentation (n=7/group). Signals are aligned to food presentation. Green, 490-nm signal. Darker lines represent means and lighter shaded areas represent SEMs. (E) Maximum ΔF/F of the 490-nm signal of mice in (D) following food presentation (n=7/group, paired t-test, p<0.05). (F) Mean ΔF/F of the 490-nm signal of mice in (D) from 0 to 1 min following food presentation (n=7/group, paired t-test, p<0.001). (G) Average ΔF/F of DA sensor in ad libitum-fed mice pretreated with IP injections of saline or CNO during gastric infusion of 15% EtOH (n=8/group). (H) Heat maps reporting ΔF/F of the 490-nm signal of the recordings in individual mice in (G). (I) Mean ΔF/F of the 490-nm signal in 3-min bins during gastric infusion of the mice in (G) (n=8/group, two-way repeated measures ANOVA, p<0.05). (J) Average ΔF/F of DA sensor in ad libitum-fed mice pretreated with IP injections of saline or CNO during IP injection of nicotine (1.5mg/kg) (n=7/group). (K) Heat maps reporting ΔF/F of the 490-nm signal of the recordings in individual mice in (J). (L) Mean ΔF/F of the 490-nm signal in 3-min bins from mice injected with nicotine in (J) (n=7/group, two-way repeated measures ANOVA, p=ns). Data are expressed as mean ± SEM, ns p>0.05, t-tests and post-hoc comparisons: *p<0.05, **p<0.01, ***p<0.001; ANOVA interaction: ∞∞∞p<0.001; ANOVA main effect of group: ☼☼p<0.01, ☼☼☼p<0.001. See also Figures S7 and S8.
Figure 8.
Figure 8.. Dopamine receptor antagonists attenuate AgRP neuron responses to nutrients and drugs.
(A) Schematic for monitoring GCaMP6s dynamics in AgRP neurons using fiber photometry following IP injection of D1/D2 dopamine receptor antagonists (raclopride, 1 mg/kg and SCH 23390, 0.1 mg/kg). (B) Experimental timelines: IP injections of saline or D1/D2 receptor antagonists were given 15 mins prior to food or drug administration and AgRP neuron activity was monitored. (C) Average ΔF/F of GCaMP6s signal in AgRP neurons of food-deprived mice pretreated with IP injections of saline or D1/D2 antagonists during intragastric infusion of 1 kcal fat (n=6/group). Signals are aligned to the start of the infusion. Green, 490-nm signal; purple, 405-nm control signal. Darker lines represent means and lighter shaded areas represent SEMs. (D) Heat maps reporting ΔF/F of the 490-nm signal of the recordings in individual mice in (C). (E) Mean ΔF/F of the 490-nm signal in 3-min bins during intragastric infusion of fat of the mice in (C) (n=6/group, two-way repeated measures ANOVA, p<0.001). (F) Average ΔF/F of GCaMP6s signal in AgRP neurons of food-deprived mice pretreated with IP injections of saline or D1/D2 antagonists during intragastric infusion of 15% EtOH (n=6/group). (G) Heat maps reporting ΔF/F of the 490-nm signal of the recordings in individual mice in (F). (H) Mean ΔF/F of the 490-nm signal in 3-min bins during intragastric infusion of EtOH of the mice in (F) (n=6/group, two-way repeated measures ANOVA, p<0.001). (I) Average ΔF/F of GCaMP6s signal in AgRP neurons of food-deprived mice pretreated with IP injections of saline or D1/D2 antagonists during IP injection of nicotine (1.5 mg/kg) (n=7/group). (J) Heat maps reporting ΔF/F of the 490-nm signal of the recordings in individual mice in (I). (K) Mean ΔF/F of the 490-nm signal in 3-min bins during IP injection of nicotine of the mice in (I) (n=7/group, two-way repeated measures ANOVA, p<0.001). Data are expressed as mean ± SEM, ns p>0.05, t-tests and post-hoc comparisons: *p<0.05, **p<0.01, ***p<0.001; ANOVA interaction: ∞∞∞p<0.001; ANOVA main effect of group: ☼p<0.05. See also Figures S7 and S8.

Comment in

References

    1. Akerboom J, Chen TW, Wardill TJ, Tian L, Marvin JS, Mutlu S, Calderon NC, Esposti F, Borghuis BG, Sun XR, et al. (2012). Optimization of a GCaMP calcium indicator for neural activity imaging. The Journal of neuroscience : the official journal of the Society for Neuroscience 32, 13819–13840. - PMC - PubMed
    1. Alhadeff AL, Rupprecht LE, and Hayes MR (2012). GLP-1 neurons in the nucleus of the solitary tract project directly to the ventral tegmental area and nucleus accumbens to control for food intake. Endocrinology 153, 647–658. - PMC - PubMed
    1. Alhadeff AL, Su Z, Hernandez E, Klima ML, Phillips SZ, Holland RA, Guo C, Hantman AW, De Jonghe BC, and Betley JN (2018). A Neural Circuit for the Suppression of Pain by a Competing Need State. Cell 173, 140–152 e115. - PMC - PubMed
    1. Aponte Y, Atasoy D, and Sternson SM (2011). AGRP neurons are sufficient to orchestrate feeding behavior rapidly and without training. Nature neuroscience 14, 351–355. - PMC - PubMed
    1. Atasoy D, Betley JN, Su HH, and Sternson SM (2012). Deconstruction of a neural circuit for hunger. Nature 488, 172–177. - PMC - PubMed

Publication types

MeSH terms

LinkOut - more resources