. 2019 Jul 5;4(37):eaav8995.
doi: 10.1126/sciimmunol.aav8995.

Human CD4+CD103+ cutaneous resident memory T cells are found in the circulation of healthy individuals

Affiliations

Human CD4+CD103+ cutaneous resident memory T cells are found in the circulation of healthy individuals

Maria M Klicznik et al. Sci Immunol. .

Abstract

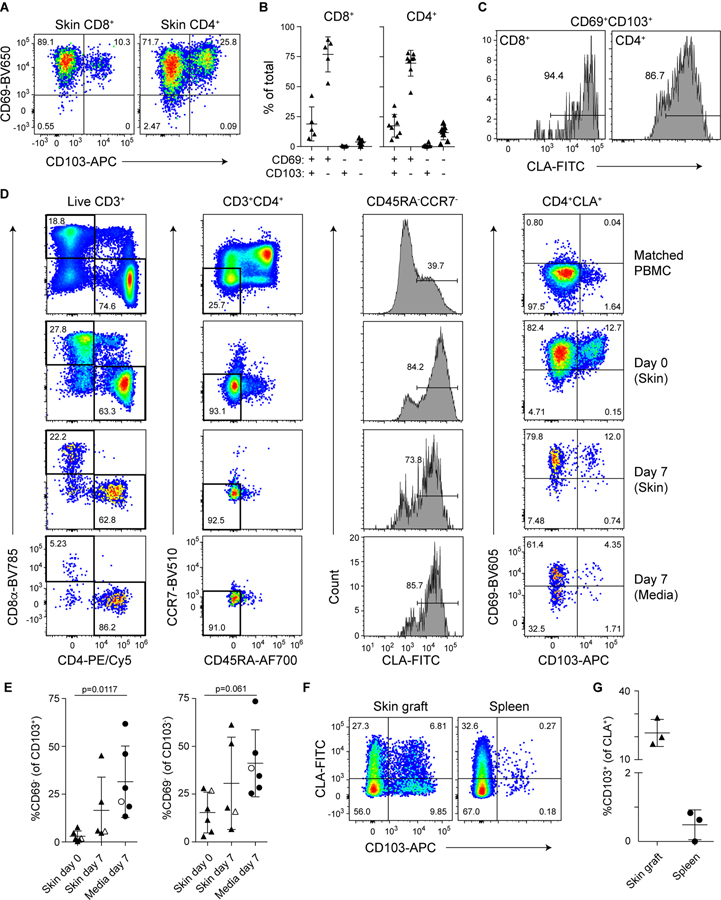
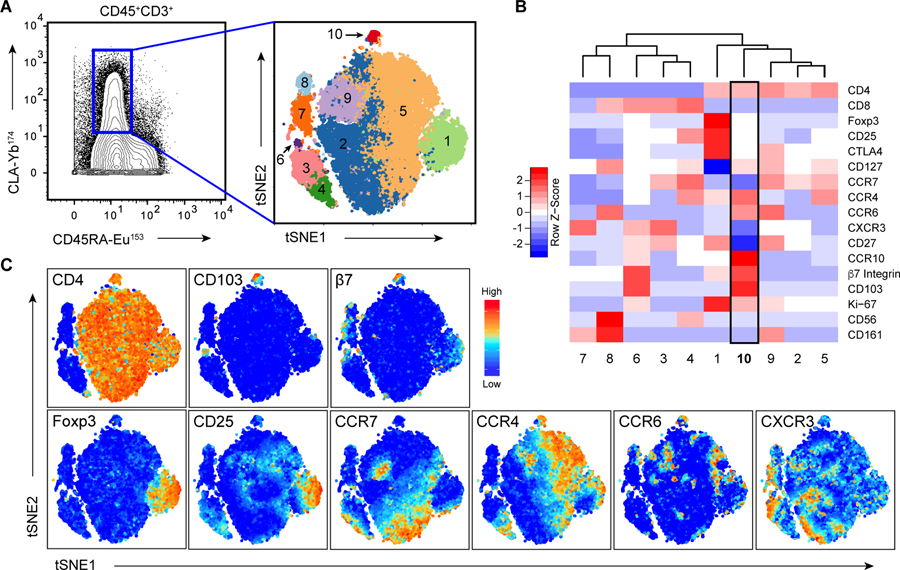
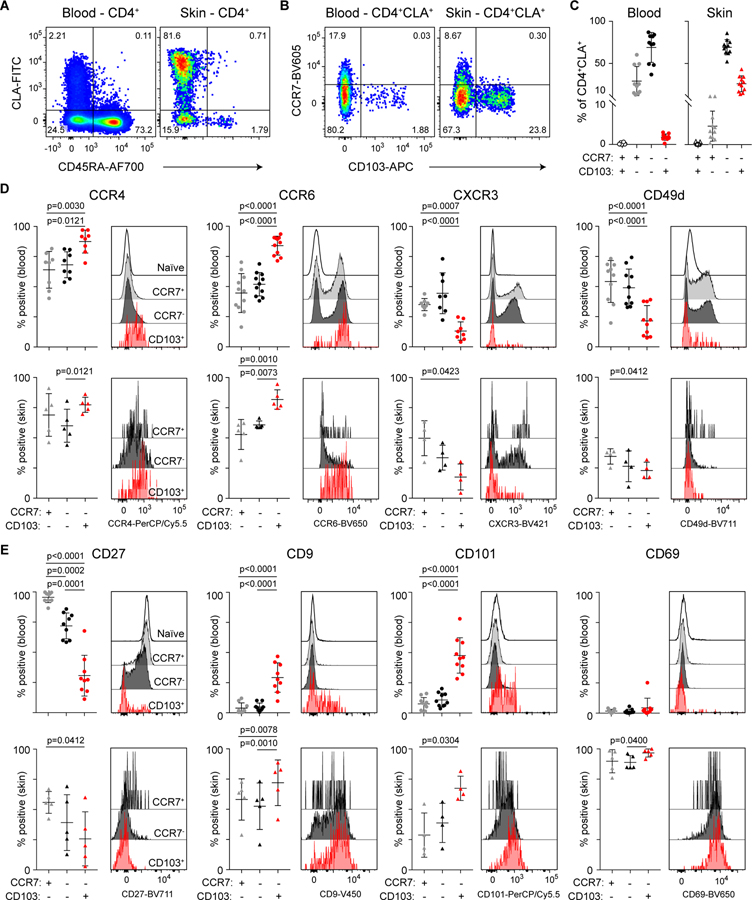
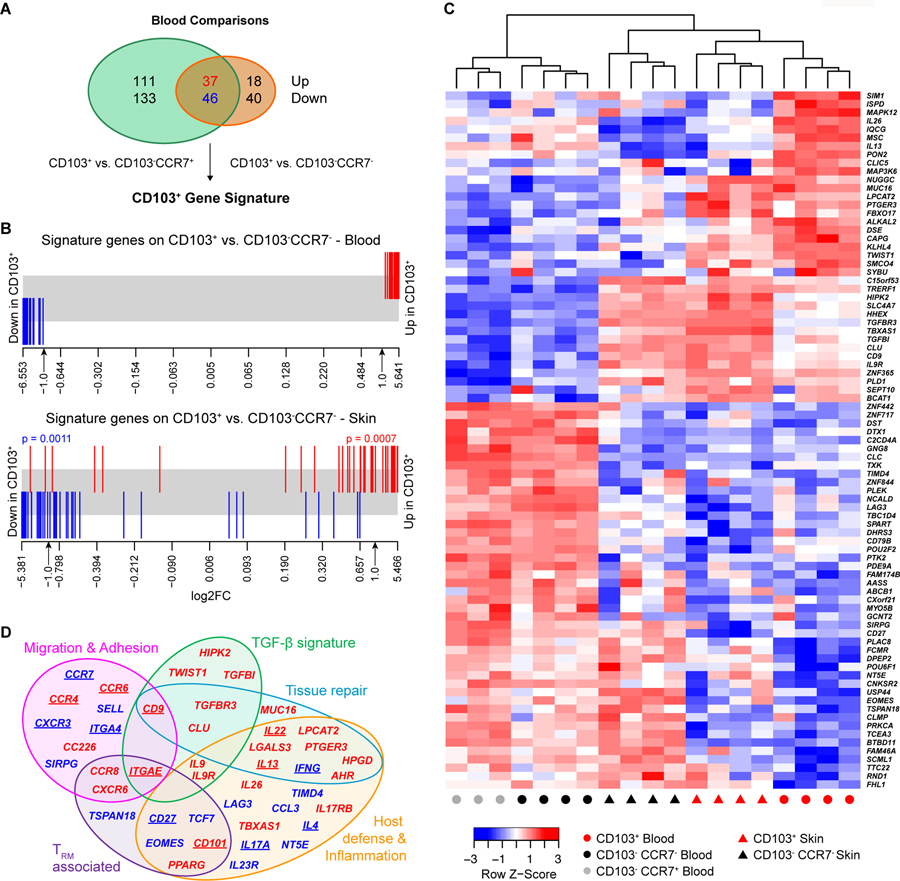
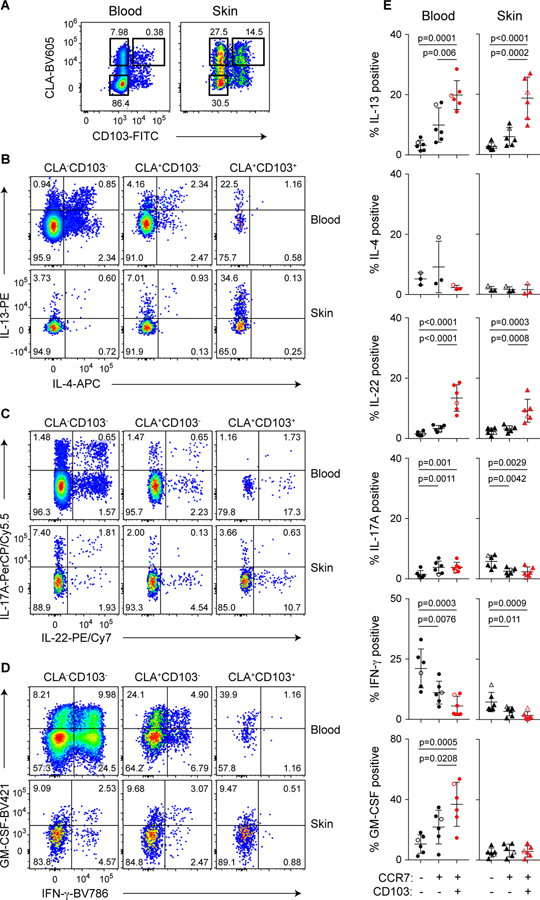
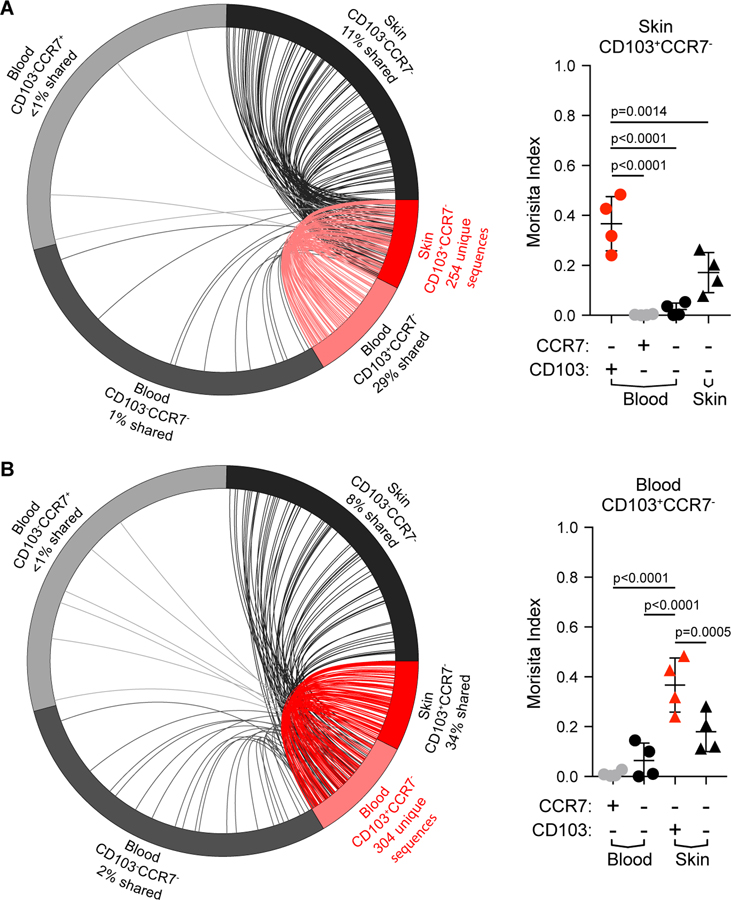
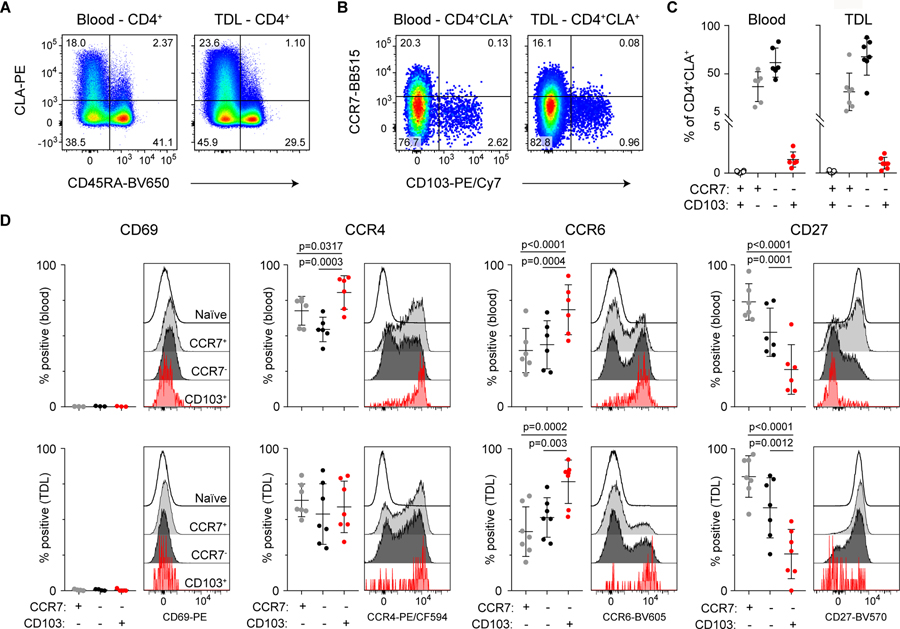
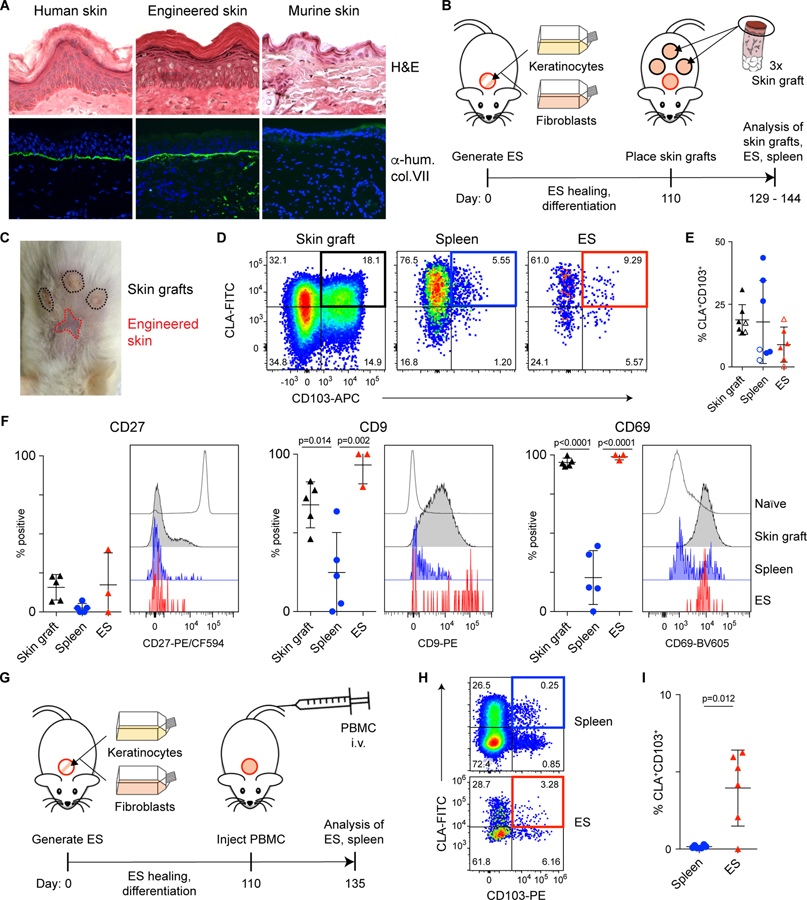
Tissue-resident memory T cells (TRM) persist locally in nonlymphoid tissues where they provide frontline defense against recurring insults. TRM at barrier surfaces express the markers CD103 and/or CD69, which function to retain them in epithelial tissues. In humans, neither the long-term migratory behavior of TRM nor their ability to reenter the circulation and potentially migrate to distant tissue sites has been investigated. Using tissue explant cultures, we found that CD4+CD69+CD103+ TRM in human skin can down-regulate CD69 and exit the tissue. In addition, we identified a skin-tropic CD4+CD69-CD103+ population in human lymph and blood that is transcriptionally, functionally, and clonally related to the CD4+CD69+CD103+ TRM population in the skin. Using a skin xenograft model, we confirmed that a fraction of the human cutaneous CD4+CD103+ TRM population can reenter circulation and migrate to secondary human skin sites where they reassume a TRM phenotype. Thus, our data challenge current concepts regarding the strict tissue compartmentalization of CD4+ T cell memory in humans.


Conflict of interest statement

Competing interests: MMK and IKG are inventors on a pending patent application covering use of the skin humanized mouse model (European file number EP18168258; US file number US16389821). The other authors declare that they have no competing interests.

Figures

Figure 1:
Figure 1:. CD4+CLA+CD103+ T cells downregulate CD69 and exit the skin.
(A) Representative flow cytometry analysis of CD69 and CD103 expression by live gated CD8+ and CD4+ T cells from human skin. (B) Graphical summary of the proportions of CD69- and CD103-defined T cell populations among CD8+ and CD4+ skin T cells. (C) Representative flow cytometry analysis of CLA expression by live gated CD103+CD69+ TRM in human skin. (D) Human skin was adhered to tissue culture plates and cultured for 7 days submerged in media. The ratio of CD4+ and CD8+ T cells and the expression of CLA and CD103 by T cells in the indicated samples were analyzed by flow cytometry. Representative data (N=4). (E) Graphical summary of the proportion of CD69 cells among CD103+ or CD103 live gated CD45RACD4+CLA+ T cells from the indicated samples. Open symbols represent data from a subject with mammary carcinoma but no skin condition. Significance determined by one-way repeated measures ANOVA with Tukey’s post-test for pairwise comparisons. (F) Three 8mm-punch biopsies of healthy human skin per animal (N=3) were placed on the back of NSG mice and grafts as well as spleens were analyzed by flow cytometry 50 days later. Representative flow cytometry analysis of CLA and CD103 expression by live gated human CD45+CD3+CD4+CD25CD45RA T cells. (G) Graphical summary showing CD103 expression by live gated human CD45+CD3+CD4+CD25CD45RACLA+ T cells from skin grafts and spleens of skin-grafted NSG mice.
Figure 2:
Figure 2:. CD4+CLA+CD103+ T cells constitute a unique cell population in human blood.
(A) (Left), Mass cytometry analysis of CD45RA and CLA expression by live gated CD3+CD45+ PBMC showing the gate used to define CD3+CLA+ T cells for subsequent clustering analysis. (Right), t-SNE analysis and clustering of CD3+CLA+ T cells from blood of 5 healthy donors based on expression of CD4, CD8, CCR7, CD103, β7Integrin, CXCR3, CCR6, CCR4, CCR10, Foxp3, CD27, β7 integrin, CD25, CD161, and CD56. (B) Heat map showing relative expression of the indicated markers in each of the CD3+CLA+ cell clusters. (C) t-SNE analysis of CD3+CLA+ T cells overlaid with relative expression of the indicated markers.
Figure 3:
Figure 3:. Shared phenotype of CD4+CLA+CD103+ T cells from human blood and skin.
(A) Representative flow cytometry analysis of CD45RA and CLA expression by live gated CD4+ T cells from blood and skin of healthy donors. (B) Representative flow cytometry analysis of CCR7 and CD103 expression by live gated CD4+CD45RACLA+ memory T cells from blood and skin of healthy donors. (C) Graphical summary of the proportions of CCR7- and CD103-defined T cell populations among CD4+CD45RACLA+ cells from blood and skin. (D,E) Representative flow cytometry analysis and graphical summary of expression of the indicated markers by CD4+ T cell populations in the blood and skin as indicated. Significance determined by one-way repeated measures ANOVA with Tukey’s post-test for pairwise comparisons.
Figure 4:
Figure 4:. CD4+CLA+CD103+ T cells from human blood and skin share a transcriptional profile.
Whole transcriptome profiling by RNA-sequencing was performed on sorted CLA+ T cell subsets from blood or skin. (A) Venn diagram showing the number of significantly differentially expressed (DE) genes (FDR<0.05 and log2 fold-change >1) between CLA+CD103+ T cells and either CLA+CD103CCR7+ or CLA+CD103CCR7 T cells as indicated. The overlapping 83 genes were designated the CD103+ gene signature. (B) Barcode plot showing the distribution of the CD103+ signature genes (red=up- blue=down-regulated in CD103+) relative to gene expression changes comparing CD103+ and CD103CCR7 T cells from the blood or skin as indicated. Significance determined by rotation gene set testing for linear models. (C) Heat map and hierarchical clustering of RNA-seq samples from the indicated blood and skin cell populations based on the CD103+ gene signature. (D) Venn diagram showing functional annotation of key genes up- or down-regulated by CLA+CD103+ T cells in blood or skin identified in our phenotypic, functional, and transcriptional analyses. Category names were assigned based on described functions of the indicated genes in the published literature. Underlined gene names indicate proteins whose expression pattern was validated by flow cytometry in Figs 3 and 5.
Figure 5:
Figure 5:. CD4+CLA+CD103+ T cells from human blood and skin share a functional profile.
(A) Representative flow cytometry analysis of CD45RA and CLA expression by live gated CD4+ T cells from blood and skin of healthy donors. (B,C,D) Representative flow cytometry analysis of indicated CLA/CD103 subpopulations of blood and skin CD4+CD45RA cells producing IL-13, IL-4, IL-22, IL-17A, IFN-γ and GM-CSF as indicated upon ex vivo stimulation with PMA/ionomycin and intracellular cytokine staining. (E) Graphical summary of the proportions of CLACD103, CLA+CD103, and CLA+CD103+ CD4+CD45RA cells producing cytokines as indicated. Open symbols represent data from a subject with mammary carcinoma. Significance determined by one-way repeated measures ANOVA with Tukey’s post-test for pairwise comparisons.
Figure 6:
Figure 6:. CD4+CLA+CD103+ T cells in skin and blood are clonally related.
TCRβ-sequencing was performed on sorted CLA+ memory CD4+ T cell subsets (as in Fig. 4) from blood and skin sorted based on expression of CD103 and CCR7 as indicated. (A) (left) Circle plot of unique productive TCRβ sequences from each of the indicated populations of CLA+ T cells from one representative donor (donor 1). Connections highlight sequences from skin CLA+CD103+ cells found in each of the other populations. For visualization, sequences were downsampled (weighted for relative abundance) for populations containing >1000 unique sequences. (right) Graphical summary of the Morisita index as a measure of TCR repertoire similarity over all productive rearrangements between CLA+CD103+ cells in the blood and each of the indicated populations across all 4 donors examined. (B) Circle plot (left) and graphical summary of the Morisita index (right) as in A using CLA+CD103+ T cells from blood as the reference population. Significance determined by one-way ANOVA with Dunnett’s multiple comparisons test.
Figure 7:
Figure 7:. CD4+CLA+CD103+ T cells are present in human lymph.
(A) Representative flow cytometry analysis of CD45RA and CLA expression by live gated CD4+ T cells from blood and TDL. (B) Representative flow cytometry analysis of CCR7 and CD103 expression by live gated CD4+CD45RACLA+ memory T cells from blood and TDL. (C) Graphical summary of the proportions of CCR7- and CD103-defined T cell populations among CD4+CD45RACLA+ cells from blood and TDL. (D) Representative flow cytometry analysis and graphical summary of expression of the indicated markers by CD4+ T cell populations in the blood and TDL as indicated. Significance determined by one-way repeated measures ANOVA with Tukey’s post-test for pairwise comparisons.
Figure 8:
Figure 8:. CD4+CLA+CD103+ TRM can exit the skin and reseed distant skin sites in a xenograft model.
(A) In vitro expanded human keratinocytes and fibroblasts were grafted onto the backs of NSG mice using a grafting chamber. After 99 days of healing and differentiation, the engineered skin (ES) or adjacent murine skin were excised, frozen in OCT and stained either with hematoxylin and eosin (left) or with anti-human type VII collagen prior to immunofluorescence analysis (right). Human skin from a healthy donor was used as control. (B) Experimental schematic for the generation of ES followed by xenografting human skin onto NSG mice. (C) Representative photograph of ES and skin grafts on day 144. (D) Representative flow cytometry analysis and (E) graphical summary of CLA+CD103+ cells by live gated human CD45+CD3+CD4+CD45RA T cells from skin grafts, spleen, and ES (3–5 weeks after skin grafting). Open and filled symbols denote samples derived from 2 different skin donors. Each symbol represents data from one recipient animal. (F) Representative flow cytometry analysis and graphical summary of expression of CD27, CD9 and CD69 by live gated CD45+CD4+CD45RACD103+CLA+ T cells in the skin grafts, spleen, and ES 5 weeks after skin grafting (day 145 relative to ES generation). Significance determined by one-way ANOVA with Tukey’s post-test for pairwise comparisons. (G) Experimental schematic for the generation of ES followed by adoptive transfer of 2.5×10⁶ PBMC (autologous to the ES)/mouse into NSG mice. (H) Representative flow cytometry analysis and (I) graphical summary of CLA+CD103+ cells by live gated human CD45+CD3+CD4+CD45RA T cells from spleen, and ES 25 days after PBMC transfer. Each symbol represents data from one recipient animal. Significance determined by paired t-test.

Comment in

References

    1. Mueller SN, Mackay LK, Tissue-resident memory T cells: local specialists in immune defence, Nat. Rev. Immunol 16, 79–89 (2016). - PubMed
    1. Watanabe R, Gehad A, Yang C, Campbell L, Teague JE, Schlapbach C, Elco C, Huang V, Matos TR, Kupper TS, Clark RA, Human skin is protected by four functionally and phenotypically discrete populations of resident and recirculating memory T cells, Sci Transl Med 7, 279ra39 (2015). - PMC - PubMed
    1. Kumar BV, Ma W, Miron M, Granot T, Guyer RS, Carpenter DJ, Senda T, Sun X, Ho S-H, Lerner H, Friedman AL, Shen Y, Farber DL, Human tissue-resident memory T cells are defined by core transcriptional and functional signatures in lymphoid and mucosal sites, Cell Rep 20, 2921–2934 (2017). - PMC - PubMed
    1. Steinert EM, Schenkel JM, Fraser KA, Beura LK, Manlove LS, Igyártó BZ, Southern PJ, Masopust D, Quantifying Memory CD8 T Cells Reveals Regionalization of Immunosurveillance, Cell 161, 737–749 (2015). - PMC - PubMed
    1. Klonowski KD, Williams KJ, Marzo AL, Blair DA, Lingenheld EG, Lefrançois L, Dynamics of blood-borne CD8 memory T cell migration in vivo, Immunity 20, 551–562 (2004). - PubMed

Publication types