

A Peripheral Blood Gene Expression Signature to Diagnose Subclinical Acute Rejection
- PMID: 31278196
- PMCID: PMC6683710
- DOI: 10.1681/ASN.2018111098
A Peripheral Blood Gene Expression Signature to Diagnose Subclinical Acute Rejection
Abstract
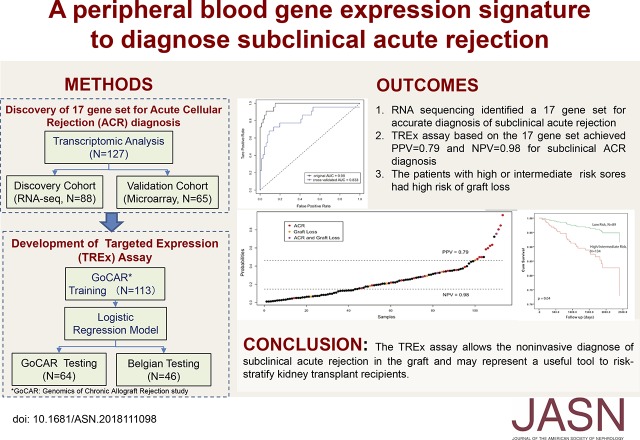
Background: In kidney transplant recipients, surveillance biopsies can reveal, despite stable graft function, histologic features of acute rejection and borderline changes that are associated with undesirable graft outcomes. Noninvasive biomarkers of subclinical acute rejection are needed to avoid the risks and costs associated with repeated biopsies.
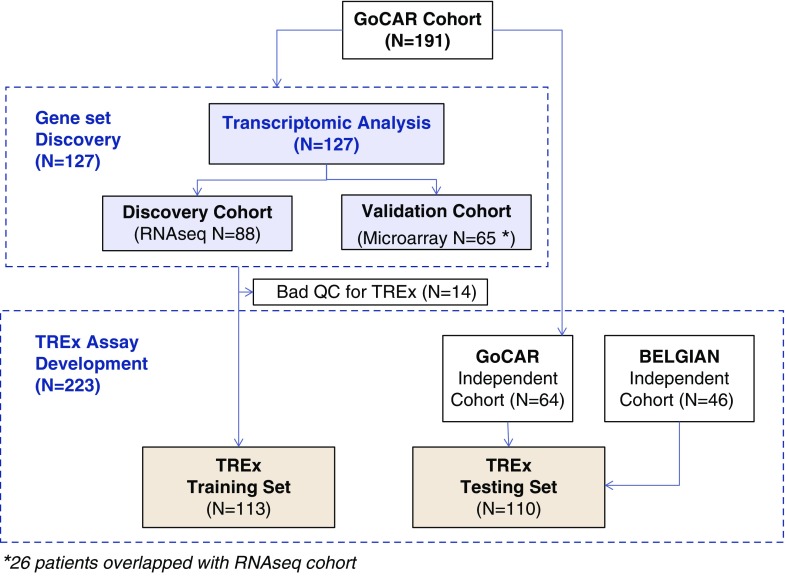
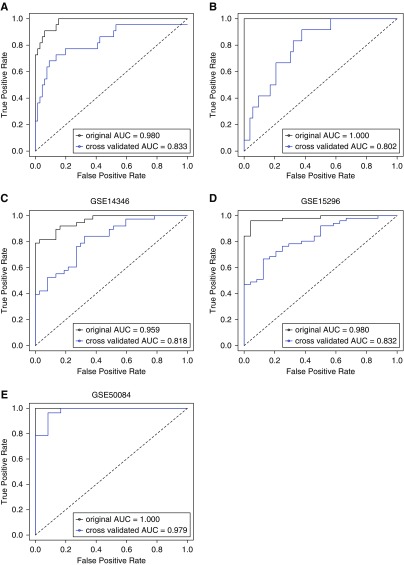
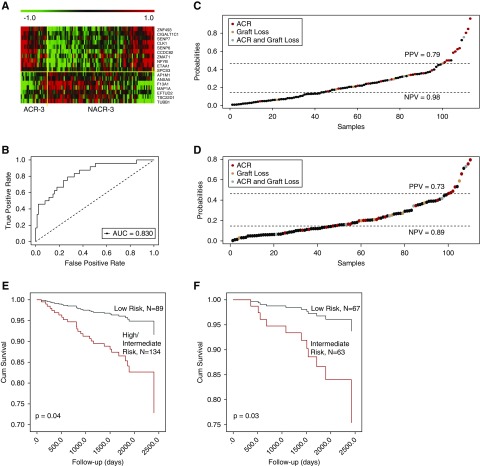
Methods: We examined subclinical histologic and functional changes in kidney transplant recipients from the prospective Genomics of Chronic Allograft Rejection (GoCAR) study who underwent surveillance biopsies over 2 years, identifying those with subclinical or borderline acute cellular rejection (ACR) at 3 months (ACR-3) post-transplant. We performed RNA sequencing on whole blood collected from 88 individuals at the time of 3-month surveillance biopsy to identify transcripts associated with ACR-3, developed a novel sequencing-based targeted expression assay, and validated this gene signature in an independent cohort.
Results: Study participants with ACR-3 had significantly higher risk than those without ACR-3 of subsequent clinical acute rejection at 12 and 24 months, faster decline in graft function, and decreased graft survival in adjusted Cox analysis. We identified a 17-gene signature in peripheral blood that accurately diagnosed ACR-3, and validated it using microarray expression profiles of blood samples from 65 transplant recipients in the GoCAR cohort and three public microarray datasets. In an independent cohort of 110 transplant recipients, tests of the targeted expression assay on the basis of the 17-gene set showed that it identified individuals at higher risk of ongoing acute rejection and future graft loss.
Conclusions: Our targeted expression assay enabled noninvasive diagnosis of subclinical acute rejection and inflammation in the graft and may represent a useful tool to risk-stratify kidney transplant recipients.
Keywords: acute rejection; gene expression; renal transplantation; whole blood.
Copyright © 2019 by the American Society of Nephrology.
Figures
Similar articles
-
Orthogonal Comparison of Molecular Signatures of Kidney Transplants With Subclinical and Clinical Acute Rejection: Equivalent Performance Is Agnostic to Both Technology and Platform.Am J Transplant. 2017 Aug;17(8):2103-2116. doi: 10.1111/ajt.14224. Epub 2017 Apr 3. Am J Transplant. 2017. PMID: 28188669 Free PMC article.
-
Posttransplant peripheral blood donor-specific interferon-γ enzyme-linked immune spot assay differentiates risk of subclinical rejection and de novo donor-specific alloantibodies in kidney transplant recipients.Kidney Int. 2017 Jul;92(1):201-213. doi: 10.1016/j.kint.2016.12.024. Epub 2017 Mar 6. Kidney Int. 2017. PMID: 28274484 Free PMC article.
-
Pretransplant transcriptomic signature in peripheral blood predicts early acute rejection.JCI Insight. 2019 Jun 6;4(11):e127543. doi: 10.1172/jci.insight.127543. eCollection 2019 Jun 6. JCI Insight. 2019. PMID: 31167967 Free PMC article.
-
Urinary Cell mRNA Profiles Predictive of Human Kidney Allograft Status.Clin J Am Soc Nephrol. 2021 Oct;16(10):1565-1577. doi: 10.2215/CJN.14010820. Epub 2021 Apr 27. Clin J Am Soc Nephrol. 2021. PMID: 33906907 Free PMC article. Review.
-
Blood Gene Signature as a Biomarker for Subclinical Kidney Allograft Rejection: Where Are We?Transplantation. 2025 Feb 1;109(2):249-258. doi: 10.1097/TP.0000000000005105. Epub 2024 Jun 13. Transplantation. 2025. PMID: 38867352 Review.
Cited by
-
Mycophenolate mofetil versus azathioprine in kidney transplant recipients on steroid-free, low-dose cyclosporine immunosuppression (ATHENA): A pragmatic randomized trial.PLoS Med. 2021 Jun 24;18(6):e1003668. doi: 10.1371/journal.pmed.1003668. eCollection 2021 Jun. PLoS Med. 2021. PMID: 34166370 Free PMC article. Clinical Trial.
-
Activity-based protein profiling guided identification of urine proteinase 3 activity in subclinical rejection after renal transplantation.Clin Proteomics. 2020 Jun 16;17:23. doi: 10.1186/s12014-020-09284-9. eCollection 2020. Clin Proteomics. 2020. PMID: 32549867 Free PMC article.
-
A Three-Gene Peripheral Blood Potential Diagnosis Signature for Acute Rejection in Renal Transplantation.Front Mol Biosci. 2021 May 4;8:661661. doi: 10.3389/fmolb.2021.661661. eCollection 2021. Front Mol Biosci. 2021. PMID: 34017855 Free PMC article.
-
Integrated analysis of cell-specific gene expression in peripheral blood using ISG15 as a marker of rejection in kidney transplantation.Front Immunol. 2023 Mar 8;14:1153940. doi: 10.3389/fimmu.2023.1153940. eCollection 2023. Front Immunol. 2023. PMID: 36969159 Free PMC article.
-
Role of novel biomarkers in kidney transplantation.World J Transplant. 2020 Sep 18;10(9):230-255. doi: 10.5500/wjt.v10.i9.230. World J Transplant. 2020. PMID: 32995319 Free PMC article. Review.
References
-
- Hariharan S, Johnson CP, Bresnahan BA, Taranto SE, McIntosh MJ, Stablein D: Improved graft survival after renal transplantation in the United States, 1988 to 1996. N Engl J Med 342: 605–612, 2000 - PubMed
-
- Pirsch JD, Ploeg RJ, Gange S, D’Alessandro AM, Knechtle SJ, Sollinger HW, et al. .: Determinants of graft survival after renal transplantation. Transplantation 61: 1581–1586, 1996 - PubMed
-
- Shishido S, Asanuma H, Nakai H, Mori Y, Satoh H, Kamimaki I, et al. .: The impact of repeated subclinical acute rejection on the progression of chronic allograft nephropathy. J Am Soc Nephrol 14: 1046–1052, 2003 - PubMed
Publication types
MeSH terms
Substances
Grants and funding
LinkOut - more resources
Full Text Sources
Medical
Molecular Biology Databases
