

Early-Onset Sepsis Risk Calculator Integration Into an Electronic Health Record in the Nursery
- PMID: 31278210
- PMCID: PMC10483882
- DOI: 10.1542/peds.2018-3464
Early-Onset Sepsis Risk Calculator Integration Into an Electronic Health Record in the Nursery
Abstract
Background and objectives: An early-onset sepsis (EOS) risk calculator tool to guide evaluation and treatment of infants at risk for sepsis has reduced antibiotic use without increased adverse outcomes. We performed an electronic health record (EHR)-driven quality improvement intervention to increase calculator use for infants admitted to a newborn nursery and reduce antibiotic treatment of infants at low risk for sepsis.
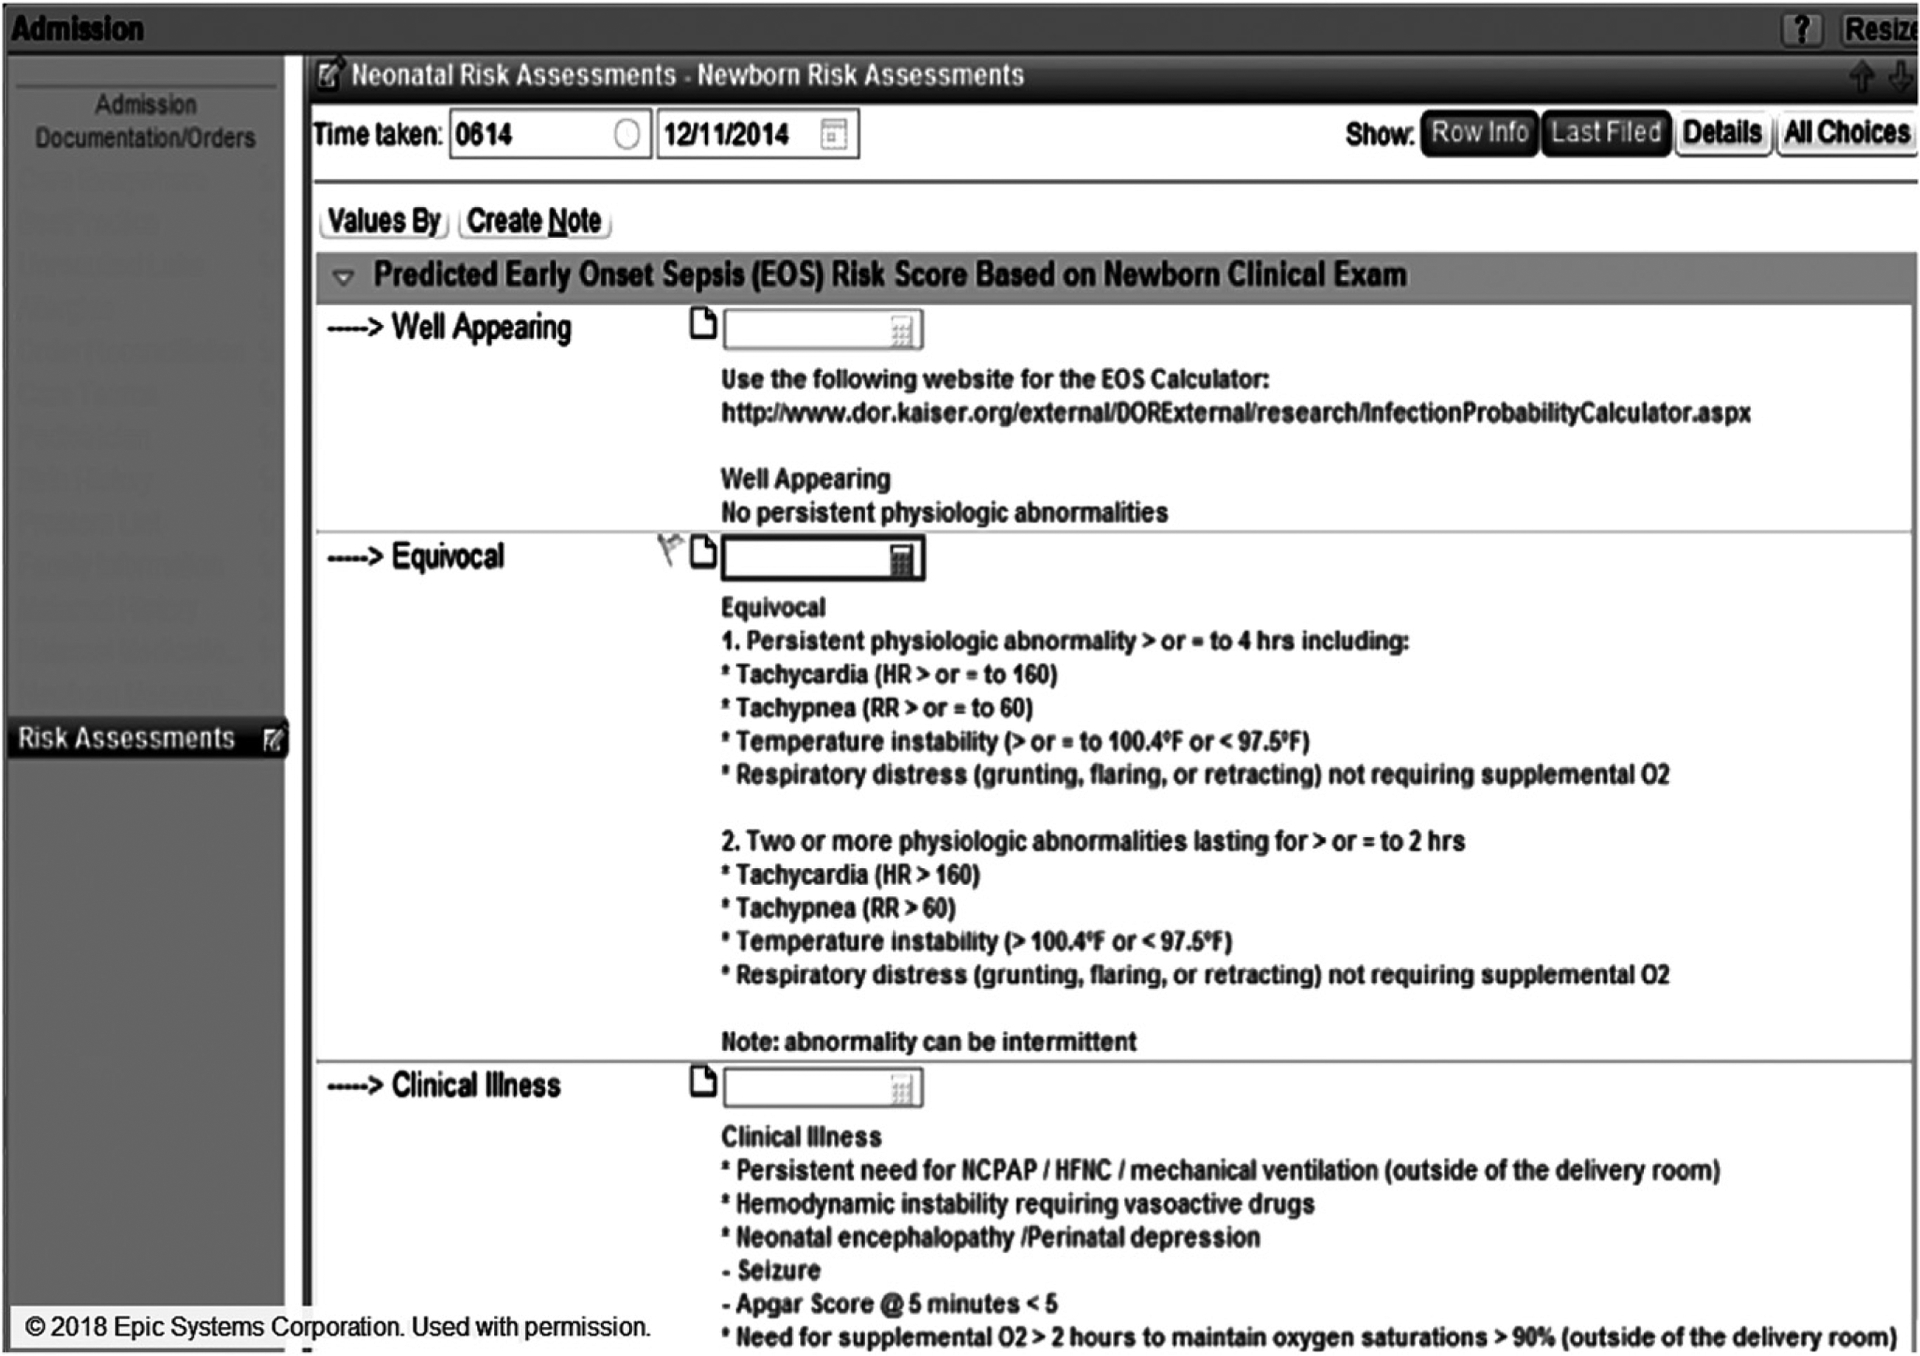
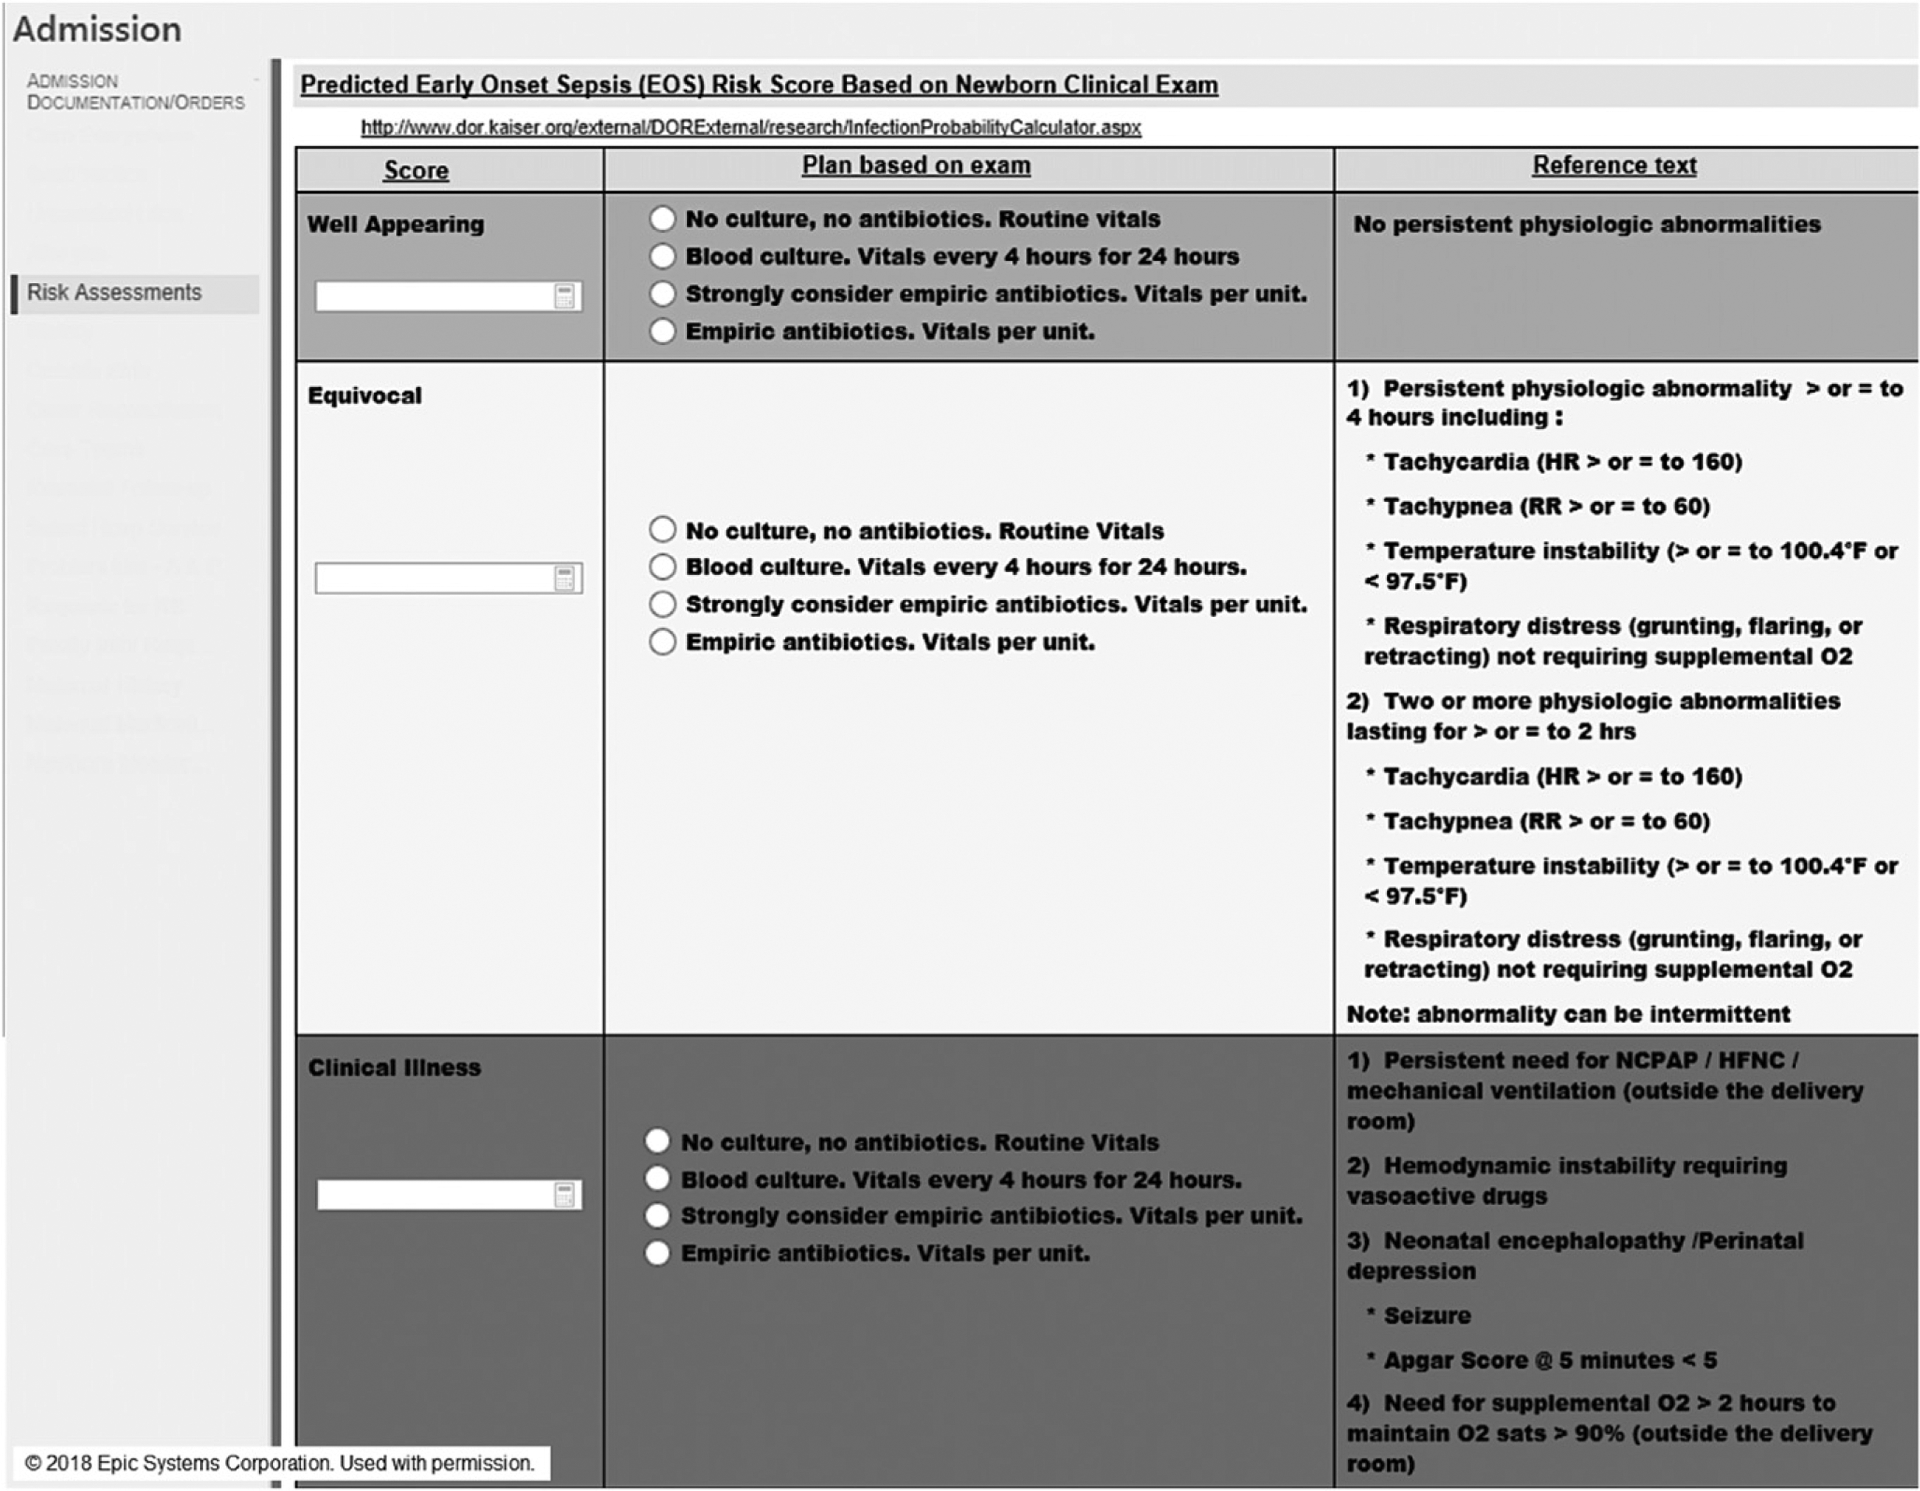
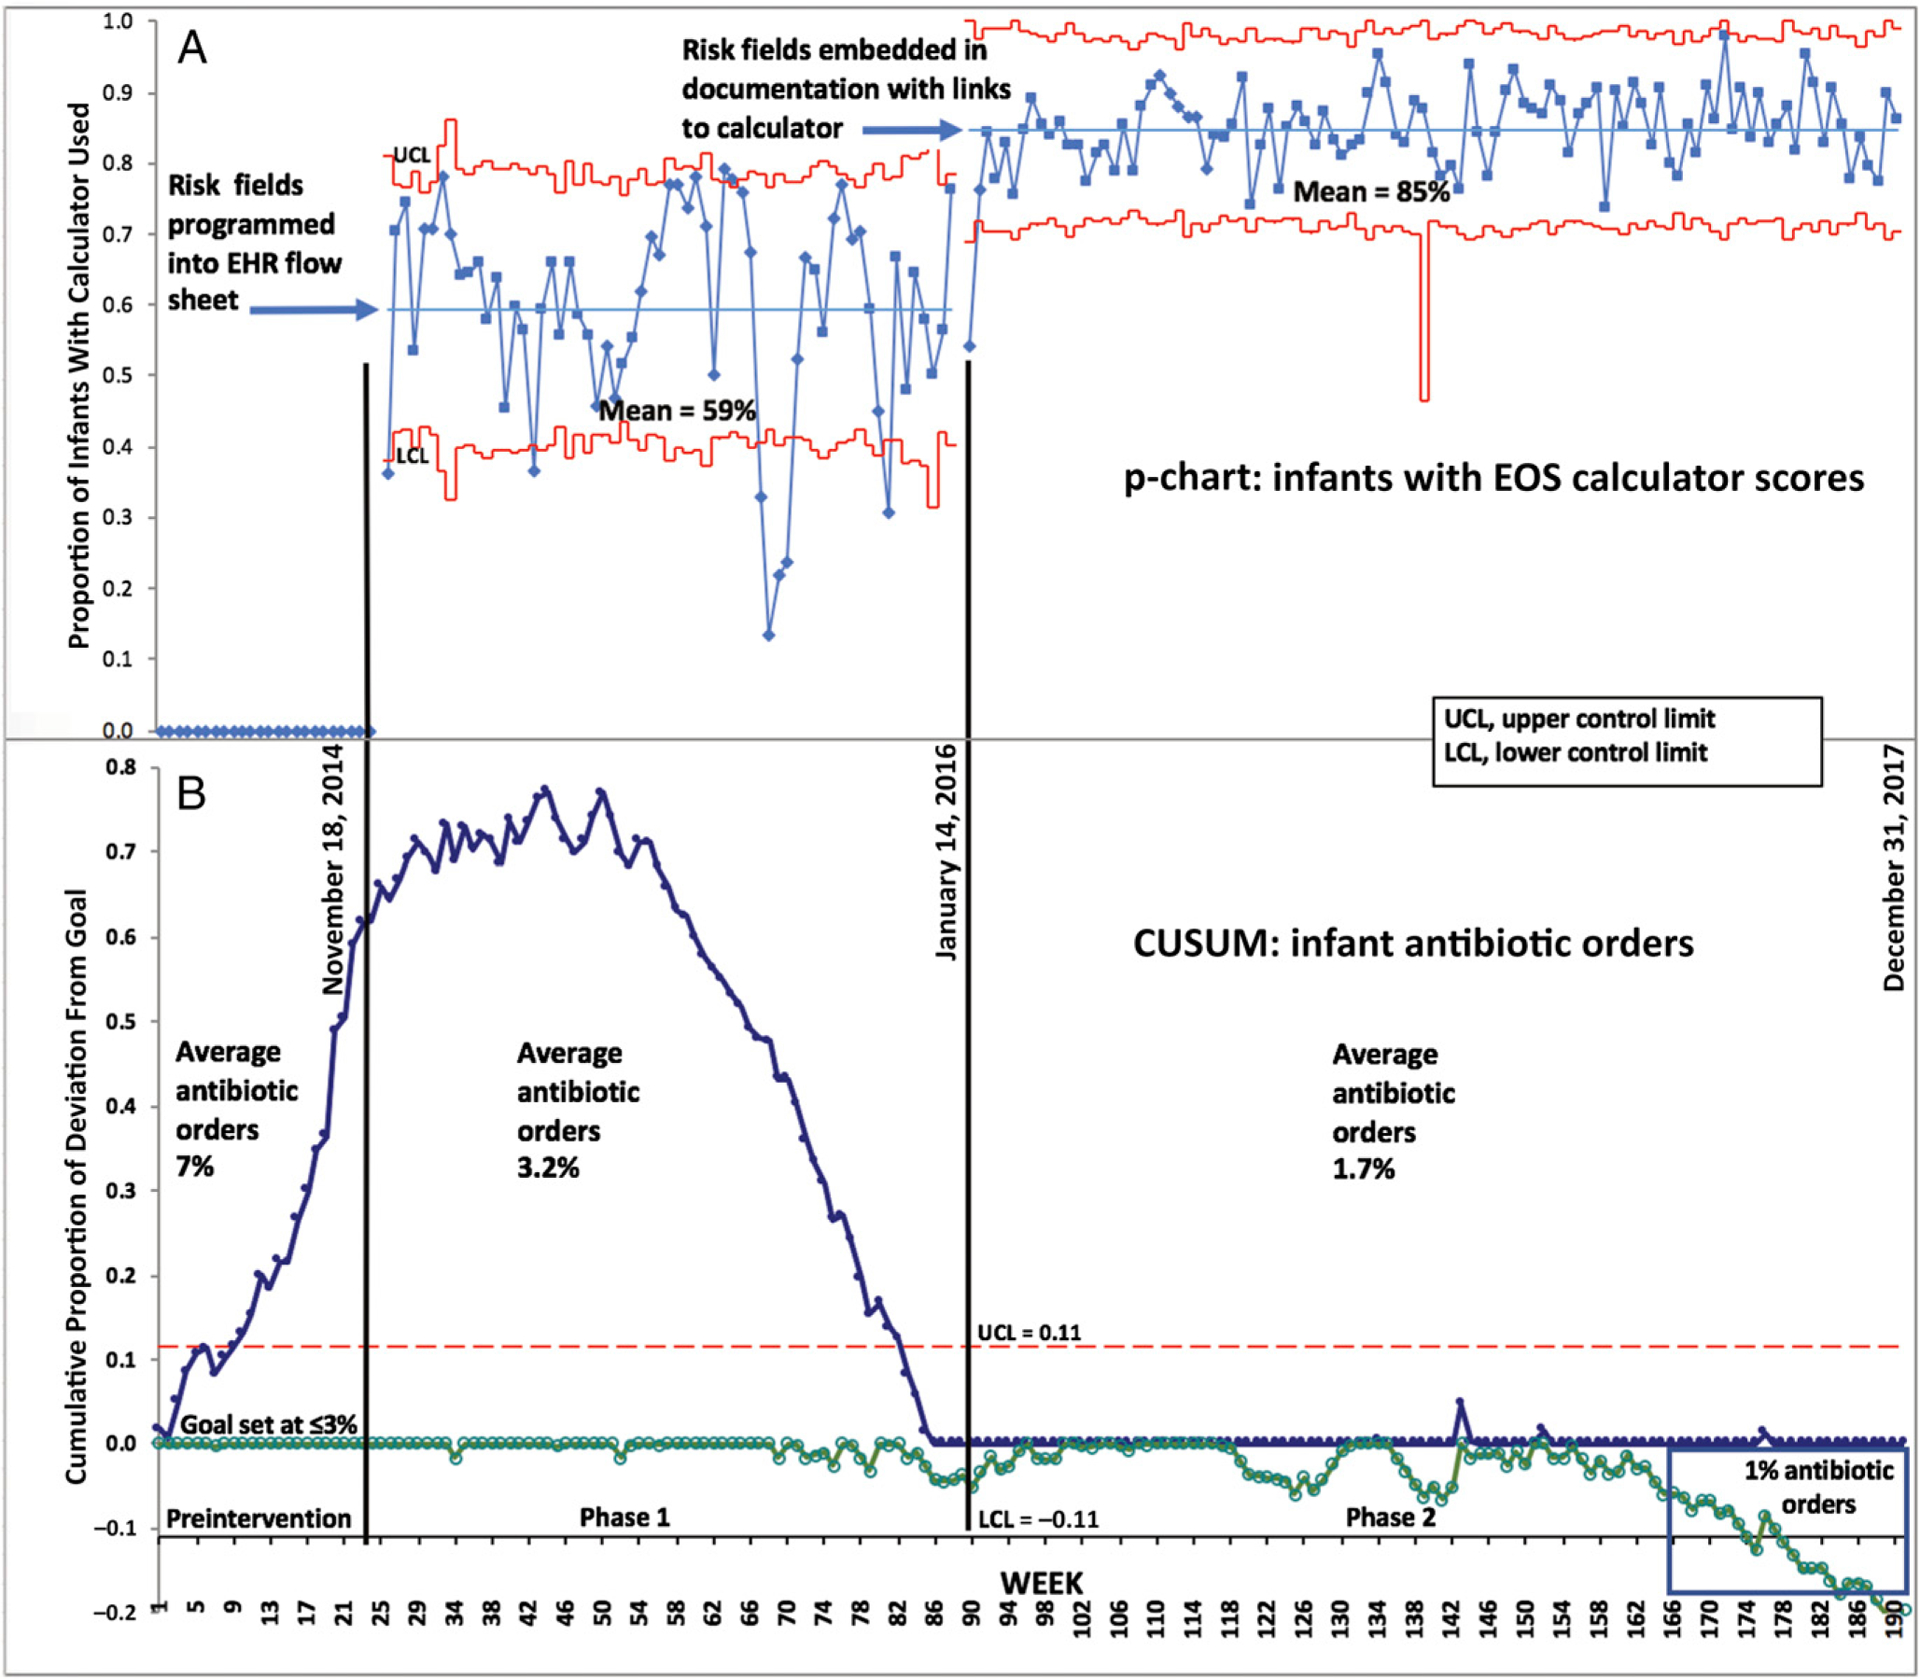
Methods: This 2-phase intervention included programming (1) an EHR form containing calculator fields that were external to the infant's admission note, with nonautomatic access to the calculator, education for end-users, and reviewing risk scores in structured bedside rounds and (2) discrete data entry elements into the EHR admission form with a hyperlink to the calculator Web site. We used statistical process control to assess weekly entry of risk scores and antibiotic orders and interrupted time series to assess trend of antibiotic orders.
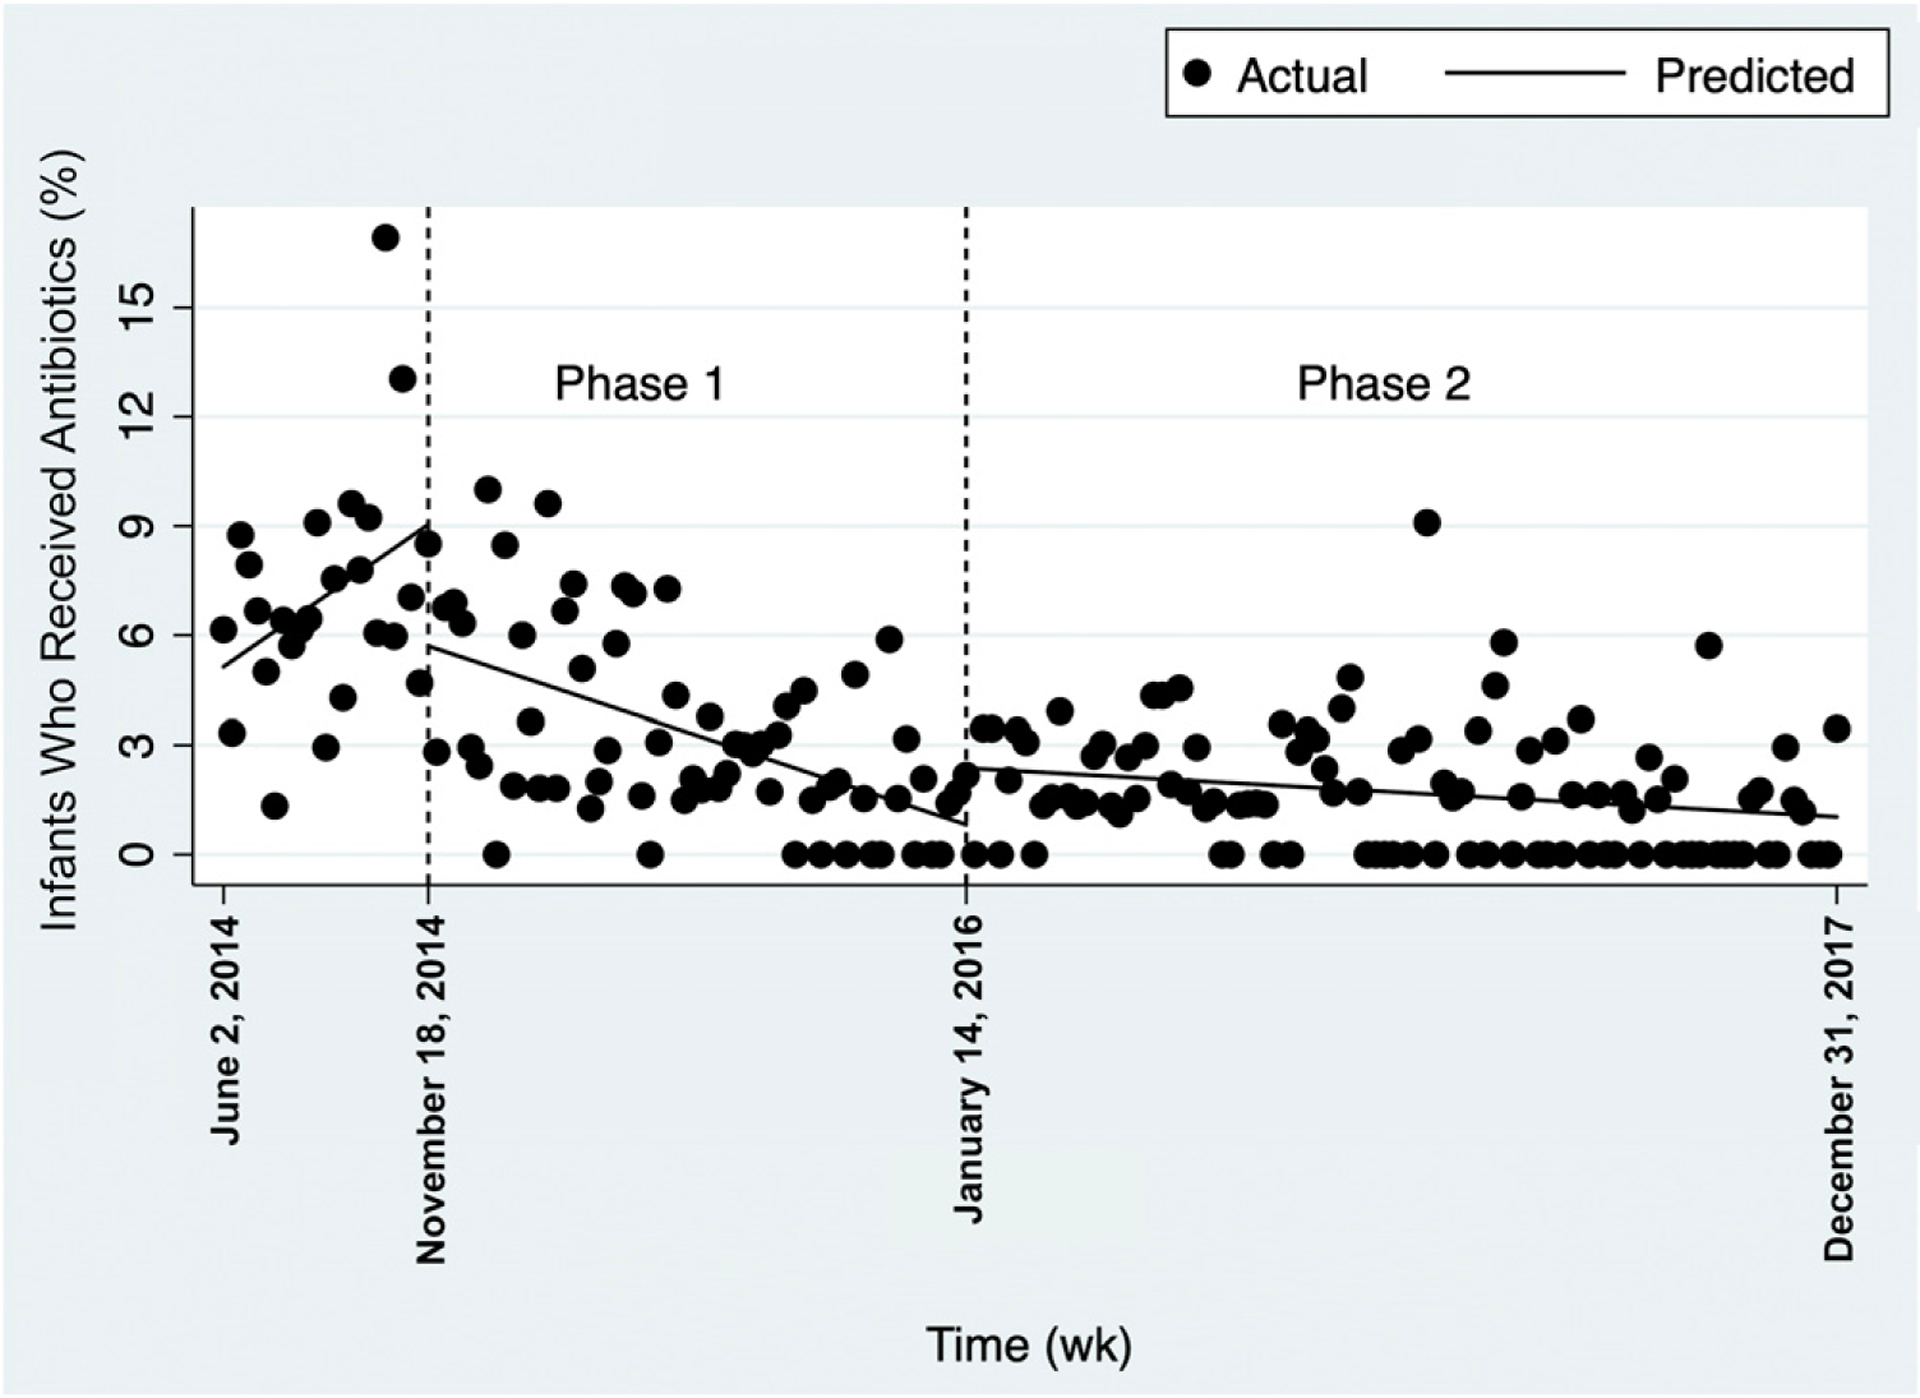
Results: During phase 1 (duration, 14 months), a mean 59% of infants had EOS calculator scores entered. There was wide variability around the mean, with frequent crossing of weekly means beyond the 3σ control lines, indicating special-cause variation. During phase 2 (duration, 2 years), mean frequency of EOS calculator use increased to 85% of infants, and variability around the mean was within the 3σ control lines. The frequency of antibiotic orders decreased from preintervention (7%) to the final 6 months of phase 2 (1%, P < .001).
Conclusions: An EHR-driven quality improvement intervention increased EOS calculator use and reduced antibiotic orders, with no increase in adverse events.
Copyright © 2019 by the American Academy of Pediatrics.
Conflict of interest statement
POTENTIAL CONFLICT OF INTEREST: Dr Kawamoto reports honoraria, consulting, or sponsored research with McKesson InterQual, Hitachi, Premier, Klesis Healthcare, Vanderbilt University, the University of Washington, the University of California at San Francisco, and the US Office of the National Coordinator for Health Information Technology (via Enterprise Science and Computing, JBS International, A+ Government Solutions, Hausam Consulting, and Security Risk Solutions) in the area of health information technology; the other authors have indicated they have no potential conflicts of interest to disclose.
Figures
Similar articles
-
Introduction of the neonatal sepsis calculator at a low-dependency special care nursery in Australia.J Matern Fetal Neonatal Med. 2022 Dec;35(25):7532-7535. doi: 10.1080/14767058.2021.1951215. Epub 2021 Aug 6. J Matern Fetal Neonatal Med. 2022. PMID: 34353212
-
Implementation of the Neonatal Sepsis Calculator in Early-Onset Sepsis and Maternal Chorioamnionitis.Adv Neonatal Care. 2020 Feb;20(1):25-32. doi: 10.1097/ANC.0000000000000668. Adv Neonatal Care. 2020. PMID: 31569094
-
The impact of the early onset neonatal sepsis calculator on antibiotic initiation: a single center study in Israel.Eur J Pediatr. 2023 Jul;182(7):3187-3194. doi: 10.1007/s00431-023-04993-3. Epub 2023 Apr 29. Eur J Pediatr. 2023. PMID: 37119298
-
Sepsis calculator for neonatal early onset sepsis - a systematic review and meta-analysis.J Matern Fetal Neonatal Med. 2021 Jun;34(11):1832-1840. doi: 10.1080/14767058.2019.1649650. Epub 2019 Aug 11. J Matern Fetal Neonatal Med. 2021. PMID: 31352846
-
Evaluating Newborns at Risk for Early-Onset Sepsis.Pediatr Clin North Am. 2019 Apr;66(2):321-331. doi: 10.1016/j.pcl.2018.12.003. Epub 2019 Feb 1. Pediatr Clin North Am. 2019. PMID: 30819339 Review.
Cited by
-
Special Commentary: Using Clinical Decision Support Systems to Bring Predictive Models to the Glaucoma Clinic.Ophthalmol Glaucoma. 2021 Jan-Feb;4(1):5-9. doi: 10.1016/j.ogla.2020.08.006. Epub 2020 Aug 15. Ophthalmol Glaucoma. 2021. PMID: 32810611 Free PMC article.
-
Barriers and Facilitators to the Implementation of the Early-Onset Sepsis Calculator: A Multicenter Survey Study.Children (Basel). 2023 Oct 12;10(10):1682. doi: 10.3390/children10101682. Children (Basel). 2023. PMID: 37892345 Free PMC article.
-
[Advances in clinical management of neonatal sepsis].Zhongguo Dang Dai Er Ke Za Zhi. 2024 May 15;26(5):518-522. doi: 10.7499/j.issn.1008-8830.2309145. Zhongguo Dang Dai Er Ke Za Zhi. 2024. PMID: 38802914 Free PMC article. Review. Chinese.
-
Computerized Clinical Decision Support Systems for the Early Detection of Sepsis Among Pediatric, Neonatal, and Maternal Inpatients: Scoping Review.JMIR Med Inform. 2022 May 6;10(5):e35061. doi: 10.2196/35061. JMIR Med Inform. 2022. PMID: 35522467 Free PMC article.
-
The impact of recency and adequacy of historical information on sepsis predictions using machine learning.Sci Rep. 2021 Oct 21;11(1):20869. doi: 10.1038/s41598-021-00220-x. Sci Rep. 2021. PMID: 34675275 Free PMC article.
References
-
- Bourgeois FT, Mandl KD, Valim C, Shannon MW. Pediatric adverse drug events in the outpatient setting: an 11-year national analysis. Pediatrics. 2009; 124(4). Available at: www.pediatrics.org/cgi/content/full/124/4/e744 - PMC - PubMed
-
- Marston HD, Dixon DM, Knisely JM, Palmore TN, Fauci AS. Antimicrobial resistance. JAMA. 2016;316(11): 1193–1204 - PubMed
MeSH terms
Substances
Grants and funding
LinkOut - more resources
Full Text Sources
Medical
