. 2019 Jul 5;10(1):2987.
doi: 10.1038/s41467-019-10839-0.

Metformin induces lipogenic differentiation in myofibroblasts to reverse lung fibrosis

Affiliations

Metformin induces lipogenic differentiation in myofibroblasts to reverse lung fibrosis

Vahid Kheirollahi et al. Nat Commun. .

Abstract

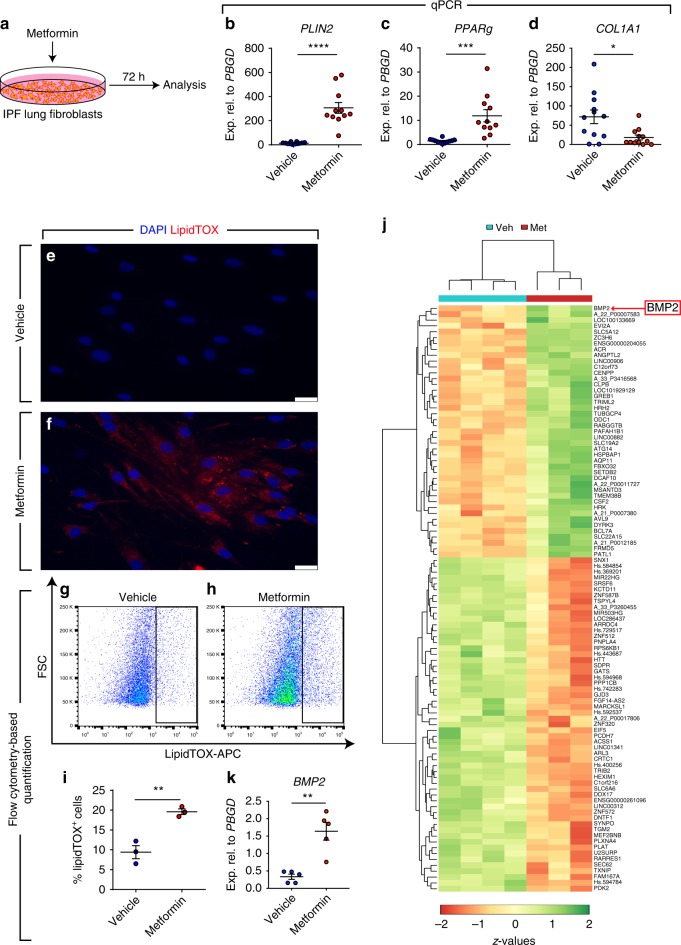
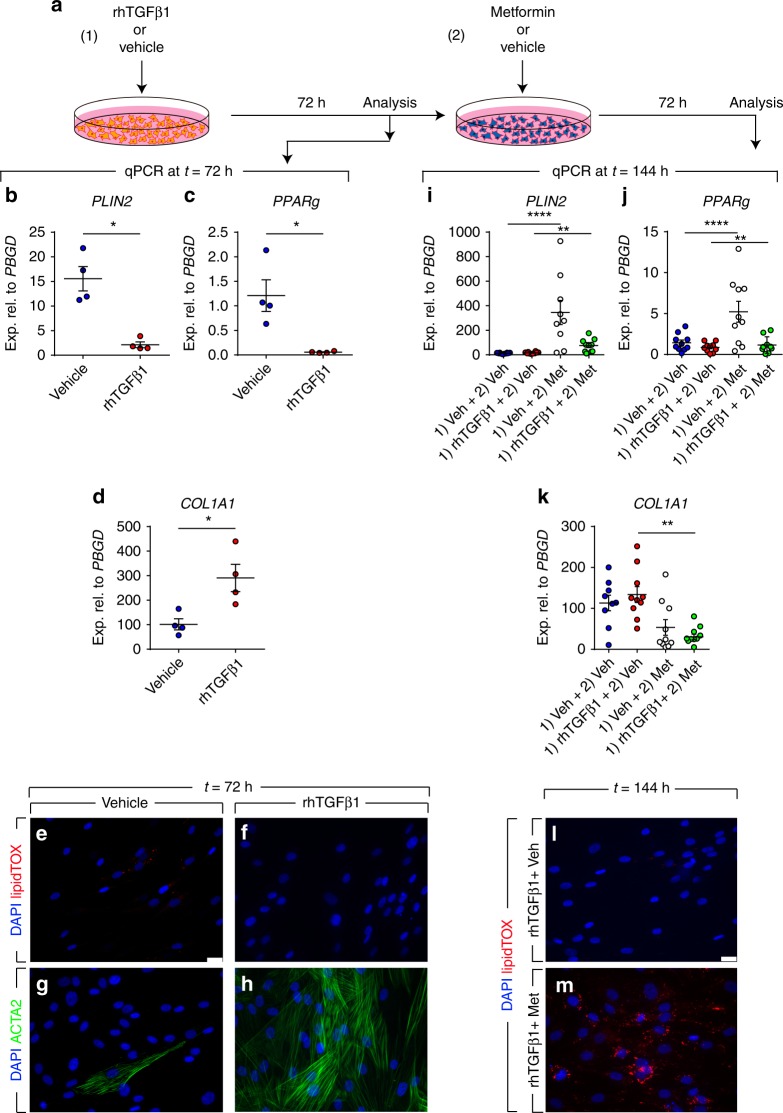
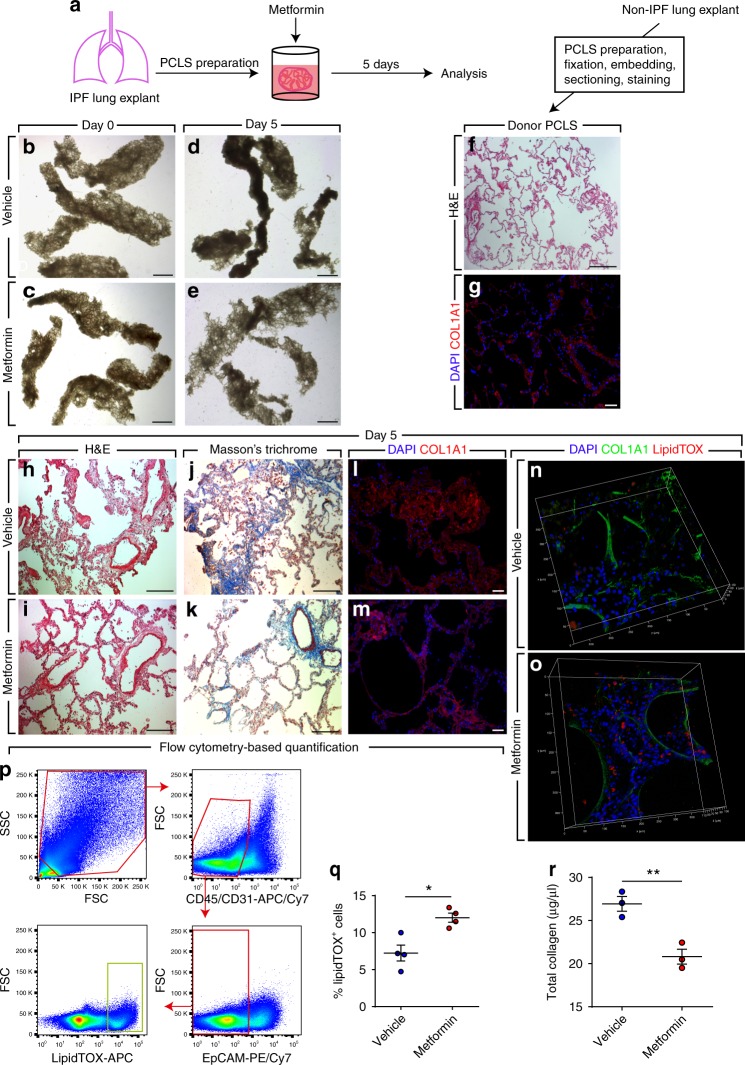
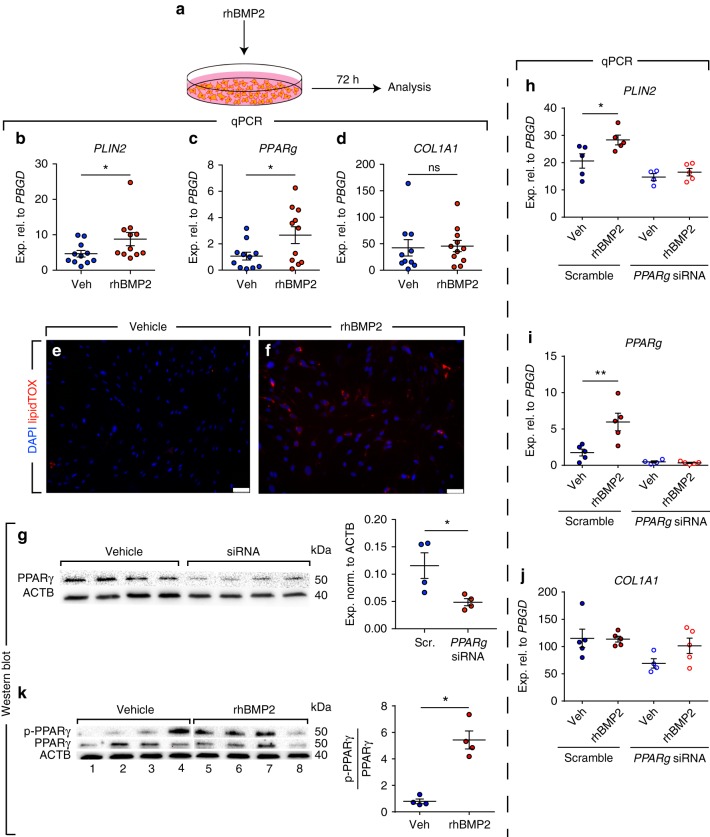
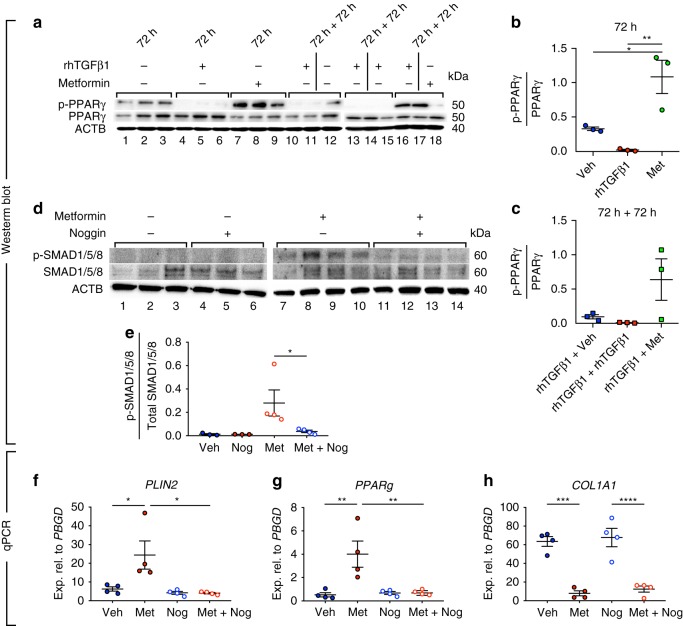
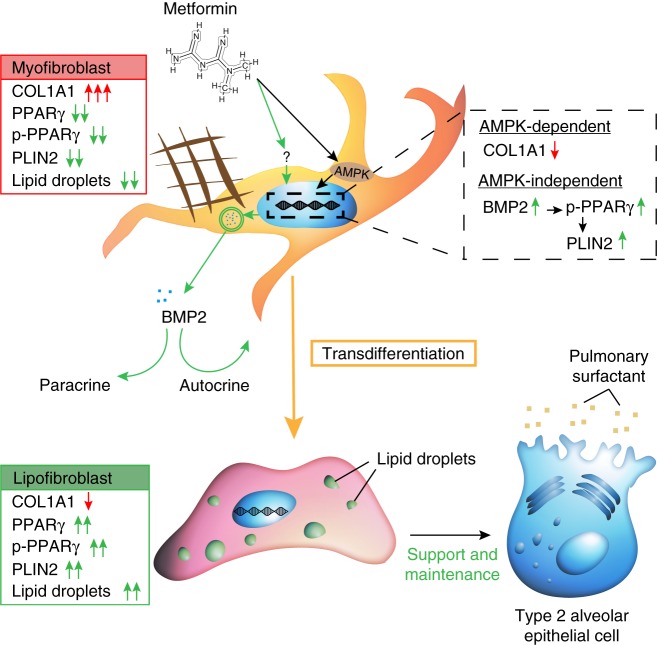
Idiopathic pulmonary fibrosis (IPF) is a fatal disease in which the intricate alveolar network of the lung is progressively replaced by fibrotic scars. Myofibroblasts are the effector cells that excessively deposit extracellular matrix proteins thus compromising lung structure and function. Emerging literature suggests a correlation between fibrosis and metabolic alterations in IPF. In this study, we show that the first-line antidiabetic drug metformin exerts potent antifibrotic effects in the lung by modulating metabolic pathways, inhibiting TGFβ1 action, suppressing collagen formation, activating PPARγ signaling and inducing lipogenic differentiation in lung fibroblasts derived from IPF patients. Using genetic lineage tracing in a murine model of lung fibrosis, we show that metformin alters the fate of myofibroblasts and accelerates fibrosis resolution by inducing myofibroblast-to-lipofibroblast transdifferentiation. Detailed pathway analysis revealed a two-arm mechanism by which metformin accelerates fibrosis resolution. Our data report an antifibrotic role for metformin in the lung, thus warranting further therapeutic evaluation.


Conflict of interest statement

The authors declare no competing interests.

Figures

Fig. 1
Fig. 1
Metformin induces lipogenic marker expression in human IPF lung fibroblasts. a Schematic representation of the experimental setup. bd qPCR analysis for the lipogenic marker genes PLIN2 and PPARg, as well as the myofibroblast marker COL1A1 in human IPF lung fibroblasts treated with metformin or vehicle. e, f Staining of lipid droplets in fibroblasts using LipidTOX (red). Nuclei were counterstained with DAPI (blue). gh Gating strategy for detecting LipidTOX+ cells by flow cytometry. i Quantification of LipidTOX+ cell abundance in response to metformin treatment. j Heatmap representation of the top 100 differentially expressed genes in fibroblasts following metformin treatment. k qPCR analysis for BMP2 in metformin- and vehicle-treated cells. Scale bars: e, f 25 µm. Each data point within a given group corresponds to one patient and error bars indicate s.e.m. bd Vehicle-treated group: n = 12, Metformin-treated group: n = 11. i n = 3 per group. k n = 5 per group. Student’s t-test was used in (bd) and Mann–Whitney test was used in (i, k). *P < 0.05, **P < 0.01, ***P < 0.001, ****P < 0.0001
Fig. 2
Fig. 2
Metformin attenuates TGFβ1-mediated fibrogenesis in vitro. a Schematic representation of the experimental setup. bd qPCR analysis for PLIN2, PPARg, and COL1A1 in human lung fibroblasts treated with TGFβ1 or vehicle for 72 h. eh Staining of TGFβ1- and vehicle-treated cells with LipidTOX (red), anti-ACTA2 antibodies (green), and DAPI (blue). ik qPCR analysis for PLIN2, PPARg, and COL1A1 in human lung fibroblasts treated with TGFβ1 or vehicle for 72 h, followed by treatment with metformin or vehicle for 72 h. l, m Staining of TGFβ1- and vehicle-treated cells with LipidTOX (red) and DAPI (blue) at the end of treatment (t = 144 h). Scale bars: (e–h) and (l, m) 25 µm. Each data point within a given group corresponds to one patient and error bars indicate s.e.m. bd n  =  4 per group. ik n = 9–10 per group. Mann–Whitney test was used in (bd), one-way ANOVA was used in (i, j) and Kruskal–Wallis test was used in (k). *P < 0.05, **P < 0.01, ****P < 0.0001. Met: metformin, Veh: vehicle
Fig. 3
Fig. 3
Metformin improves IPF lung structure ex vivo. a Schematic representation of the experimental setup. be Bright-field imaging of PCLS treated with metformin or vehicle for 5 days. f, g Hematoxylin and eosin staining and COL1A1 immunostaining of PCLS prepared from a non-IPF donor lung. hm Hematoxylin and eosin staining, Masson’s trichrome staining and COL1A1 immunostaining of PCLS prepared from an IPF lung and treated with metformin or vehicle for 5 days. n, o 3D reconstruction of z-stacks of metformin- and vehicle-treated PCLS stained for COL1A1 (green) and lipid droplets (red). p Gating strategy for flow cytometry-based quantification of LipidTOX+ cells that are negative for hematopoietic (CD45), endothelial (CD31), and epithelial (EpCAM) cell markers. q Quantification of flow cytometry measurements on metformin- and vehicle-treated cells. r Total collagen assay for metformin- and vehicle-treated cells. Scale bars: be 2 mm, f 500 μm, g, l, m 50 μm, and hk 200 µm. Each data point within a given group corresponds to one patient and error bars indicate s.e.m. q n = 4 per group. r n = 3 per group. Mann–Whitney test was used in (q, r). * P < 0.05, **P < 0.01
Fig. 4
Fig. 4
Metformin accelerates fibrosis resolution in the bleomycin model in mice. a Schematic representation of the Acta2-Cre-ERT2 and tdTomatoflox constructs. b Schematic representation of the timeline of the experiment. Bleomycin was administered intratracheally at day 0. Between days 5 and 14, mice were fed tamoxifen-containing pellets and starting at day 14, metformin (1.5 mg/mL) or vehicle was administered through drinking water. Mice were sacrificed at day 28. cf Hematoxylin and eosin and Masson’s trichrome staining of metformin- and vehicle-treated lungs. g Quantification of fibrosis in metformin- and vehicle-treated lungs. h, i Immunofluorescence for COL1A1 (green). Endogenous tdTomato signal (red) and DAPI (blue) are also shown. j LipidTOX staining (green) and tdTomato+ cells (red) are shown. The box in (j) is magnified in (k). Arrowheads indicate LipidTOX+ tdTomato+ cells. ls Gating strategy (to detect CD45 CD31 EpCAM tdTomato+ and/or LipidTOX+ cells) and quantification of various cell populations based on tdTomato and LipidTOX detection. Scale bars: cf 1 mm, h, i 50 μm, and j 25 µm. Each data point within a given group corresponds to one animal and error bars indicate s.e.m. n = 5 per group. Mann–Whitney test was used in (g, qs). *P < 0.05, **P < 0.01. IF: immunofluorescence, ns: not significant
Fig. 5
Fig. 5
Mode of action of metformin is partially independent of AMPK signaling. a Schematic representation of the gain-of-function experimental setup for AMPK signaling. be qPCR analysis of PLIN2, PPARg, COL1A1, and BMP2 in human IPF lung fibroblasts treated with the AMPK agonist GSK621 or vehicle. f Schematic representation of the loss-of-function experimental setup for AMPK signaling. The decrease of AMPK protein levels at the time of analysis is shown in (g). hj qPCR analysis of PLIN2, PPARg, and COL1A1 in IPF fibroblasts treated with AMPK siRNA or scramble siRNA. km Staining of GSK621- and vehicle-treated cells with LipidTOX (red) and DAPI (blue). Metformin-treated cells were used as a positive control for lipid-droplet accumulation (l). Scale bars: km 25 µm. Each data point corresponds to one patient and error bars indicate s.e.m. be Vehicle-treated group: n = 8, GSK621-treated group: n = 8. g n = 3 per group. hj n = 4 per group. Mann–Whitney test was used in (be, g) and Kruskal–Wallis test was used in (hj). *P < 0.05. ns: not significant
Fig. 6
Fig. 6
rhBMP2 induces PPARγ phosphorylation and lipogenic differentiation in human IPF lung fibroblasts. a Schematic representation of the experimental setup. bd qPCR analysis of PLIN2, PPARg and COL1A1 in IPF fibroblasts treated with rhBMP2 or vehicle. e, f Staining of rhBMP2- and vehicle-treated cells with LipidTOX (red) and DAPI (blue). g Western blot validating the knockdown of PPARγ protein levels 72 h after siRNA treatment. Quantification of the immunoblot is shown in the right panel. hj qPCR analysis of PLIN2, PPARg, and COL1A1 in IPF fibroblasts transfected with siRNA against PPARg (for 72 h) and then treated with vehicle or rhBMP2 for 72 h. k Western blot showing the induction of PPARγ phosphorylation in response to rhBMP2 treatment. Lanes 1–4 and lanes 5–8 were run in parallel on different gels under the same conditions. Quantification of the immunoblot is shown in the right panel. Scale bars: ef 50 µm. Each data point corresponds to one patient and error bars indicate s.e.m. bd n = 11 per group except for COL1A1 vehicle-treated group (n = 10). g, k n = 4 per group. hj Scramble/vehicle-, scramble/rhBMP2- and siRNA/rhBMP2-treated groups: n = 5 per group, siRNA/vehicle-treated group: n = 4. Mann–Whitney test was used in (b, d, g, k) and Student’s t-test was used in (c). Kruskal–Wallis test was used in (hj). *P < 0.05, **P < 0.01. ns: not significant
Fig. 7
Fig. 7
Metformin-mediated lipogenic differentiation in human IPF lung fibroblasts is mediated by BMP2 signaling. ac Western blot showing the opposing effects of metformin and rhTGFβ1 on PPARγ phosphorylation and the ability of metformin to partially restore PPARγ phosphorylation in rhTGFβ1-treated IPF fibroblasts. Lanes 1–12 and lanes 13–18 were run in parallel on different gels under the same conditions. d Western blot showing the phosphorylation status of SMAD1/5/8 in the presence of metformin and/or the BMP signaling inhibitor noggin. Quantification of the immunoblot is shown in (e). fh qPCR analysis of PLIN2, PPARg, and COL1A1 in IPF fibroblasts treated with vehicle, metformin, noggin and noggin + metformin. Each data point corresponds to one patient and error bars indicate s.e.m. ac n = 3 per group. d Vehicle- and noggin-treated groups: n = 3 per group, metformin- and metformin/noggin-treated groups: n = 4. fh n = 4 per group. Kruskal–Wallis test was used in (b, c, eh). *P < 0.05, **P < 0.01, ***P < 0.001, ****P < 0.0001
Fig. 8
Fig. 8
Model for the antifibrotic mechanism of action of metformin in human lung fibrosis. Metformin activates AMPK signaling in myofibroblasts, leading to suppression of collagen production, and induces lipogenic differentiation via an AMPK-independent mechanism involving BMP2 release and PPARγ phosphorylation. Arising lipofibroblasts are known to support type 2 alveolar epithelial stem cells in the lung

References

    1. Sgalla G, Biffi A, Richeldi L. Idiopathic pulmonary fibrosis: diagnosis, epidemiology and natural history. Respirology. 2016;21:427–437. doi: 10.1111/resp.12683. - DOI - PubMed
    1. Todd NW, Luzina IG, Atamas SP. Molecular and cellular mechanisms of pulmonary fibrosis. Fibrogenes. Tissue Repair. 2012;5:11. doi: 10.1186/1755-1536-5-11. - DOI - PMC - PubMed
    1. Günther A, et al. Unravelling the progressive pathophysiology of idiopathic pulmonary fibrosis. Eur. Respir. Rev. 2012;21:152–160. doi: 10.1183/09059180.00001012. - DOI - PMC - PubMed
    1. El Agha E, et al. Mesenchymal stem cells in fibrotic disease. Cell Stem Cell. 2017;21:166–177. doi: 10.1016/j.stem.2017.07.011. - DOI - PubMed
    1. Rock JR, et al. Multiple stromal populations contribute to pulmonary fibrosis without evidence for epithelial to mesenchymal transition. Proc. Natl Acad. Sci. USA. 2011;108:E1475–E1483. doi: 10.1073/pnas.1117988108. - DOI - PMC - PubMed

Publication types

MeSH terms