. 2019 Jul 5;10(1):2978.
doi: 10.1038/s41467-019-10877-8.

Multi-region exome sequencing reveals genomic evolution from preneoplasia to lung adenocarcinoma

Affiliations

Multi-region exome sequencing reveals genomic evolution from preneoplasia to lung adenocarcinoma

Xin Hu et al. Nat Commun. .

Erratum in

  • Author Correction: Multi-region exome sequencing reveals genomic evolution from preneoplasia to lung adenocarcinoma.
    Hu X, Fujimoto J, Ying L, Fukuoka J, Ashizawa K, Sun W, Reuben A, Chow CW, McGranahan N, Chen R, Hu J, Godoy MC, Tabata K, Kuroda K, Shi L, Li J, Behrens C, Parra ER, Little LD, Gumbs C, Mao X, Song X, Tippen S, Thornton RL, Kadara H, Scheet P, Roarty E, Ostrin EJ, Wang X, Carter BW, Antonoff MB, Zhang J, Vaporciyan AA, Pass H, Swisher SG, Heymach JV, Lee JJ, Wistuba II, Hong WK, Futreal PA, Su D, Zhang J. Hu X, et al. Nat Commun. 2021 May 12;12(1):2888. doi: 10.1038/s41467-021-23163-3. Nat Commun. 2021. PMID: 33980839 Free PMC article. No abstract available.

Abstract

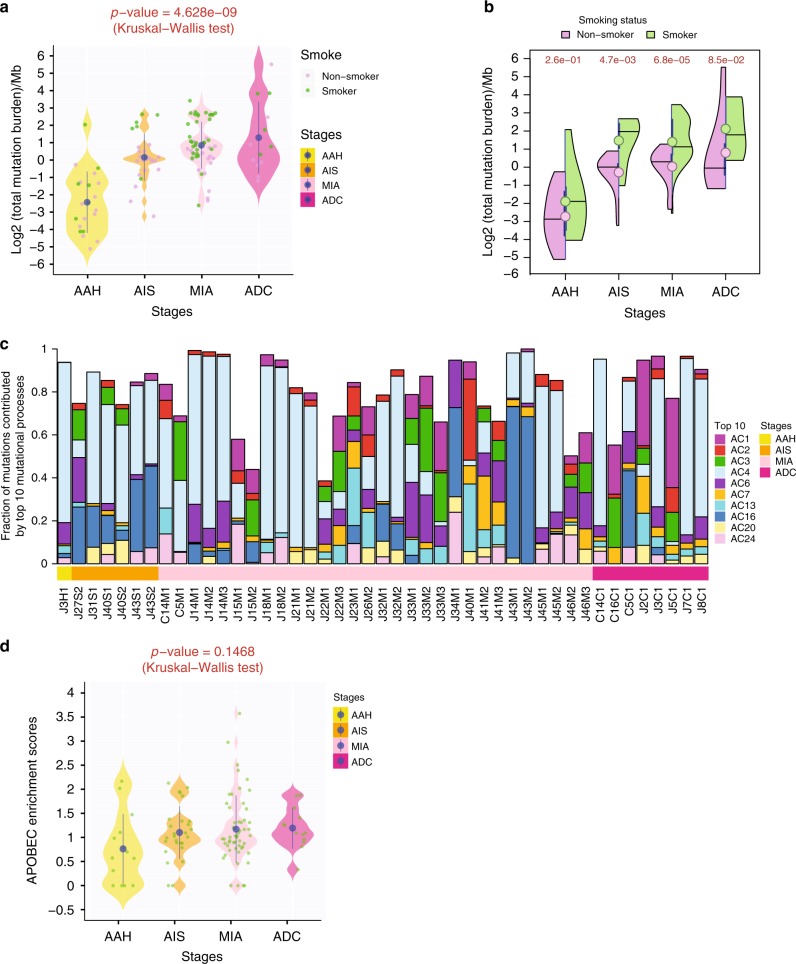
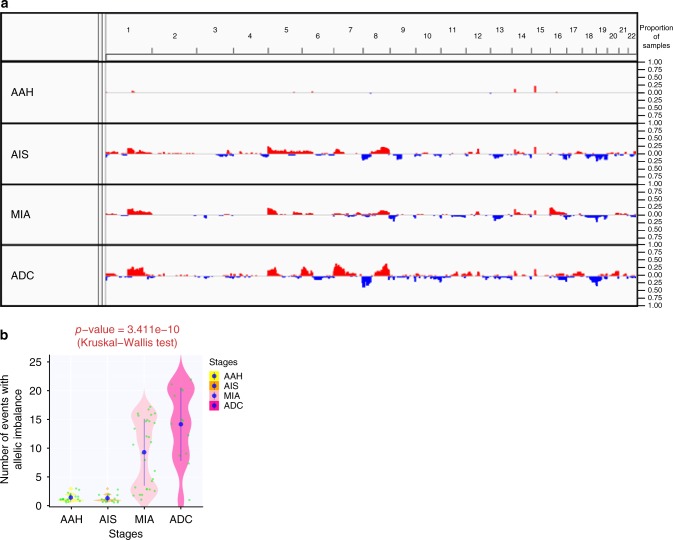
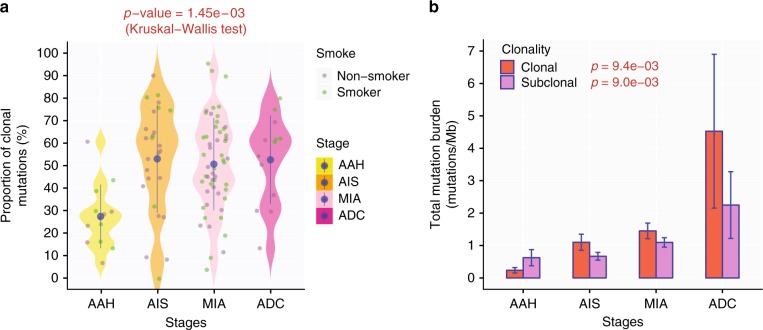
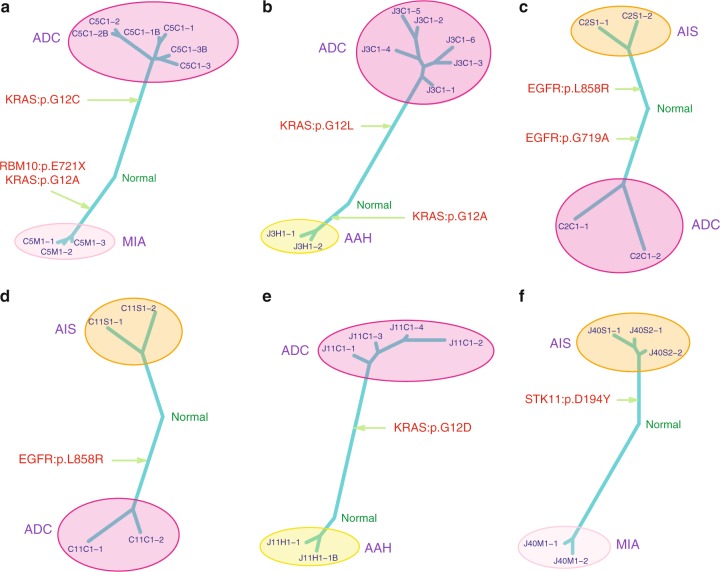
There has been a dramatic increase in the detection of lung nodules, many of which are preneoplasia atypical adenomatous hyperplasia (AAH), adenocarcinoma in situ (AIS), minimally invasive adenocarcinoma (MIA) or invasive adenocarcinoma (ADC). The molecular landscape and the evolutionary trajectory of lung preneoplasia have not been well defined. Here, we perform multi-region exome sequencing of 116 resected lung nodules including AAH (n = 22), AIS (n = 27), MIA (n = 54) and synchronous ADC (n = 13). Comparing AAH to AIS, MIA and ADC, we observe progressive genomic evolution at the single nucleotide level and demarcated evolution at the chromosomal level supporting the early lung carcinogenesis model from AAH to AIS, MIA and ADC. Subclonal analyses reveal a higher proportion of clonal mutations in AIS/MIA/ADC than AAH suggesting neoplastic transformation of lung preneoplasia is predominantly associated with a selective sweep of unfit subclones. Analysis of multifocal pulmonary nodules from the same patients reveal evidence of convergent evolution.


Conflict of interest statement

Dr. Wistuba reports personal fees from Genentech/Roche, Bristol-Myers Squibb, Medscape, Astra Zeneca/Medimmune, Pfizer, Ariad, HTG Molecular, Asuragen, Merck, GlaxoSmithKline, MSD and grants from Genentech, Oncoplex, HTG Molecular, DepArray, Merck, Bristol-Myers Squibb, Medimmune, Adaptive, Adaptimmune, EMD Serono, Pfizer, Takeda, Amgen, Karus, Johnson & Johnson, Bayer, 4D, Novartis and Perkin-Elmer (Akoya), outside the submitted work; Dr. Heymach reports personal fees AstraZeneca, Boehringer Ingelheim, Exelixis, Genentech, GSK, Guardant Health, Hengrui, Lilly, Novartis, Spectrum, EMD Serono, and Synta, grants from AstraZeneca, Bayer, GlaxoSmithKline, Spectrum and Royalties/Licensing fees from Spectrum, outside the submitted work; Dr. Zhang reports personal fees from BMS, AstraZeneca, Geneplus, OrigMed, Innovent, grant from Merck, outside the submitted work. The remaining authors declare no competing interests.

Figures

Fig. 1
Fig. 1
Progressive genomic evolution from AAH to ADC at the single nucleotide level. a Mutational burden. Each dot represents the mutational burden in each IPN from smokers (green) or non-smokers (purple). The solid blue dots represent the mean mutational burden of all lesions of each histologic stage. Kruskal–Wallis H test was used to compare mutational burden among all stages. b Mutational burden in smokers versus non-smokers. The violin plots represent the distribution of mutational burden in smokers (green) and non-smokers (purple), respectively, by each stage. The circles represent the mean mutational burden of IPNs from smokers (green) or non-smokers (purple) by each stage. Wilcoxon Rank-Sum test was used for the comparison between smokers and non-smokers. c Top 10 enriched mutational signatures. The Alexandrov-COSMIC mutational signatures were derived from all mutations in each IPN. Only IPNs with a minimum of 100 unique SNVs were included in mutational signature deconstruction. The stacked bar plot represents the fraction of estimated mutations for each signature in each IPN. d The enrichment of APOBEC-mediated processes. Each green dot represents APOBEC enrichment score in each IPN and the solid blue dots represent the mean APOBEC enrichment scores of all IPNs of each histologic stage with 95% confidence interval as error bars. The statistical significance between all stages was assessed by Kruskal–Wallis H test. Only lesions with a minimum of 10 SNVs were included for APOBEC enrichment analysis
Fig. 2
Fig. 2
Macroevolution from AAH to ADC at chromosomal level. a The somatic copy number aberrations across the genome. Each row represents all lesions grouped by histologic stage. Copy number gains, defined as the mean log2 ratio (IPN versus germ line DNA) >0.3 of all lesions by each given stage, are represented as red bars. Copy number losses, defined as the mean log2 ratio (IPN versus germ line DNA) ≤0.3 of all lesions by each histologic stage are represented as blue bars. The height of the bars is proportional to the fraction of IPNs showing copy number gains or losses at corresponding chromosomal regions. b The allelic imbalance. Each green dot represents the number of AI events in each IPN and the blue dots represent the mean number of AI events detected in IPNs of each histologic stage. The difference between all stages was assessed by Kruskal–Wallis H test
Fig. 3
Fig. 3
Clonal sweep from AAH to ADC. a Higher proportion of clonal mutations in later-stage IPNs. The mean proportions of clonal mutations in IPNs of each histologic stage are shown with 95% confidence interval as error bars. The difference between all stages was assessed by Kruskal–Wallis H test. Only IPNs with a minimum of 10 SNVs were included for subclonal analysis. b Progressive increase in clonal and subclonal mutations. The mean clonal mutational burden (orange) and subclonal mutational burden (purple) in AAH, AIS, MIA, and ADC are shown with 95% confidence interval as error bars. Kruskal–Wallis H test was used for comparing mutational burdens between all stages for clonal mutations and subclonal mutations
Fig. 4
Fig. 4
Cancer gene mutations and copy number aberrations in IPNs. Cancer gene mutations were defined as nonsynonymous mutations in known cancer genes identical to those previously reported and frame-shift indels or truncating mutations in tumor suppressor genes. Cancer genes located in chromosomal segments with copy number gains (red) or losses (green) are shown. A threshold of log2 ratio (IPN versus germ line DNA) >2 or ≤2 was used to screen for chromosomal gains or losses, respectively
Fig. 5
Fig. 5
Representative phylogenetic trees of multifocal IPNs. a–f Phylogenetic trees were generated from all SNVs by using the Wagner parsimony method in “phangorn” package. Known cancer gene mutations are mapped to the trunks and branches as indicated. Trunk and branch lengths are proportional to the numbers of mutations acquired on the corresponding trunks or branchs

References

    1. Aberle DR, et al. Reduced lung-cancer mortality with low-dose computed tomographic screening. N. Engl. J. Med. 2011;365:395–409. doi: 10.1056/NEJMoa1102873. - DOI - PMC - PubMed
    1. Detterbeck FC, Homer RJ. Approach to the ground-glass nodule. Clin. Chest Med. 2011;32:799–810. doi: 10.1016/j.ccm.2011.08.002. - DOI - PubMed
    1. Kodama K, et al. Treatment strategy for patients with small peripheral lung lesion(s): intermediate-term results of prospective study. Eur. J. Cardiothorac. Surg. 2008;34:1068–1074. doi: 10.1016/j.ejcts.2008.07.044. - DOI - PubMed
    1. Mun M, Kohno T. Efficacy of thoracoscopic resection for multifocal bronchioloalveolar carcinoma showing pure ground-glass opacities of 20 mm or less in diameter. J. Thorac. Cardiovasc. Surg. 2007;134:877–882. doi: 10.1016/j.jtcvs.2007.06.010. - DOI - PubMed
    1. Ohtsuka T, Watanabe K, Kaji M, Naruke T, Suemasu K. A clinicopathological study of resected pulmonary nodules with focal pure ground-glass opacity. Eur. J. Cardiothorac. Surg. 2006;30:160–163. doi: 10.1016/j.ejcts.2006.03.058. - DOI - PubMed

Publication types