. 2019 Jul 5;9(1):9786.
doi: 10.1038/s41598-019-45148-5.

Comparing socioeconomic inequalities between early neonatal mortality and facility delivery: Cross-sectional data from 72 low- and middle-income countries

Affiliations

Comparing socioeconomic inequalities between early neonatal mortality and facility delivery: Cross-sectional data from 72 low- and middle-income countries

Terhi J Lohela et al. Sci Rep. .

Abstract

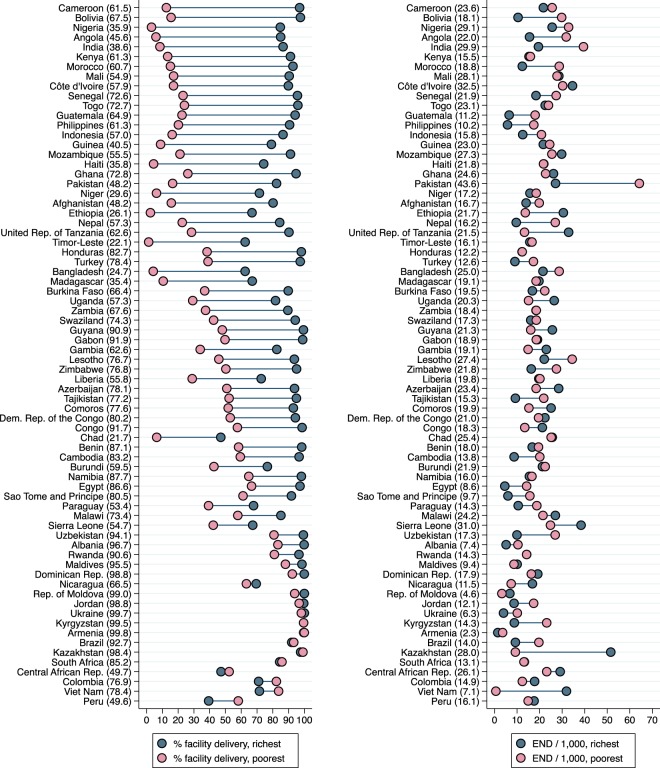
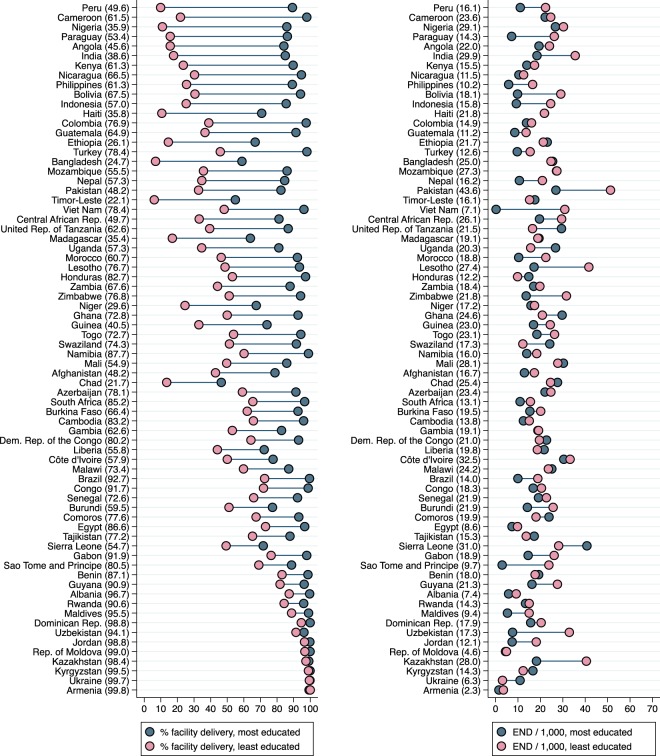
Facility delivery should reduce early neonatal mortality. We used the Slope Index of Inequality and logistic regression to quantify absolute and relative socioeconomic inequalities in early neonatal mortality (0 to 6 days) and facility delivery among 679,818 live births from 72 countries with Demographic and Health Surveys. The inequalities in early neonatal mortality were compared with inequalities in postneonatal infant mortality (28 days to 1 year), which is not related to childbirth. Newborns of the richest mothers had a small survival advantage over the poorest in unadjusted analyses (-2.9 deaths/1,000; OR 0.86) and the most educated had a small survival advantage over the least educated (-3.9 deaths/1,000; OR 0.77), while inequalities in postneonatal infant mortality were more than double that in absolute terms. The proportion of births in health facilities was an absolute 43% higher among the richest and 37% higher among the most educated compared to the poorest and least educated mothers. A higher proportion of facility delivery in the sampling cluster (e.g. village) was only associated with a small decrease in early neonatal mortality. In conclusion, while socioeconomically advantaged mothers had much higher use of a health facility at birth, this did not appear to convey a comparable survival advantage.


Conflict of interest statement

The authors declare no competing interests.

Figures

Figure 1
Figure 1
Pathways through which household wealth and maternal education could increase early neonatal and postneonatal infant survival. Higher wealth and education increase facility delivery and are thought to improve postneonatal survival mainly through good care practices at home and through timely care-seeking for the baby. Facility delivery can, but does not automatically ensure, high quality of care (red arrow) and any early neonatal survival benefit conferred by facility delivery depends largely on quality of care at birth. Pathways postulated to be stronger are represented by continuous arrows and weaker pathways by dashed arrows. Measured factors are represented squared while unmeasured factors are circled.
Figure 2
Figure 2
Average early neonatal mortality and unadjusted wealth-related (a) and education-related (b) inequalities in early neonatal mortality in 72 low- and middle-income Demographic and Health Survey countries. The graphs show a reference line for the Sustainable Development Goal mortality target of 12 neonatal deaths per 1,000 live births. In countries above the zero line for inequality, mortality is higher among the wealthier or the more educated, i.e. inverse to what one would expect. Countries with significant inequalities (p < 0.05) are highlighted in yellow. Sample weights and robust standard errors were used in analyses.
Figure 3
Figure 3
Unadjusted wealth-related inequalities in facility delivery and early neonatal mortality in 72 low- and middle-income Demographic and Health Survey countries. Country-level average prevalence of facility delivery (left) and early neonatal deaths per 1,000 live births (right) are shown in parentheses after the country name. Countries are sorted in descending order of inequality in facility delivery between the richest and poorest households. Countries with inverse inequalities i.e. lower percentage of facility deliveries among the richest compared with the poorest, such as Central African Republic, Colombia, Viet Nam and Peru, are at the bottom. Sample weights and robust standard errors were used in analyses. Pooled estimates are from inverse-variance random-effects meta-analyses. END/1,000 = early neonatal deaths per 1,000 live births. Graph command is from www.equidade.org.
Figure 4
Figure 4
Unadjusted education-related inequalities in facility delivery and early neonatal mortality in 72 low- and middle-income Demographic and Health Survey countries. Country-level average prevalence of facility delivery (left) and early neonatal deaths per 1,000 live births (right) are shown in parentheses after the country name. Countries are sorted in descending order of inequality in facility delivery between the most and least educated mothers. Sample weights and robust standard errors were used in analyses. Pooled estimates are from inverse-variance random-effects meta-analyses. END/1,000 = early neonatal deaths per 1,000 live births. Graph command is from www.equidade.org.

References

    1. WHO. Global Health Observatory (GHO) data. Neonatal mortality. Situation and trends. https://who.int/gho/child-health/mortality/neonatal_text/en/ (2019).
    1. Wang H, Bhutta ZA, Coates MM, Coggeshall M. Global, regional, national, and selected subnational levels of stillbirths, neonatal, infant, and under-5 mortality, 1980–2015: a systematic analysis for the Global Burden of Disease Study 2015. Lancet. 2016;388:1725–1774. doi: 10.1016/S0140-6736(16)31575-6. - DOI - PMC - PubMed
    1. Lawn JE, et al. Every Newborn: progress, priorities, and potential beyond survival. Lancet. 2014;384:189–205. doi: 10.1016/S0140-6736(14)60496-7. - DOI - PubMed
    1. Oza S, Lawn JE, Hogan DR, Mathers C, Cousens SN. Neonatal cause-of-death estimates for the early and late neonatal periods for 194 countries: 2000-2013. Bull. World Health Organ. 2015;93:19–28. doi: 10.2471/BLT.14.139790. - DOI - PMC - PubMed
    1. Liu L, et al. Global, regional, and national causes of child mortality in 2000-13, with projections to inform post-2015 priorities: an updated systematic analysis. Lancet. 2015;385:430–440. doi: 10.1016/S0140-6736(14)61698-6. - DOI - PubMed

Publication types