. 2019 Jul 5;9(1):9752.
doi: 10.1038/s41598-019-46068-0.

Cathepsin Z as a novel potential biomarker for osteoporosis

Affiliations

Cathepsin Z as a novel potential biomarker for osteoporosis

Ayed A Dera et al. Sci Rep. .

Abstract

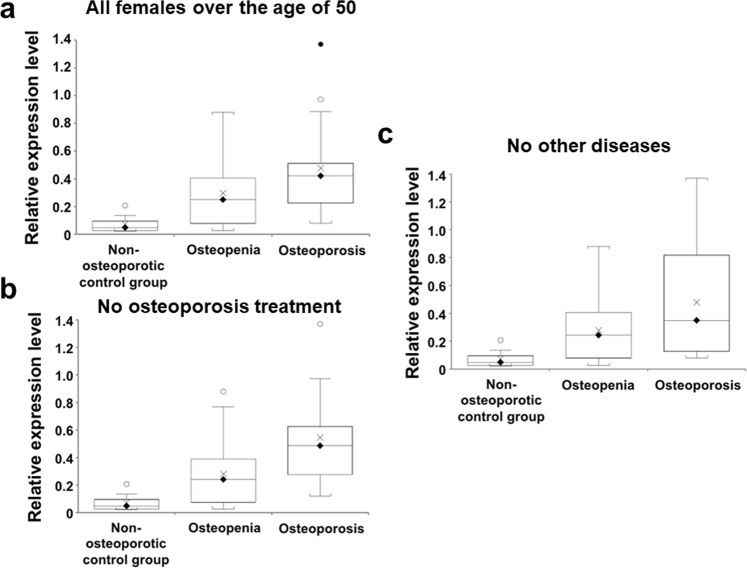
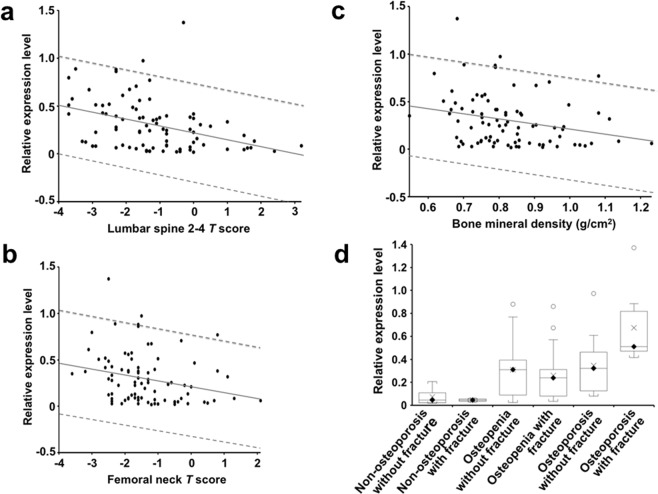
Osteoporosis, one of the most prevalent chronic ageing-related bone diseases, often goes undetected until the first fragility fracture occurs, causing patient suffering and cost to health/social care services. Osteoporosis arises from imbalanced activity of osteoclasts and osteoblasts. Since these cell lineages produce the protease, cathepsin Z, the aim of this study was to investigate whether altered cathepsin Z mRNA levels are associated with osteoporosis in clinical samples. Cathepsin Z mRNA in human peripheral blood mononuclear cells was significantly differentially-expressed among non-osteoporotic controls, osteopenia and osteoporosis patients (p < 0.0001) and in female osteoporosis patients over the age of 50 years (P = 0.0016). Cathepsin Z mRNA level strongly correlated with low bone mineral density (BMD) (g/cm2), lumbar spine L2-L4 and femoral neck (T-scores) (P = 0.0149, 0.0002 and 0.0139, respectively). Importantly, cathepsin Z mRNA was significantly associated with fragility fracture in osteoporosis patients (P = 0.0018). The levels of cathepsin Z mRNA were not significantly higher in patients with chronic inflammatory disorders in these two groups compared to those without (P = 0.774 and 0.666, respectively). ROC analysis showed that cathepsin Z mRNA has strong diagnostic value for osteoporosis and osteoporotic fracture. The results show for the first time that cathepsin Z could be a future diagnostic biomarker for osteoporosis including female osteoporosis patients over the age of 50 years.


Conflict of interest statement

The authors declare no competing interests.

Figures

Figure 1
Figure 1
Association with osteoporosis of cathepsin Z mRNA levels in peripheral blood mononuclear cells. Panel (a) box and whisker plot shows significant differences in the levels of cathepsin Z mRNA between all non-osteoporotic controls, patients with osteopenia and patients with osteoporosis (P < 0.0001, ANOVA). Similar significant differences were evident when the analysis was confined to subjects who were over 50 years of age (P < 0.0001, ANOVA; panel b) or when those subjects who were receiving treatment for osteoporosis were excluded from the analysis (P < 0.0001, ANOVA; panel c) or when subjects who were suffering from other non-osteoporotic disorders were excluded from the analysis (P = 0.0002, ANOVA, panel d). On each box and whisker plot, the black diamond shows the median value, the cross shows the mean value, white and black circles denote outliers of 1.5 times and 3 times the interquartile range, respectively.
Figure 2
Figure 2
Association with osteoporosis of cathepsin Z mRNA levels in peripheral blood mononuclear cells of female participants over the age of 50. Panel a: box and whisker plot shows significant differences in the levels of cathepsin Z mRNA between female non-osteoporotic controls, patients with osteopenia and patients with osteoporosis all over the age of 50 (P = 0.0016, ANOVA). Similar, significant differences were evident when those subjects who were receiving treatment for osteoporosis were excluded from the analysis (P = 0.0012, ANOVA; panel b) or when subjects who were suffering from other non-osteoporotic disorders were excluded from the analysis (P = 0.0052, ANOVA, panel c). On each box and whisker plot, the black diamond shows the median value, the cross shows the mean value, white and black circles denote outliers of 1.5 times and 3 times the interquartile range, respectively.
Figure 3
Figure 3
Relationship between the levels of cathepsin Z mRNA and bone mineral density and fracture history in all participants. The level of cathepsin Z mRNA significantly decreased with increasing T-score measured either in the lumbar spine (L2–4; P = 0.0002, linear regression; panel a) or at the femoral neck (P = 0.0139, linear regression; panel b). The level of cathepsin Z mRNA also significantly decreased with increasing bone mineral density BMD (g/cm2) (P = 0.0149, linear regression; panel c). The solid line denotes the linear regression line; the broken lines represent the 95% prediction intervals. Panel d: box and whisker plots show that while there was no significant difference in the level of cathepsin Z mRNA between non-osteoporotic controls with or without fracture (P = 0.851) or between osteopenia patients with or without fracture (P = 0.474), the cathepsin Z mRNA levels were significantly higher in osteoporosis patients with fracture than those without fracture (P = 0.0018). On the box and whisker plots, the black diamond shows the median value, the cross shows the mean value, white and black circles denote outliers 1.5-fold higher and 3-fold higher than the interquartile range, respectively.
Figure 4
Figure 4
Diagnostic value of levels of cathepsin Z in PBMC for osteoporosis. Participants were divided into three groups based on their bone mineral density T scores (a non-osteoporotic control group having T scores ≥−1.0, an osteopenia group with T score <−1.0 and >−2.5 and an osteoporosis group with T score ≤−2.5). ROC curves are shown for the comparison between osteoporosis patients and non-osteoporotic controls (Panel a; AUC = 0.92, sensitivity, 82.6%, 95% CI = 61.2 to 95%; specificity, 94.1%, 95% CI = 71.3 to 99.9%), between osteopenia patients and non-osteoporotic controls (Panel b; AUC, 0.817; sensitivity, 79.2%, 95% CI = 65 to 89.5%; specificity, 82.4%, 95% CI = 56.6 to 96.2%), between osteoporosis and osteopenia patients together and non-osteoporotic controls (Panel c; AUC = 0.851, sensitivity, 83.1%, 95% CI = 72.3 to 91%; specificity, 82.4%, 95% CI = 56.6 to 96.2%) and between non-osteoporotic controls and osteoporosis patients who had previously suffered a fracture (Panel d; AUC = 0.96, sensitivity 100%, 95% CI 73.5 to 100%; specificity, 94.1%, 95% CI 71.3 to 99.9%). AUC = Area under the curve. CI = Confidence interval. The large circle signifies the optimal cut-off.

References

    1. Harvey N, Dennison E, Cooper C. Osteoporosis: impact on health and economics. Nat Rev Rheumatol. 2010;6:99–105. doi: 10.1038/nrrheum.2009.260. - DOI - PubMed
    1. Feng X, McDonald JM. Disorders of bone remodeling. Annu Rev Pathol. 2011;6:121–145. doi: 10.1146/annurev-pathol-011110-130203. - DOI - PMC - PubMed
    1. Teitelbaum SL. Bone resorption by osteoclasts. Science. 2000;289:1504–1508. doi: 10.1126/science.289.5484.1504. - DOI - PubMed
    1. Aubin JE. Regulation of osteoblast formation and function. Reviews in endocrine & metabolic disorders. 2001;2:81–94. doi: 10.1023/A:1010011209064. - DOI - PubMed
    1. Jevnikar Z, Obermajer N, Bogyo M, Kos J. The role of cathepsin X in the migration and invasiveness of T lymphocytes. J Cell Sci. 2008;121:2652–2661. doi: 10.1242/jcs.023721. - DOI - PubMed

Publication types

MeSH terms