. 2019 Jul 5;9(1):9790.
doi: 10.1038/s41598-019-46156-1.

Delayed recruiting of TPD52 to lipid droplets - evidence for a "second wave" of lipid droplet-associated proteins that respond to altered lipid storage induced by Brefeldin A treatment

Affiliations

Delayed recruiting of TPD52 to lipid droplets - evidence for a "second wave" of lipid droplet-associated proteins that respond to altered lipid storage induced by Brefeldin A treatment

Yuyan Chen et al. Sci Rep. .

Abstract

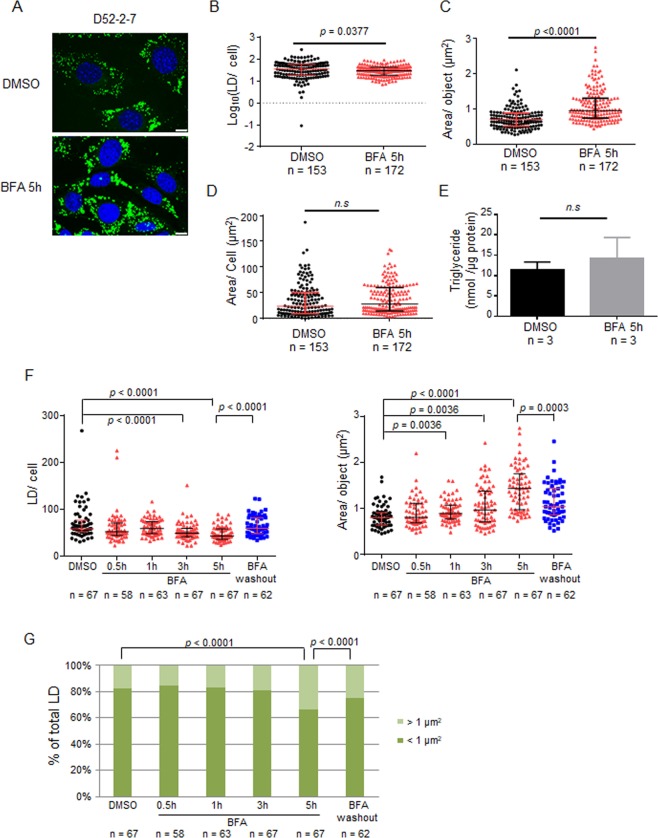
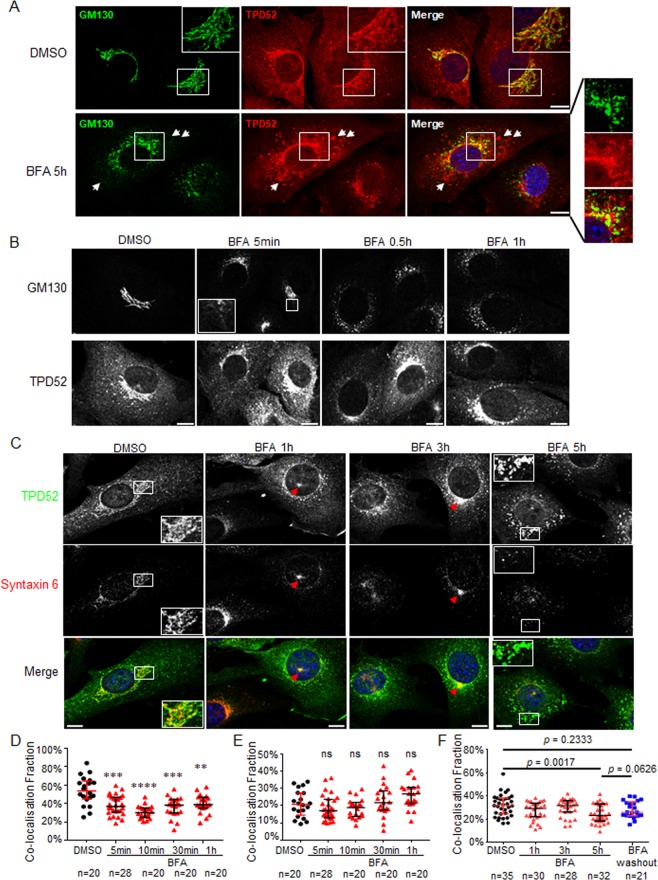
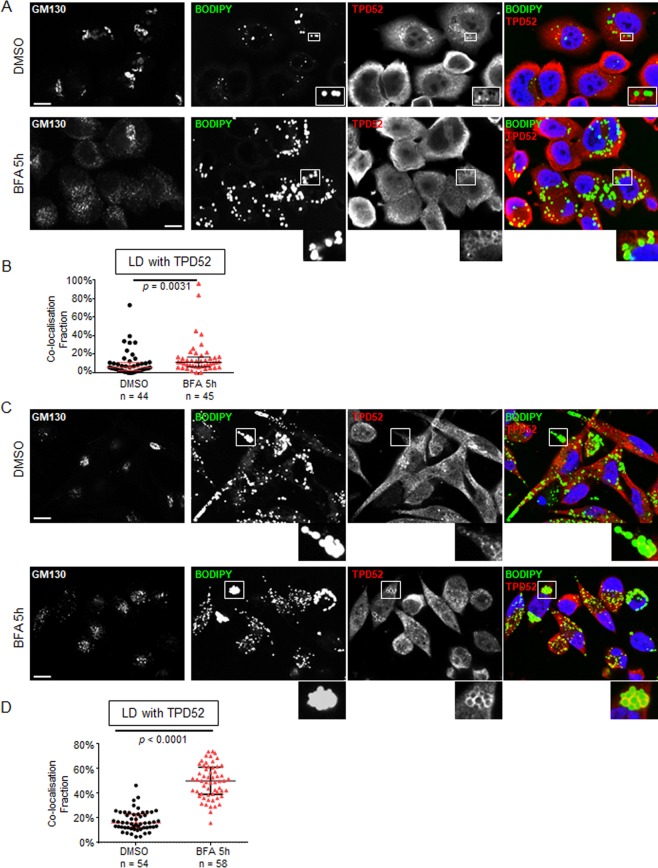
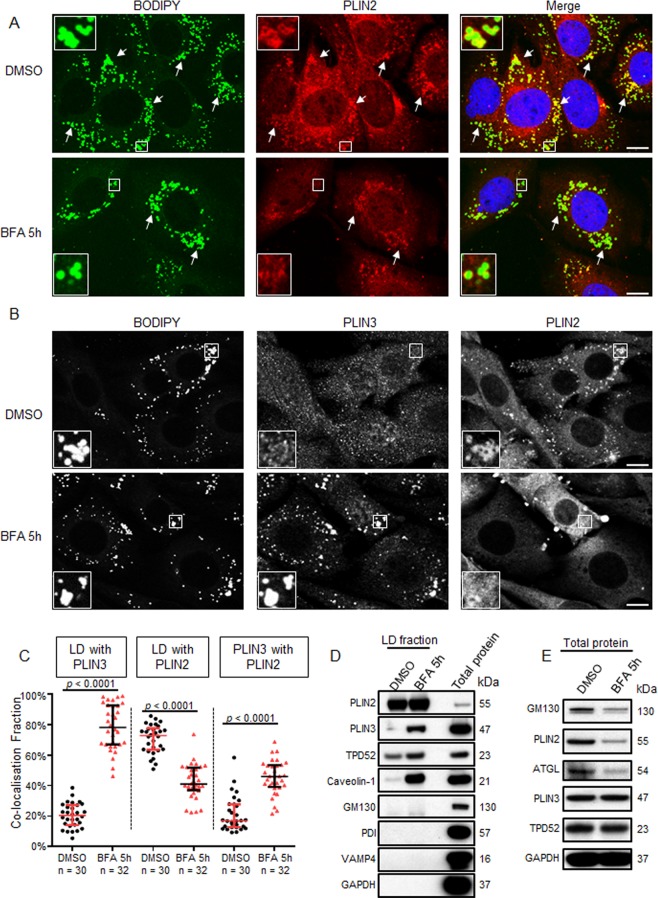
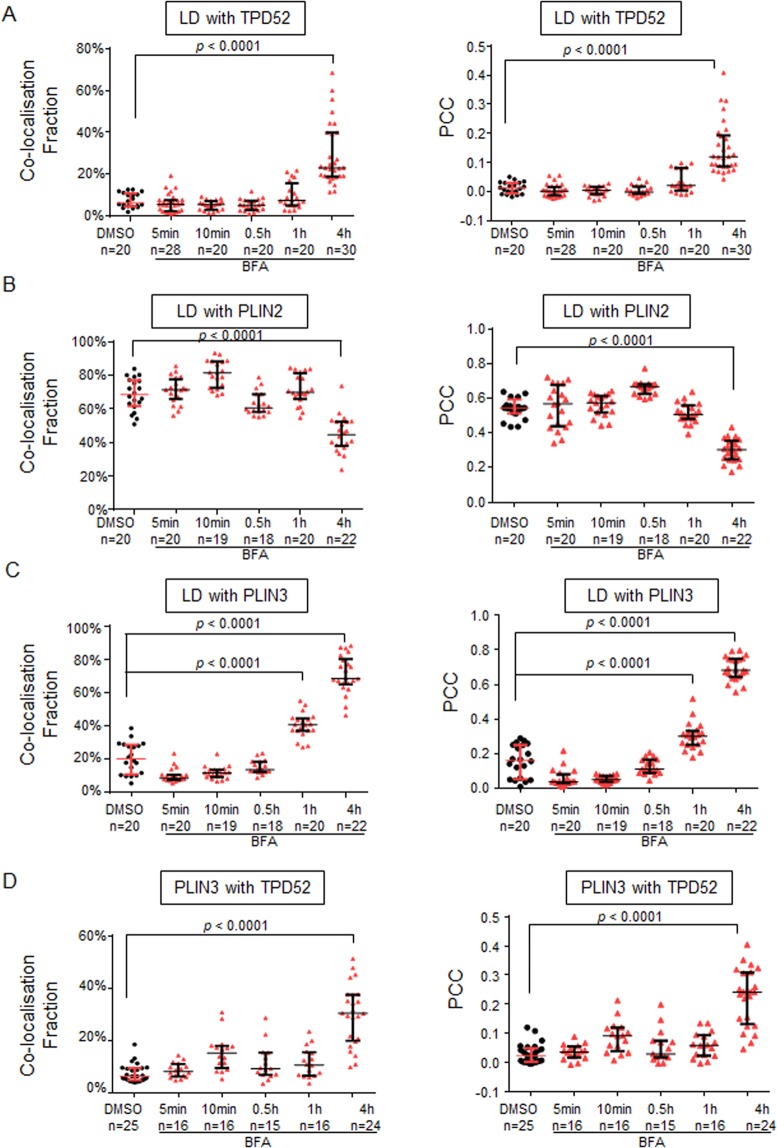
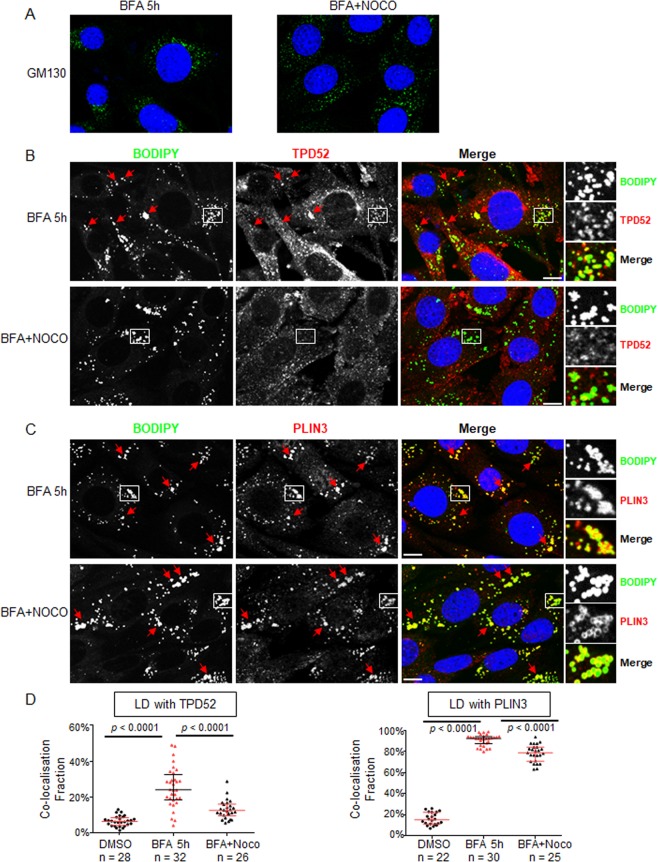
Tumor protein D52 (TPD52) is amplified and overexpressed in breast and prostate cancers which are frequently characterised by dysregulated lipid storage and metabolism. TPD52 expression increases lipid storage in mouse 3T3 fibroblasts, and co-distributes with the Golgi marker GM130 and lipid droplets (LDs). We examined the effects of Brefeldin A (BFA), a fungal metabolite known to disrupt the Golgi structure, in TPD52-expressing 3T3 cells, and in human AU565 and HMC-1-8 breast cancer cells that endogenously express TPD52. Five-hour BFA treatment reduced median LD numbers, but increased LD sizes. TPD52 knockdown decreased both LD sizes and numbers, and blunted BFA's effects on LD numbers. Following BFA treatment for 1-3 hours, TPD52 co-localised with the trans-Golgi network protein syntaxin 6, but after 5 hours BFA treatment, TPD52 showed increased co-localisation with LDs, which was disrupted by microtubule depolymerising agent nocodazole. BFA treatment also increased perilipin (PLIN) family protein PLIN3 but reduced PLIN2 detection at LDs in TPD52-expressing 3T3 cells, with PLIN3 recruitment to LDs preceding that of TPD52. An N-terminally deleted HA-TPD52 mutant (residues 40-184) almost exclusively targeted to LDs in both vehicle and BFA treated cells. In summary, delayed recruitment of TPD52 to LDs suggests that TPD52 participates in a temporal hierarchy of LD-associated proteins that responds to altered LD packaging requirements induced by BFA treatment.


Conflict of interest statement

The authors declare no competing interests.

Figures

Figure 1
Figure 1
BFA treatment decreased LD numbers but increased LD sizes in D52-2-7 cells. (A) Representative images of LDs stained with BODIPY 493/503 (green) and nuclei stained with DAPI (blue) in D52-2-7 cells treated with vehicle (0.02% (v/v) DMSO), or 2 µg/ml (7.1 µM) BFA for 5 h. Scale bar = 10 μm. (B–D) Quantification of (B) LD numbers/cell (Log10 scale, Y axis), (C) LD areas (μm2)/object (Y axis), and (D) total LD areas/cell (Y axis) from the indicated numbers of images (below X axes) obtained from 6 independent experiments of D52-2-7 cells treated with vehicle (DMSO, black circles) or BFA (red triangles) for 5 h. Horizontal lines indicate median values, bounded by interquartile range. P values, Mann Whitney u test. (E) Triglyceride levels (Y axis, nmol/µg protein, mean values +/− s.e.m values from 3 independent experiments) measured in vehicle (black) or BFA-treated (grey) cells as describe above. n.s = not statistically significant, Student’s t-test. (F) Quantification of LD numbers/cell (Y axis, left), and LD areas (μm2)/object (Y axis, right) from the indicated numbers of images (below X axes) obtained from 3 independent experiments of D52-2-7 cells treated with DMSO vehicle for 5 h (black circles), or BFA for indicated time periods (red triangles), or following PBS washout after 5 h BFA treatment, and incubation at 37 °C for 1 h in complete media without BFA (BFA washout, blue squares). Horizontal lines indicate median values, bounded by interquartile ranges. P values, Mann Whitney u test. (G) Quantification of percentages (Y axis) of LDs with area >1 μm2 (light green) or ≤1 μm2 (dark green) in D52-2-7 cells after treatments described in (F) (X axis). P value, Pearson’s Chi-Squared test.
Figure 2
Figure 2
TPD52 knockdown decreased both LD numbers and sizes, and attenuated the effects of BFA on LD numbers in D52-2-7 cells. (A) Western blot analyses of D52-2-7 cells transfected with non-targeting siRNA (si-Neg) or TPD52-siRNA (si-TPD52) for 72 h and then treated with either vehicle (DMSO) or 2 µg/ml BFA for 5 h. Total protein extracts were subjected to Western blot analyses. GAPDH served as a loading control. Proteins are shown at left; molecular weights (kDa) are shown at right. Protein levels were quantified using Image J and normalised TPD52/GAPDH ratios (as described in the Methods) are indicated below the blots. See unprocessed Western blot images in Supplementary Fig. 11. (B) D52-2-7 cells were treated as described in (A), and then subjected to immunofluorescence analysis with LDs stained with BODIPY (green) and nuclei stained with DAPI (blue). Images shown are representative of those obtained in 3 independent experiments. Scale bar = 10 μm. (C–E) Quantification of (C) LD numbers/cell (Y axis), (D) LD areas (μm2)/object (Y axis), (E) LD areas (μm2)/cell in non-targeting siRNA-transfected, or TPD52-siRNA-transfected D52-2-7 cells following the indicated treatments (X axis) carried out as described in (A). Numbers of images quantified from vehicle-treated (DMSO, black circles), or BFA-treated (red triangles) cells obtained from 3 independent experiments are indicated below the X axes. Horizontal lines indicate median values, bounded by interquartile ranges. P values, Mann Whitney u test. n.s, not significant.
Figure 3
Figure 3
Redistribution of TPD52, GM130, and syntaxin 6 post-BFA treatment in D52-2-7 cells. (A) Indirect immunofluorescence analyses of D52-2-7 cells treated with vehicle control (DMSO) or 2 µg/ml BFA for 5 h, co-stained with GM130 (green) and TPD52 (red) with merged images. Enlarged images of white boxed regions indicate partial co-localisation of GM130 and TPD52 in vehicle-treated cells (DMSO), whereas co-localisation became more limited after BFA treatment. The ring structures indicated by white arrows in BFA-treated D52-2-7 cells were largely separate from the GM130-stained region. (B) Immunofluorescence analyses of D52-2-7 cells treated with vehicle (DMSO), or 2 µg/ml BFA for the indicated time periods, co-stained with GM130 and TPD52. The boxed region indicates the extended tabular network. (C) Immunofluorescence analyses of D52-2-7 cells treated with vehicle for 5 h (DMSO), or 2 µg/ml BFA for the indicated time periods, co-stained with syntaxin 6 (red) and TPD52 (green) with merged images. Enlarged images of white boxed regions indicate co-localisation between syntaxin 6 (red) and TPD52 (green) in DMSO-treated cells, contrasting with the comparatively limited syntaxin 6 and TPD52 co-localisation after 5 h BFA treatment. Red arrows indicate the co-staining of syntaxin 6 and TPD52 at the microtubule organising centre region after 1 h and 3 h BFA treatment. Images are representative of those obtained in 3 independent experiments. Scale bar = 10 μm. (D) Quantification of the fraction of GM130 co-localised with TPD52 using a custom-written MATLAB code as described in the Methods and supplementary information. Manders’ co-localisation coefficients (Y axis) from the indicated numbers of images (below the X axis) were obtained from D52-2-7 cells treated with DMSO vehicle for 1 h (black circles), or BFA for indicated time periods (red triangles). Horizontal lines indicate median values, bounded by interquartile ranges. ***p < 0.001 (DMSO vs BFA 5 min, DMSO vs BFA 30 min); ****p < 0.0001 (DMSO vs BFA 10 min); **p < 0.01 (DMSO vs BFA 1 h); Mann Whitney u test. (E) Quantification of the fraction of TPD52 co-localised with GM130 as described in (D). No significant differences (ns) were detected at each time point when compared with DMSO treatment; Mann Whitney u test. (F) Quantification of co-localisation fractions between syntaxin 6 and TPD52 using Manders’ co-localisation coefficients (Y axis) from the indicated numbers of images (below the X axis) from D52-2-7 cells treated with DMSO vehicle for 5 h (black circles), or BFA for indicated time periods (red triangles), or BFA washout as described in Fig. 1 (blue squares). Horizontal lines indicate median values, bounded by interquartile ranges. P values, Mann Whitney u test.
Figure 4
Figure 4
Significantly increased TPD52 detection at PLIN2-positive ring structures post-BFA treatment in D52-2-7 cells. (A) Immunofluorescence analyses of D52-2-7 cells treated with vehicle (DMSO) or 2 µg/ml BFA for 5 h, stained with PLIN2 (green) and TPD52 (red). White arrows indicate PLIN2- and TPD52-positive ring structures in BFA-treated cells. Enlarged images of white boxed regions indicate co-localisation between PLIN2 and TPD52 in vehicle-treated cells (DMSO), which became more prominent after BFA treatment. Images shown are representative of those obtained in 3 independent experiments. Scale bar = 10 μm. (B) STED imaging (top panel) and corresponding confocal images (bottom panel) of D52-2–7 cells treated as described in (A), stained with PLIN2 (pseudo-coloured green) and TPD52 (pseudo-coloured red) with merged images. Images are representative of those obtained from 2 independent experiments which were captured using Leica TCS SP8 STED 3X microsystem with a 100x objective lens. Scale bar = 8 μm. Quantification of (C) co-localisation fractions using Manders’ co-localisation coefficients (Y axis) and (D) Pearson’s correlation coefficients (PCC, Y axis) between PLIN2 and TPD52 from the indicated numbers of images (below X axes) obtained from 3 independent experiments where cells were treated with either vehicle (DMSO, black circles) or BFA (red triangles) as described in (A). Horizontal lines indicate median values, bounded by interquartile ranges. P values, Mann Whitney u test.
Figure 5
Figure 5
BFA treatment promoted TPD52 detection at LDs in AU565 and HMC-1-8 breast cancer cells. Immunofluorescence analyses of (A) AU565 and (C) HMC-1-8 cells following vehicle (DMSO) or 2 µg/ml BFA treatment for 5 h, stained with GM130, and BODIPY (green), TPD52 (red), and DAPI (blue), as shown in merged images at the right. Enlarged images of white boxed regions indicate co-localisation of TPD52 and BODIPY-stained LDs. Images are representative of those obtained in 3 independent experiments. Scale bar = 10 μm. (B,D) Quantification of co-localisation fractions (Manders’ co-localisation coefficients, Y axes) between BODIPY-stained LDs and TPD52 from the indicated numbers of images (below X axes) obtained from 3 independent experiments where AU565 (B) or HMC-1-8 (D) cells were treated with vehicle (DMSO, black circles) or BFA (BFA 5 h, red triangles). Horizontal lines indicate median values, bounded by interquartile ranges. P values, Mann Whitney u test.
Figure 6
Figure 6
Recruitment of PLIN3 to LDs and loss of PLIN2 from LDs in BFA-treated D52-2-7 cells. (A,B) Immunofluorescence analyses of D52-2-7 cells treated with vehicle (DMSO) or 2 µg/ml BFA for 5 h, co-stained with (A) BODIPY (green), PLIN2 (red) and DAPI (blue), or (B) BODIPY, PLIN3 and PLIN2. Images are representative of those obtained in 3 independent experiments. Scale bar = 10 μm. (A) White arrows indicate PLIN2-associated LDs. Enlarged images of white boxed regions in vehicle-treated cells (DMSO) indicate LDs with PLIN2 staining, whereas enlarged images of the white boxed region in BFA-treated cells indicate LDs with limited PLIN2 staining. (B) Enlarged images of the white boxed region in vehicle-treated cells (DMSO) indicate LDs with PLIN2 staining but limited PLIN3 staining, whereas enlarged images of the white boxed region in BFA-treated cells indicate PLIN3-associated LDs with limited PLIN2 staining. (C) Quantification of Manders’ co-localisation coefficients (Y axis) between BODIPY-stained LDs and either PLIN3 (left) or PLIN2 (middle), and between PLIN3 and PLIN2 (right), quantified from the indicated numbers of images obtained from 3 independent experiments (below X axes) where cells were treated with either vehicle (DMSO, black circles) or BFA (red triangles) for 5 h. Horizontal lines indicate median values, bounded by interquartile ranges. P values, Mann Whitney u test. (D) LD fractions were purified from D52-2-7 cells treated with 400 μM OA complexed with fatty-acid-free BSA for 24 h, and then treated with DMSO or 2 µg/ml BFA for 5 h. Ten µg proteins extracted from LD fractions were analysed by Western blot and compared with 10 µg total proteins extracted from untreated D52-2-7 cells. (E) Western blot analyses of total protein extracts from D52-2-7 cells treated with DMSO or 2 µg/ml BFA for 5 h. Antisera to the proteins detected are shown at the left, and molecular weights (kDa) are shown at the right. GAPDH served as a loading control. See unprocessed Western blot images of (D,E) in Supplementary Fig. 11.
Figure 7
Figure 7
Differential dynamics of TPD52 and PLIN3 recruitment to LDs in D52-2-7 cells post-BFA treatment. Manders’ co-localisation coefficients (co-localisation fractions, Y axes, left) and Pearson’s correlation coefficients (Y axes, right) between (A) BODIPY-stained LDs and TPD52, (B) LDs and PLIN2, (C) LDs and PLIN3, and (D) PLIN3 and TPD52, quantified from the indicated numbers of images (below X axes) obtained from 3 independent experiments where cells were treated with either vehicle (DMSO, black circles) or BFA (red triangles) for the indicated time periods (X axes). Horizontal lines indicate median values, bounded by interquartile ranges. P values, Mann Whitney u test.
Figure 8
Figure 8
TPD52 recruitment to LDs in D52-2-7 cells is microtubule-dependent. D52-2-7 cells were treated with vehicle (DMSO) or 2 µg/ml BFA for 5 h (BFA 5 h), or with the addition of 2 µg/ml nocodazole after 4 h BFA treatment and incubation for another 1 h in the presence of BFA (BFA + NOCO), followed by immunofluorescent co-staining of (A) GM130 (green) and DAPI (blue), (B) TPD52 (red) and BODIPY (green), or (C) PLIN3 (red) and BODIPY (green). Enlarged images of white boxed regions in (B) indicate co-localisation of TPD52 and LD after 5 h BFA treatment, but more limited TPD52 and LD co-localisation after BFA and nocodazole co-treatment. In contrast, enlarged images of white boxed regions in (C) show PLIN3 and LD co-localisation following both treatments. Red arrows indicate other examples of (B) TPD52 and LD-colocalisations or (C) PLIN3 and LD-colocalisations. Images are representative of those obtained in 3 independent experiments. Scale bar = 10 μm. (D) Manders’ co-localisation coefficients (co-localisation fractions, Y axes) between BODIPY-stained LDs and TPD52 (left), or LDs and PLIN3 (right), quantified from the indicated numbers of images (below X axes) obtained from 3 independent experiments where cells were treated with either vehicle (DMSO, black circles), BFA (BFA 5 h, red triangles), or BFA followed by nocodazole (BFA + Noco, black triangles). Horizontal lines indicate median values, bounded by interquartile ranges. P values, Mann Whitney u test.
Figure 9
Figure 9
Predicted amphipathic helices and ALPS-like motifs in TPD52-like proteins. (A) Alignment of human TPD52, TPD52L1, TPD52L2 and TPD52L3 sequences (Swissprot isoform identifiers shown) using the one-letter code, produced by the Clustal Omega algorithm at EMBL-EBI. Numbers to the right of sequences refer to amino acid positions. Asterisks below the alignment indicate identical residues, and colons/dots indicate highly/weakly conserved residues scoring >0.5/≤0.5 in the Gonnet PAM 250 matrix, respectively. Hyphens within the alignment represent inserted gaps. Amphipathic helices predicted by HELIQUEST are shown in green, and ALPS-like motifs are shown in bold and underlined. Large hydrophobic residues (F, I, L, M, W, Y) within amphipathic helices are indicated in red.
Figure 10
Figure 10
HA-tagged TPD52 aa 40–184 largely localised to LDs regardless of DMSO or BFA treatment. Immunofluorescence analyses of 3T3 cells transfected with (A) pHM6 HA-tagged full-length TPD52, (B) HA-TPD52 del aa 111–130, (C) HA-TPD52 aa 40–184 for 72 h and then treated with either vehicle (DMSO) or 2 µg/ml BFA (BFA) for 5 h, stained with GM130 (green), HA-TPD52 (red), and PLIN2 (blue). Enlarged images of white boxed regions show (A) co-localised HA-TPD52 and GM130 (DMSO), or co-localised HA-TPD52 and PLIN2 (BFA 5 h); (B) lack of colocalisation between HA-TPD52 del 111–130 aa and GM130, or PLIN2; (C) colocalisation between HA-TPD52 40–184 aa and PLIN2 in both DMSO and BFA treated cells. Other PLIN2- and TPD52-positive ring structures are indicated by white arrows. Images are representative of those obtained in 3 independent experiments. Scale bar = 10 μm.

References

    1. Pol A, Gross SP, Parton RG. Review: biogenesis of the multifunctional lipid droplet: lipids, proteins, and sites. The Journal of cell biology. 2014;204:635–646. doi: 10.1083/jcb.201311051. - DOI - PMC - PubMed
    1. Walther TC, Farese RV., Jr. Lipid droplets and cellular lipid metabolism. Annual review of biochemistry. 2012;81:687–714. doi: 10.1146/annurev-biochem-061009-102430. - DOI - PMC - PubMed
    1. Farese RV, Jr., Walther TC. Lipid droplets finally get a little R-E-S-P-E-C-T. Cell. 2009;139:855–860. doi: 10.1016/j.cell.2009.11.005. - DOI - PMC - PubMed
    1. Gross DA, Silver DL. Cytosolic lipid droplets: from mechanisms of fat storage to disease. Crit Rev Biochem Mol Biol. 2014;49:304–326. doi: 10.3109/10409238.2014.931337. - DOI - PubMed
    1. Wilfling F, Haas JT, Walther TC, Farese RV., Jr. Lipid droplet biogenesis. Current opinion in cell biology. 2014;29:39–45. doi: 10.1016/j.ceb.2014.03.008. - DOI - PMC - PubMed

Publication types