. 2019 Jul 5;9(1):9789.
doi: 10.1038/s41598-019-46201-z.

Engineering multi-layered tissue constructs using acoustic levitation

Affiliations

Engineering multi-layered tissue constructs using acoustic levitation

Angela Tait et al. Sci Rep. .

Abstract

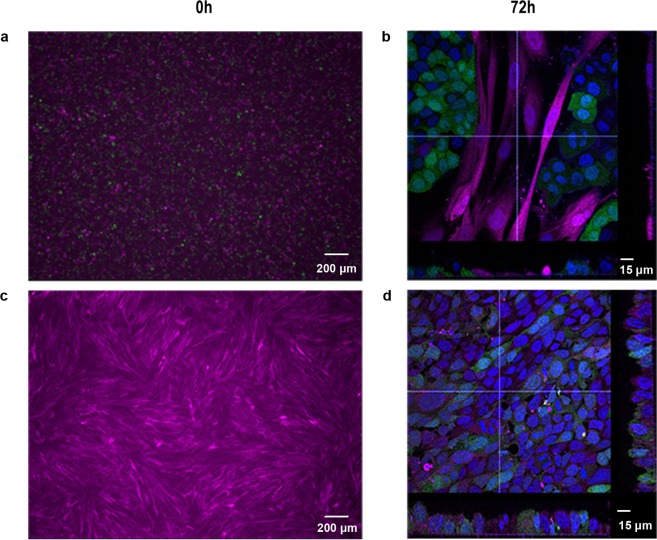
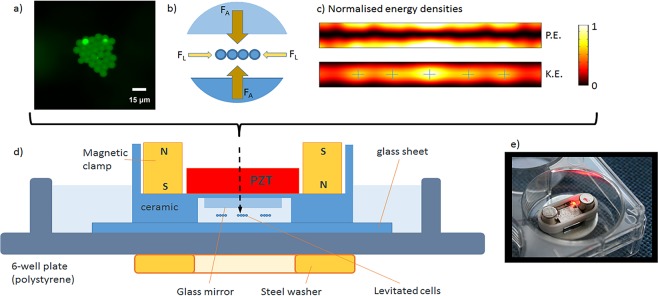
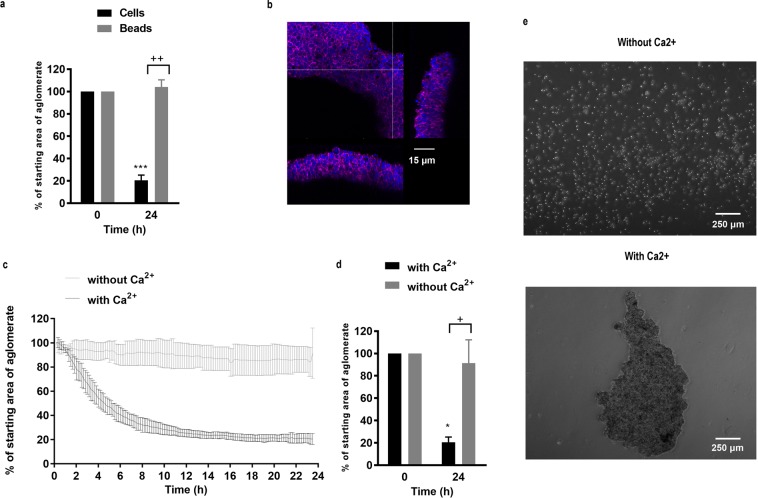
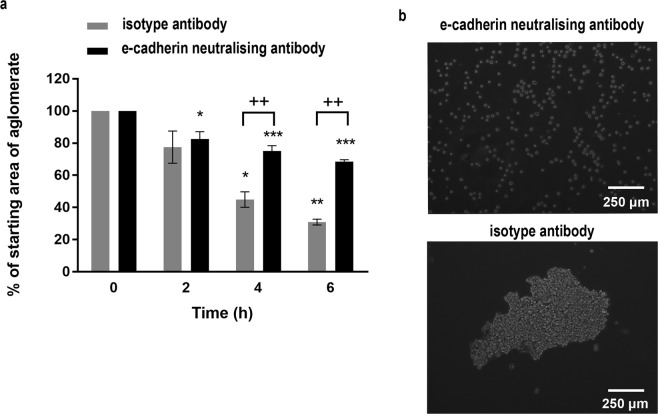
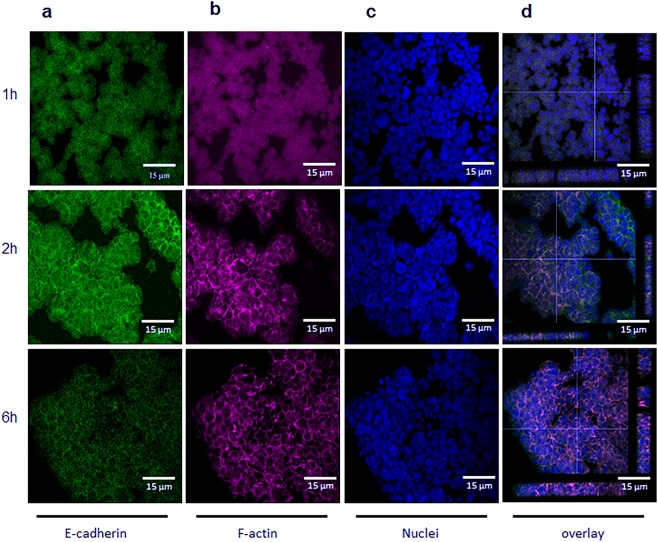
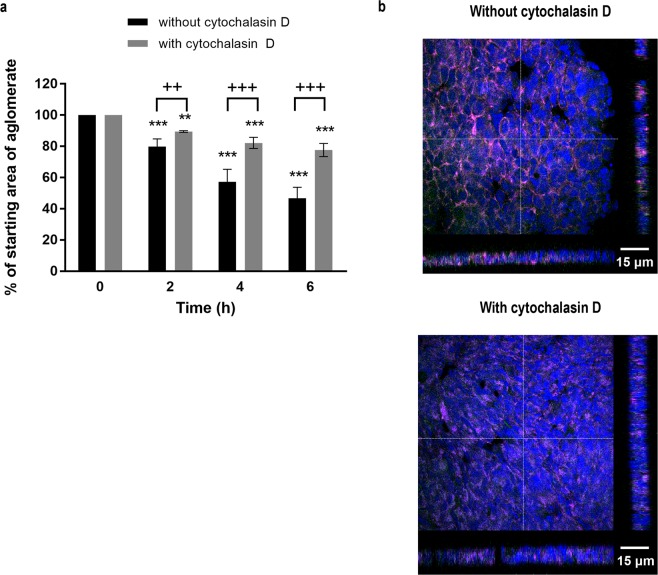
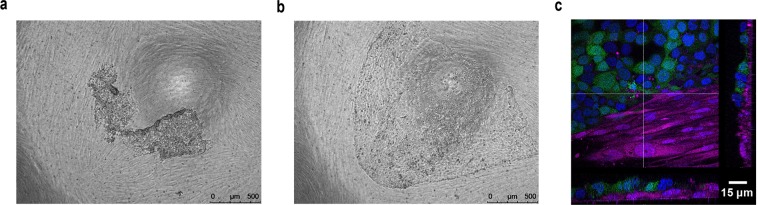
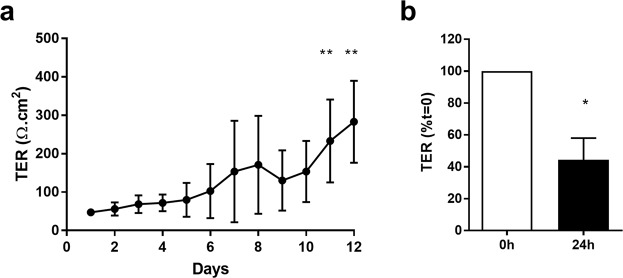
Engineering tissue structures that mimic those found in vivo remains a challenge for modern biology. We demonstrate a new technique for engineering composite structures of cells comprising layers of heterogeneous cell types. An acoustofluidic bioreactor is used to assemble epithelial cells into a sheet-like structure. On transferring these cell sheets to a confluent layer of fibroblasts, the epithelial cells cover the fibroblast surface by collective migration maintaining distinct epithelial and fibroblast cell layers. The collective behaviour of the epithelium is dependent on the formation of cell-cell junctions during levitation and contrasts with the behaviour of mono-dispersed epithelial cells where cell-matrix interactions dominate and hinder formation of discrete cell layers. The multilayered tissue model is shown to form a polarised epithelial barrier and respond to apical challenge. The method is useful for engineering a wide range of layered tissue types and mechanistic studies on collective cell migration.


Conflict of interest statement

The authors declare no competing interests.

Figures

Figure 1
Figure 1
Co-culture of monodisperse epithelial cells with fibroblasts results in a random distribution of the two cell types. (a,b) A single cell suspension of epithelial cells (GFP-16HBE cells (green)) was mixed with a single cell suspension of fibroblasts (DsRed-MRC5 cells (magenta)); the images show the cells at 0 h (a) and after 72 h (b) of culture. (c,d) A confluent layer of DsRed MRC5 cells was established (c) prior to addition of a single cell suspension of GFP-16HBE cells and culture for 72 h. (d) Nuclei are labelled with DAPI (blue). Scale bar either 200 μm (a,c) or 15 μm (b,d).
Figure 2
Figure 2
Design of the acoustic levitation device for preparation of epithelial cell sheets. The transducer creates an acoustic resonance in the medium-filled cavity beneath the mirror. Cells or microspheres are suspended in the centre plane of the cavity, scale bar is 15 μm and image taken by PGJ. (a) Acoustic forces are strongest in the axial direction (FA), with a weaker lateral component (FL) bringing cells together and forming an epithelial cell sheet. (b) Modelling of the acoustic field, confirms that there is a pressure nodal plane (zero potential energy density – P.E.) corresponding to the levitation plane, within which, there are local maxima (marked with cross-hairs) in the kinetic energy density (K.E.) at which the mono-layer aggregates are formed. (c) Representative schematic diagram (d) and image of device (e). Not to scale.
Figure 3
Figure 3
Epithelial cell behaviour in the acoustic bioreactor. Monodisperse suspensions of 10 µm polystyrene beads (a) or 16HBE cells (ae) were introduced into the acoustic bioreactor and levitated for 24 h in the absence (c-e as indicated) or presence of Ca2+ (a–e as indicated); images were captured by time lapse microscopy and the resultant agglomerates were analysed and expressed as % of starting area (i.e. normalised to t = 0 h). Data are mean ± SD, n = 3 (a,c,d) or are representative images obtained by fluorescent microscopy for F-actin (magenta) and nuclei (blue) (b) or phase-contrast microscopy (e) (n = 3) of cells after levitation and removal from the bioreactor. Scale bars are 15 µm (b) and 250 µm (e) respectively. ***P ≤ 0.001 for comparison between 0 and 24 h and ++P ≤ 0.01 and +++P ≤ 0.001 at 24 h compared to beads (a) or without calcium (d) (two-way ANOVA with Sidak’s correction for multiple comparisons).
Figure 4
Figure 4
The effect of an E-cadherin neutralising antibody on formation of stable epithelial cell sheets. A single cell suspension of 16HBE cells was introduced into the acoustic bioreactor in the presence of a neutralising antibody to E-cadherin or isotype control and the size of the agglomerate area determined every 10 min for 6 h. Data are mean ± SD (a) or representative phase-contrast photomicrographs of the cell sheets after removal from the bioreactor following levitation for 6 h (b), n = 3. Scale bar is 250 μm. **P ≤ 0.01, ***P ≤ 0.001 compared to 0 h and +++P ≤ 0.001 compared to E-cadherin neutralising antibody (two-way ANOVA with Sidak’s correction for multiple comparisons).
Figure 5
Figure 5
Formation of adherens junctions following levitation of epithelial cells. Representative fluorescent photomicrographs for E-cadherin (a, green), F-actin (b; magenta) or nuclei (c; blue) in epithelial cells after levitation within the bioreactor for 1, 2 or 6 h, as indicated (ac); panel (d) shows a composite Z stack image for staining of a typical agglomerate at each time point. Scale bars are 15 µm and images are representative of 3 aggregates.
Figure 6
Figure 6
The effect of cytochalasin D on formation of epithelial cell sheets. A single cell suspension of 16HBE cells was introduced into the acoustic bioreactor in the absence or presence of cytochalasin D (2 μg/ml), and the size of the agglomerate area determined every 10 min for 6 h. (a) After 6 h, the cell sheets were removed from the acoustic bioreactor and E-cadherin (green), F-actin (magenta) or nuclei (blue) stained and visualised using fluorescent microscopy. (b) Data are mean ± SD (n = 4) (a) or representative Z stack images of aggregates obtained after levitation for 6 h in the absence or presence of cytochalasin D, as indicated (b), scale bar is 15 μm. **P ≤ 0.01, ***P ≤ 0.001 compared to control of t = 0 and +P ≤ 0.05 and +++P ≤ 0.001 compared to cytochalasin D (two-way ANOVA with Sidak’s correction for multiple comparisons).
Figure 7
Figure 7
Formation of a multi-layered tissue construct with defined epithelial cell and fibroblast cell layers. A single cell suspension of GFP-16HBE cells was levitated for 2 h in the acoustic bioreactor to allow formation of an epithelial cell sheet with adherens junctions. The epithelial cell sheet was then removed from the bioreactor and placed on top of a confluent layer of DsRed-fibroblasts. (a) After 3 days of co-culture the epithelial cell sheet had grown as a sheet and not penetrated the fibroblast layer. (b,c) Results are representative phase-contrast photomicrographs at 0 h (a) or 72 h (b,c) where 16HBE cells (green), fibroblasts (magenta) or nuclei (blue) are visualised and displayed as a composite Z-stack image. (c) Scale bars are 500 μm (a,b) or 15 μm (c). n = 2.
Figure 8
Figure 8
Functional analysis of the multi-layered airway construct. Establishment of an electrically tight epithelial sheet above the fibroblast layer was monitored daily by assessment of transepithelial electrical resistance (TER) (a); following formation of polarised tissue constructs (day 12), they were challenged with a viral mimetic, poly(I:C) (1 μg/ml) and effects on ionic permeability determined by monitoring TER. (b) Results are shown as means ± SD, n = 3–4 of TER readings expressed as Ω.cm2 (a) or % t = 0. (b) **P ≤ 0.01, compared to day 1 (Kruskal-Wallis with Dunn’s correction for multiple comparisons) and +P ≤ 0.05 compared to t = 0 (paired two-tailed Student’s t-test).

Similar articles

Cited by

References

    1. Marchiando AM, Graham WV, Turner JR. Epithelial barriers in homeostasis and disease. Annu Rev Pathol. 2010;5:119–144. doi: 10.1146/annurev.pathol.4.110807.092135. - DOI - PubMed
    1. Evans MJ, Van Winkle LS, Fanucchi MV, Plopper CG. The attenuated fibroblast sheath of the respiratory tract epithelial-mesenchymal trophic unit. Am J Respir Cell Mol Biol. 1999;21:655–657. doi: 10.1165/ajrcmb.21.6.3807. - DOI - PubMed
    1. Davies DE. The role of the epithelium in airway remodeling in asthma. Proc Am Thorac Soc. 2009;6:678–682. doi: 10.1513/pats.200907-067DP. - DOI - PMC - PubMed
    1. Jeffery PK, Wardlaw AJ, Nelson FC, Collins JV, Kay AB. Bronchial biopsies in asthma. An ultrastructural, quantitative study and correlation with hyperreactivity. Am Rev Respir Dis. 1989;140:1745–1753. doi: 10.1164/ajrccm/140.6.1745. - DOI - PubMed
    1. Xiao C, et al. Defective epithelial barrier function in asthma. J Allergy Clin Immun. 2011;128:549–U177. doi: 10.1016/j.jaci.2011.05.038. - DOI - PubMed

Publication types