

Antibiotic drug-resistance as a complex system driven by socio-economic growth and antibiotic misuse
- PMID: 31278344
- PMCID: PMC6611849
- DOI: 10.1038/s41598-019-46078-y
Antibiotic drug-resistance as a complex system driven by socio-economic growth and antibiotic misuse
Erratum in
-
Author Correction: Antibiotic drug-resistance as a complex system driven by socio-economic growth and antibiotic misuse.Sci Rep. 2019 Oct 18;9(1):15184. doi: 10.1038/s41598-019-50846-1. Sci Rep. 2019. PMID: 31628370 Free PMC article.
Abstract
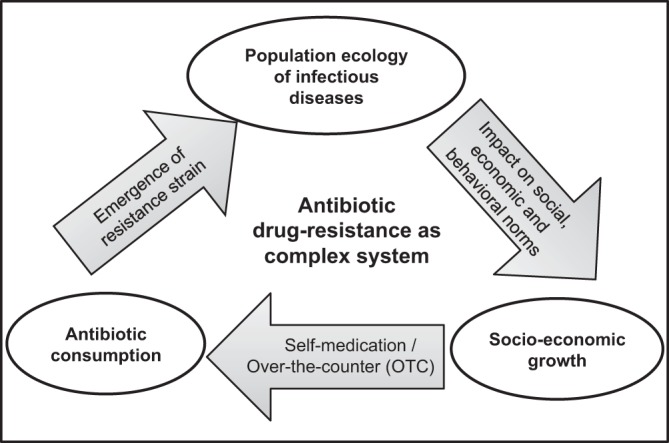
Overwhelming antibiotic use poses a serious challenge today to the public-health policymakers worldwide. Many empirical studies pointed out this ever-increasing antibiotic consumption as primary driver of the community-acquired antibiotic drug-resistance, especially in the middle- and lower-income countries. The association is well documented across spatio-temporal gradients in many parts of the world, but there is rarely any study that emphasizes the mechanism of the association, which is important for combating drug-resistance. Formulating a mathematical model of emergence and transmission of drug-resistance, we in this paper, present how amalgamating three components: socio-economic growth, population ecology of infectious disease, and antibiotic misuse can instinctively incite proliferation of resistance in the society. We show that combined impact of economy, infections, and self-medication yield synergistic interactions through feedbacks on each other, presenting the emergence of drug-resistance as a self-reinforcing cycle in the population. Analysis of our model not only determines the threshold of antibiotic use beyond which the emergence of resistance may occur, but also characterizes how fast it develops depending on economic growth, and lack of education and awareness of the population. Our model illustrates that proper and timely government aid in population health can break the self-reinforcing process and reduce the burden of drug-resistance in the community.
Conflict of interest statement
The authors declare no competing interests.
Figures


References
-
- Laxminarayan R, et al. Antibiotic resistance: the need for global solutions. Lancet Infect Dis. 2013;13(12):1057–1098. - PubMed
-
- Oneil, J. Review on antimicrobial resistance. Antimicrobial resistance: Tackling a crisis for the health and wealth of nations 2014 (2014).
-
- Banga, J. M., Dube, S. & Munyanduki, H. Prevalence and drug resistance in bacteria of the urinary tract infections in bulawayo province, zimbabwe. East Afr J Public Health7(3) (2010). - PubMed
Publication types
LinkOut - more resources
Full Text Sources
Molecular Biology Databases
