

Age and Sex Influence the Hippocampal Response and Recovery Following Sepsis
- PMID: 31278440
- PMCID: PMC6834928
- DOI: 10.1007/s12035-019-01681-y
Age and Sex Influence the Hippocampal Response and Recovery Following Sepsis
Abstract
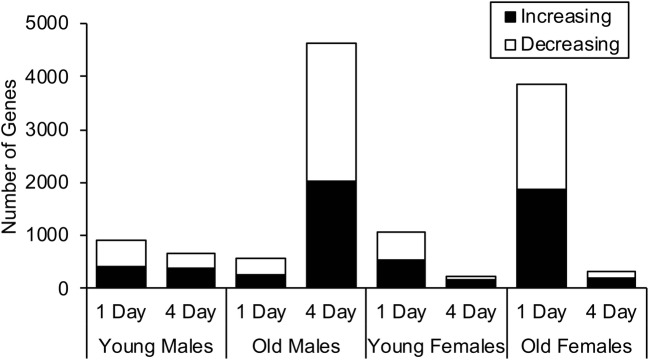
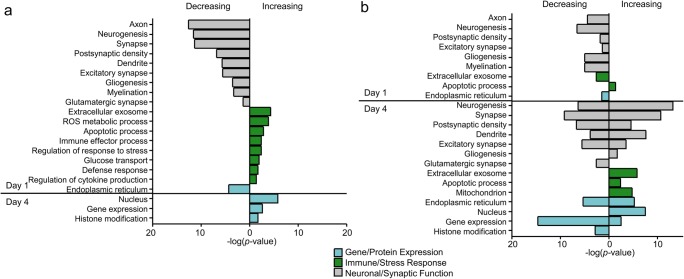
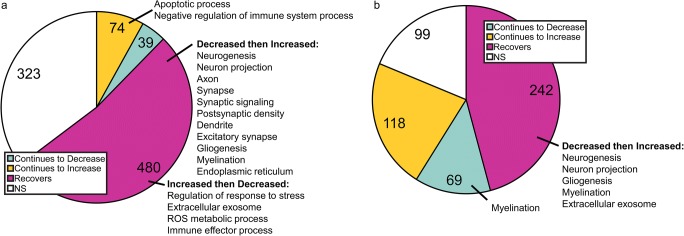
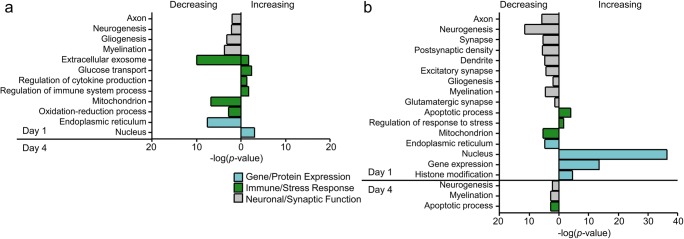
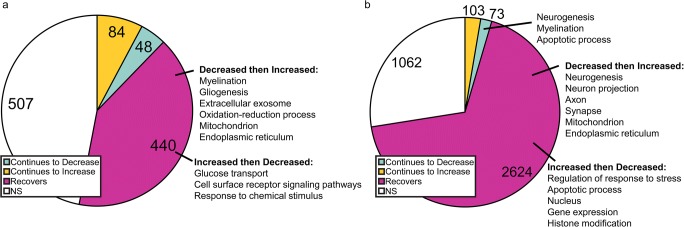
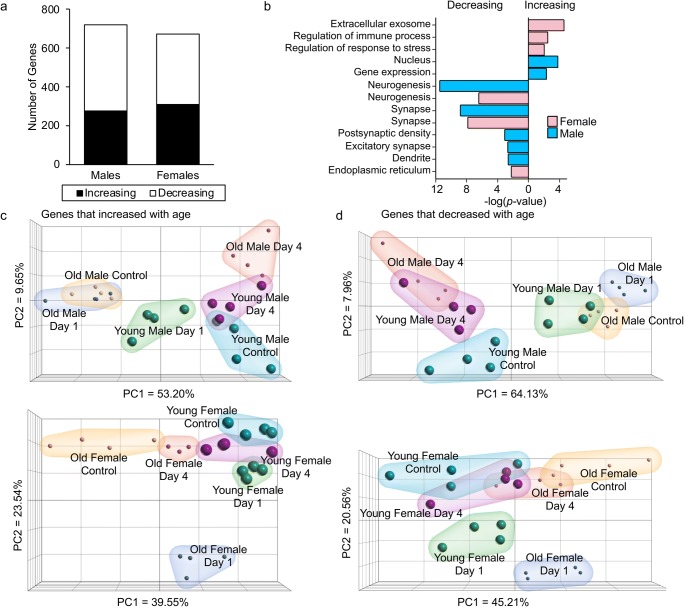
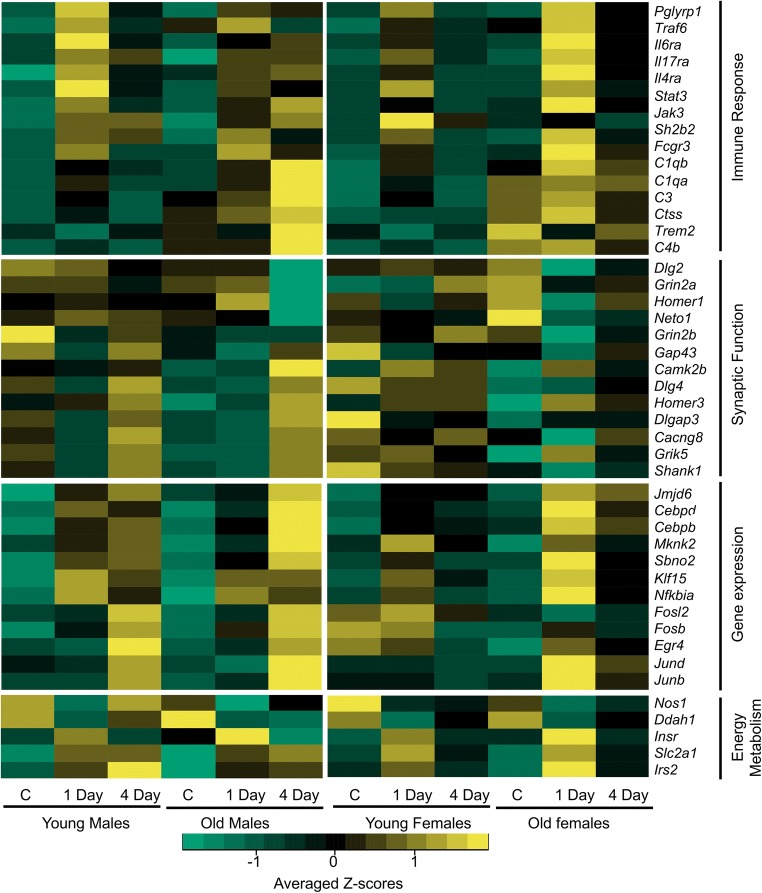
Although in-hospital mortality rates for sepsis have decreased, survivors often experience lasting physical and cognitive deficits. Moreover, older adults are more vulnerable to long-term complications associated with sepsis. We employed a murine model to examine the influence of age and sex on the brain's response and recovery following sepsis. Young (~ 4 months) and old (~ 20 months) mice (C57BL/6) of both sexes underwent cecal ligation and puncture (CLP) with restraint stress. The hippocampal transcriptome was examined in age- and sex-matched controls at 1 and 4 days post-CLP. In general, immune- and stress-related genes increased, while neuronal, synaptic, and glial genes decreased 1 day after CLP-induced sepsis. However, specific age and sex differences were observed for the initial responsiveness to sepsis as well as the rate of recovery examined on day 4. Young females exhibited a muted transcriptional response relative to young males and old females. Old females exhibited a robust shift in gene transcription on day 1, and while most genes recovered, genes linked to neurogenesis and myelination continued to be downregulated by day 4. In contrast, old males exhibited a more delayed or prolonged response to sepsis, such that neuronal and synaptic genes continued to decrease while immune response genes continued to increase on day 4. These results suggest that aging is associated with delayed recovery from sepsis, which is particularly evident in males.
Keywords: Aging; Cecal ligation and puncture; Hippocampus; Mice; Sepsis; Transcriptome.
Figures
Similar articles
-
Influence of age and sex on microRNA response and recovery in the hippocampus following sepsis.Aging (Albany NY). 2022 Jan 30;14(2):728-746. doi: 10.18632/aging.203868. Epub 2022 Jan 30. Aging (Albany NY). 2022. PMID: 35094981 Free PMC article.
-
Sex differences associate with late microbiome alterations after murine surgical sepsis.J Trauma Acute Care Surg. 2022 Aug 1;93(2):137-146. doi: 10.1097/TA.0000000000003599. Epub 2022 Mar 24. J Trauma Acute Care Surg. 2022. PMID: 35324554 Free PMC article.
-
Old Mice Demonstrate Organ Dysfunction as well as Prolonged Inflammation, Immunosuppression, and Weight Loss in a Modified Surgical Sepsis Model.Crit Care Med. 2019 Nov;47(11):e919-e929. doi: 10.1097/CCM.0000000000003926. Crit Care Med. 2019. PMID: 31389840 Free PMC article.
-
Deficiency of alpha-calcitonin gene-related peptide induces inflammatory responses and lethality in sepsis.Cytokine. 2013 Nov;64(2):548-54. doi: 10.1016/j.cyto.2013.07.030. Epub 2013 Sep 8. Cytokine. 2013. PMID: 24021706
-
Inhalation of hydrogen gas attenuates brain injury in mice with cecal ligation and puncture via inhibiting neuroinflammation, oxidative stress and neuronal apoptosis.Brain Res. 2014 Nov 17;1589:78-92. doi: 10.1016/j.brainres.2014.09.030. Epub 2014 Sep 22. Brain Res. 2014. PMID: 25251596
Cited by
-
Dysregulated Immunity and Immunotherapy after Sepsis.J Clin Med. 2021 Apr 17;10(8):1742. doi: 10.3390/jcm10081742. J Clin Med. 2021. PMID: 33920518 Free PMC article. Review.
-
Sepsis and Cognitive Assessment.J Clin Med. 2021 Sep 20;10(18):4269. doi: 10.3390/jcm10184269. J Clin Med. 2021. PMID: 34575380 Free PMC article. Review.
-
Association of Peripheral Arterial Occlusive Disease and Deep Venous Thrombosis with Risk of Consequent Sepsis Event: A Retrospective Population-Based Cohort Study.Int J Environ Res Public Health. 2022 May 31;19(11):6710. doi: 10.3390/ijerph19116710. Int J Environ Res Public Health. 2022. PMID: 35682294 Free PMC article.
-
Current Understanding of Long-Term Cognitive Impairment After Sepsis.Front Immunol. 2022 May 6;13:855006. doi: 10.3389/fimmu.2022.855006. eCollection 2022. Front Immunol. 2022. PMID: 35603184 Free PMC article. Review.
-
Retinal response to systemic inflammation differs between sexes and neurons.Front Immunol. 2024 Feb 7;15:1340013. doi: 10.3389/fimmu.2024.1340013. eCollection 2024. Front Immunol. 2024. PMID: 38384465 Free PMC article.
References
-
- Gentile LF, Nacionales DC, Lopez MC, Vanzant E, Cuenca A, Cuenca AG, Ungaro R, Szpila BE, Larson S, Joseph A, Moore FA, Leeuwenburgh C, Baker HV, Moldawer LL, Efron PA. Protective immunity and defects in the neonatal and elderly immune response to sepsis. J Immunol. 2014;192(7):3156–3165. doi: 10.4049/jimmunol.1301726. - DOI - PMC - PubMed
-
- Horiguchi H, Loftus TJ, Hawkins RB, Raymond SL, Stortz JA, Hollen MK, Weiss BP, Miller ES, Bihorac A, Larson SD, Mohr AM, Brakenridge SC, Tsujimoto H, Ueno H, Moore FA, Moldawer LL, Efron PA, Sepsis, Critical Illness Research Center I Innate immunity in the persistent inflammation, immunosuppression, and catabolism syndrome and its implications for therapy. Front Immunol. 2018;9:595. doi: 10.3389/fimmu.2018.00595. - DOI - PMC - PubMed
-
- Mira JC, Gentile LF, Mathias BJ, Efron PA, Brakenridge SC, Mohr AM, Moore FA, Moldawer LL. Sepsis pathophysiology, chronic critical illness, and persistent inflammation-immunosuppression and catabolism syndrome. Crit Care Med. 2017;45(2):253–262. doi: 10.1097/CCM.0000000000002074. - DOI - PMC - PubMed
MeSH terms
Substances
Grants and funding
- R01AG037984/National Institutes of Health (US)
- R01 AG052258/AG/NIA NIH HHS/United States
- R01 GM113945/GM/NIGMS NIH HHS/United States
- R37AG03680/National Institutes of Health (US)
- R01AG052258/National Institutes of Health (US)
- R01AG049711/NH/NIH HHS/United States
- T32 GM008721/GM/NIGMS NIH HHS/United States
- P30 AG028740/AG/NIA NIH HHS/United States
- T32 GM-008721/National Institutes of Health (US)
- R01GM113945/National Institutes of Health (US)
- R01 AG037984/AG/NIA NIH HHS/United States
- P50GM111152/National Institutes of Health (US)
- P50 GM111152/GM/NIGMS NIH HHS/United States
- R01 AG049711/AG/NIA NIH HHS/United States
LinkOut - more resources
Full Text Sources
Medical
Molecular Biology Databases
Miscellaneous
