. 2019 Oct;144(4):1074-1090.
doi: 10.1016/j.jaci.2019.06.028. Epub 2019 Jul 3.

Mammalian diaphanous-related formin 1 (mDia1) coordinates mast cell migration and secretion through its actin-nucleating activity

Affiliations

Mammalian diaphanous-related formin 1 (mDia1) coordinates mast cell migration and secretion through its actin-nucleating activity

Ofir Klein et al. J Allergy Clin Immunol. 2019 Oct.

Abstract

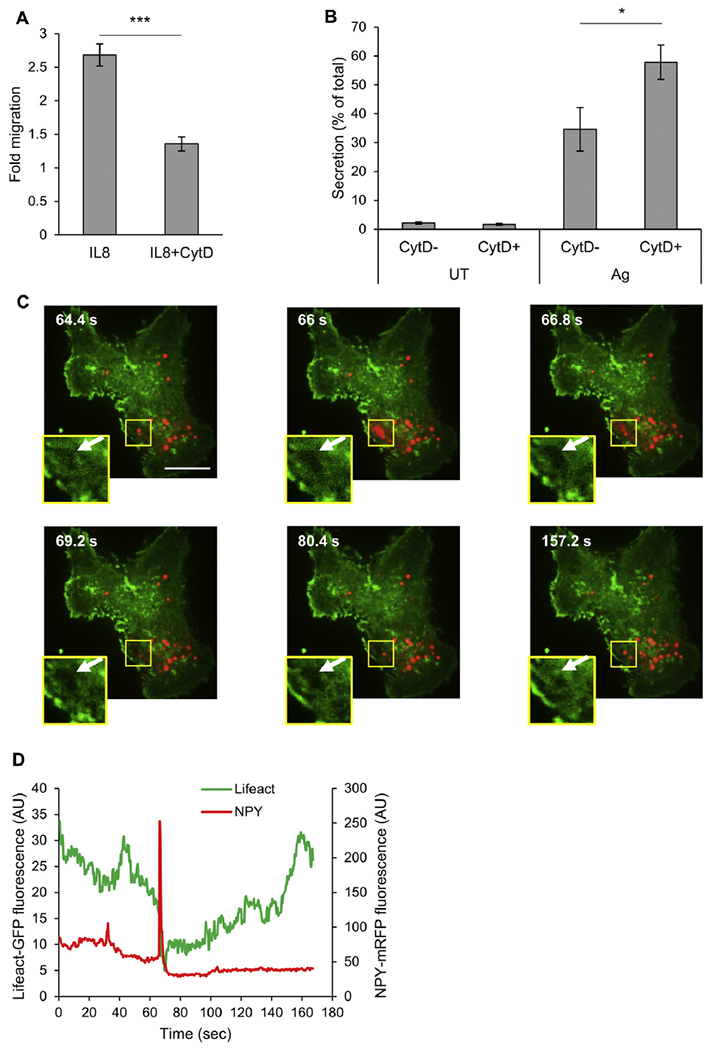
Background: Actin remodeling is a key regulator of mast cell (MC) migration and secretion. However, the precise mechanism underlying the coordination of these processes has remained obscure.

Objective: We sought to characterize the actin rearrangements that occur during MC secretion or chemotactic migration and identify the underlying mechanism of their coordination.

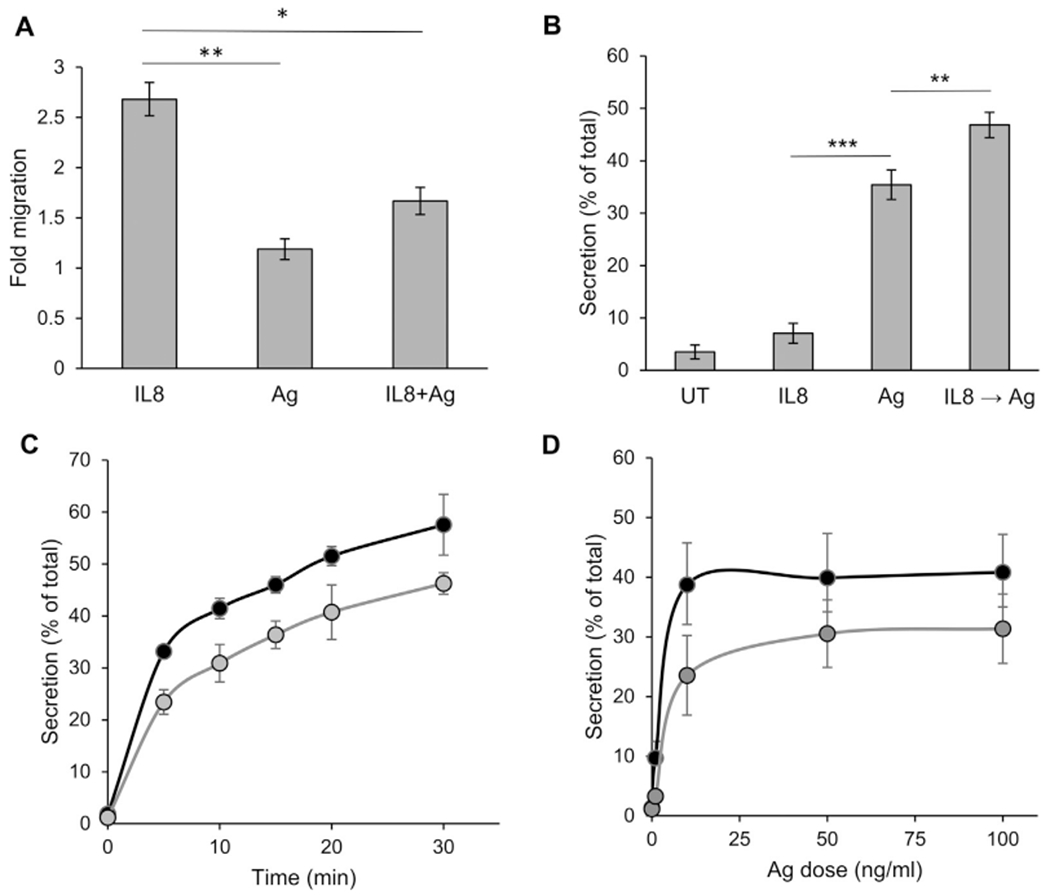
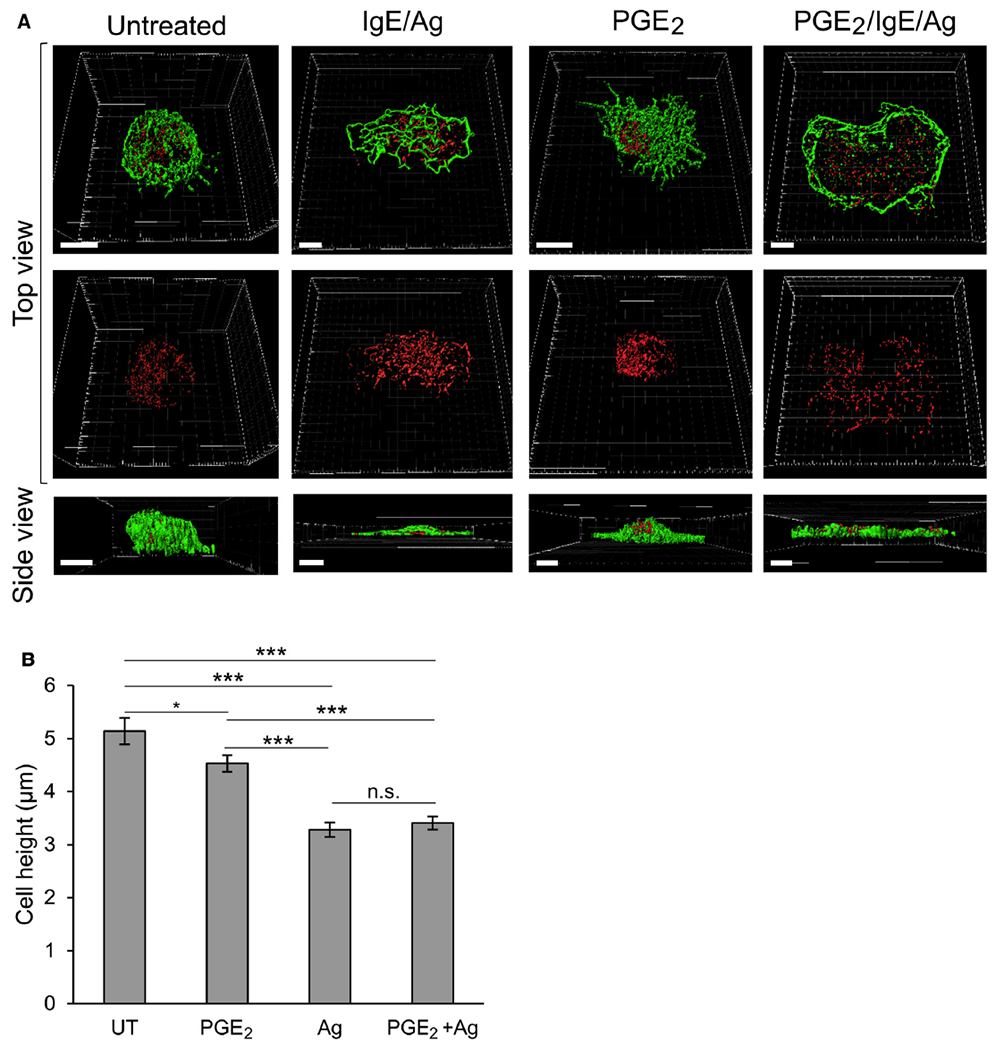
Methods: Using high-resolution microscopy, we analyzed the dynamics of actin rearrangements in MCs triggered to migration by IL-8 or prostaglandin E2 or to FcεRI-stimulated secretion.

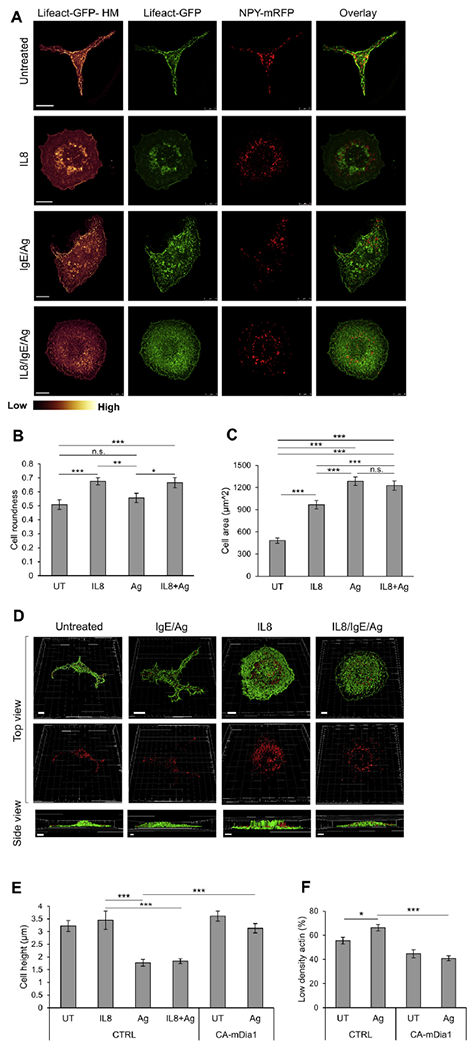
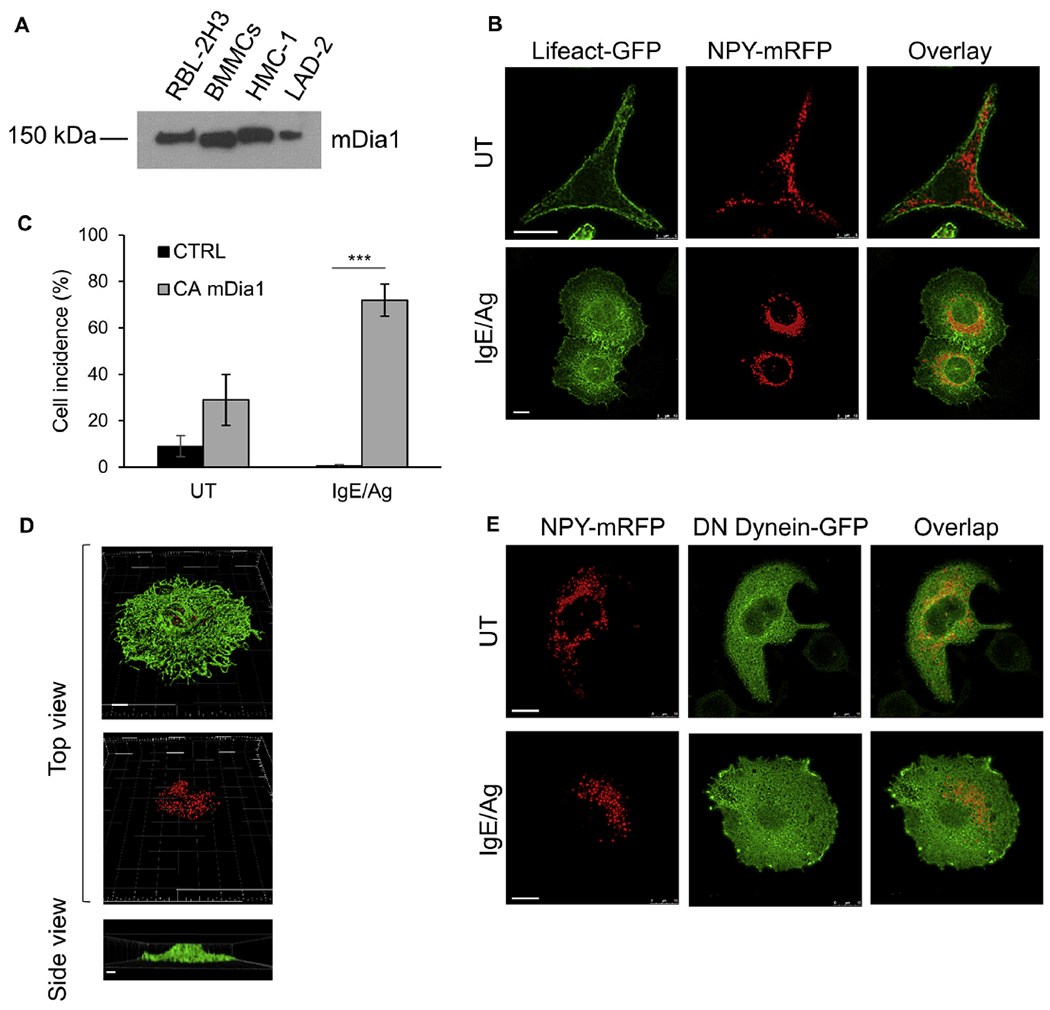
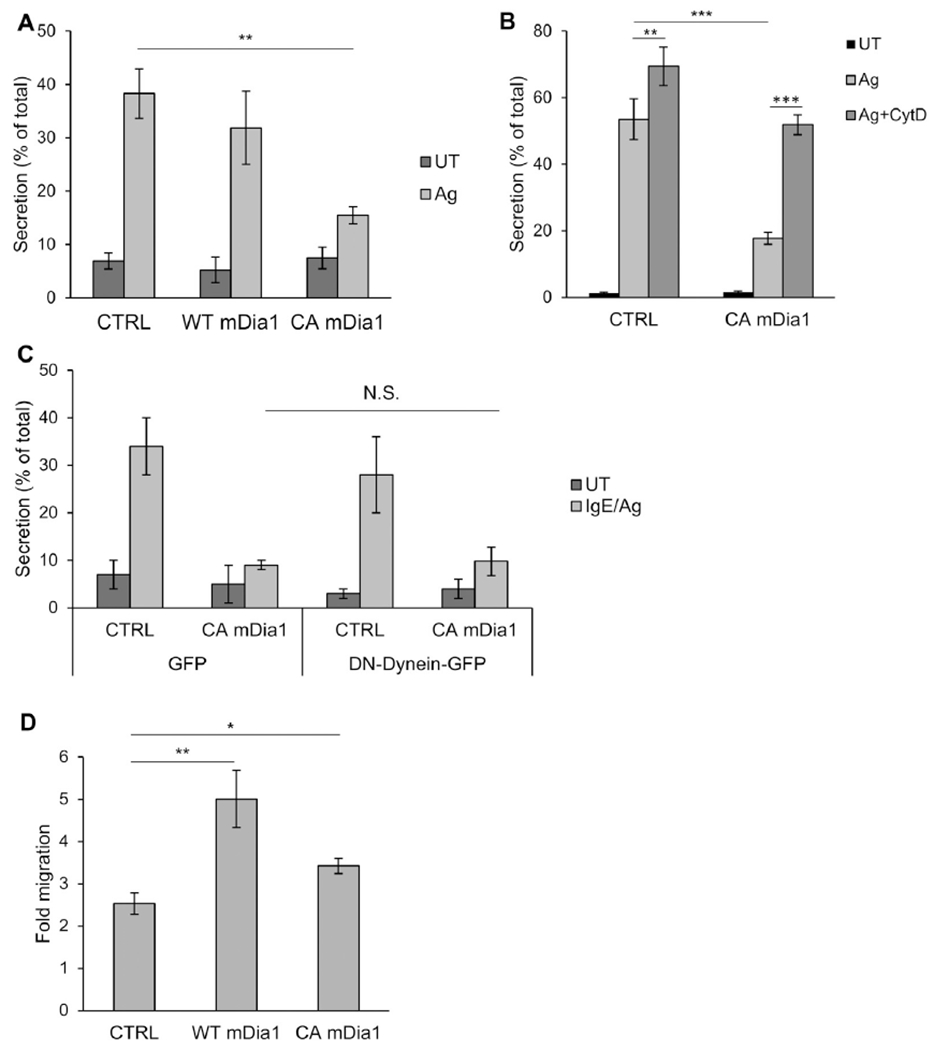
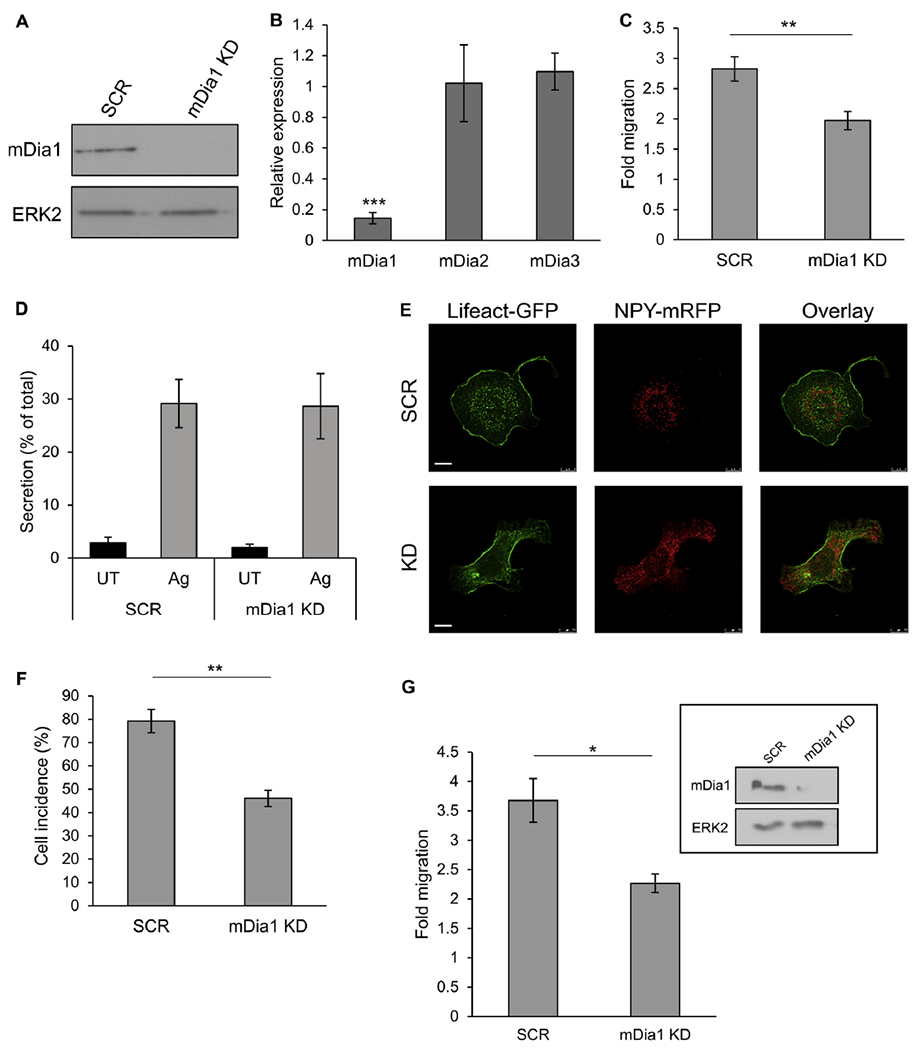
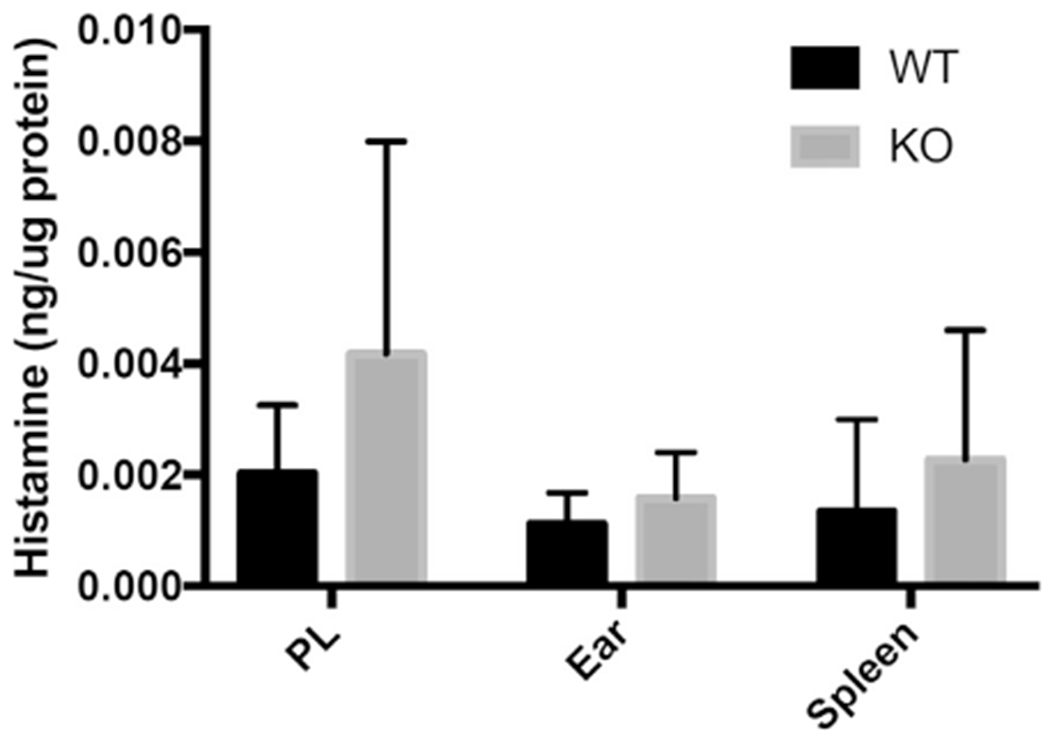
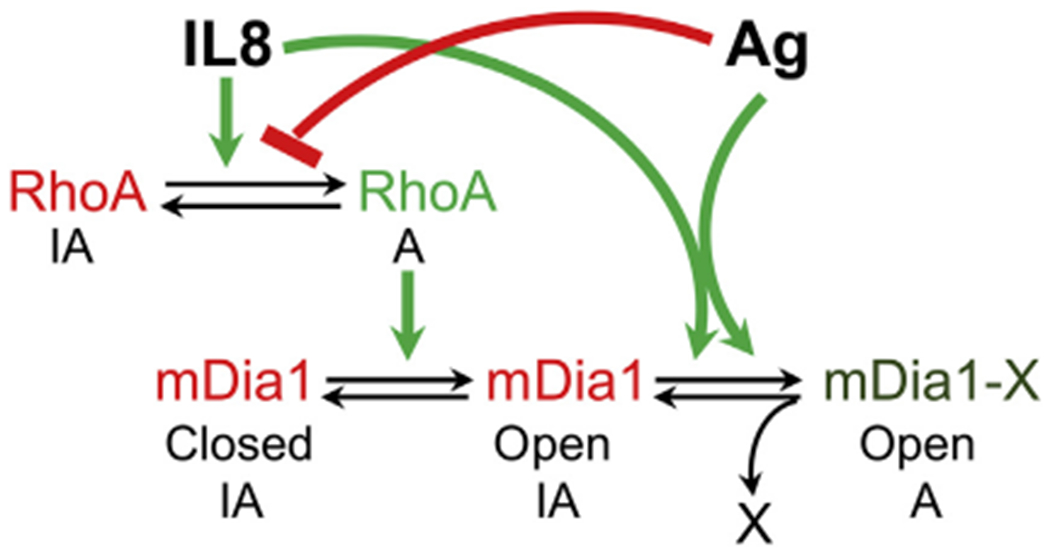
Results: We show that a major feature of the actin skeleton in MCs stimulated to migration is the buildup of pericentral actin clusters that prevent cell flattening and converge the secretory granules (SGs) in the cell center. This migratory phenotype is replaced on encounter of an IgE cross-linking antigen that stimulates secretion through a secretory phenotype characterized by cell flattening, reduction of actin mesh density, ruffling of cortical actin, and mobilization of SGs. Furthermore, we show that knockdown of mammalian diaphanous-related formin 1 (mDia1) inhibits chemotactic migration and its typical actin rearrangements, whereas expression of an active mDia1 mutant recapitulates the migratory actin phenotype and enhances cell migration while inhibiting FcεRI-triggered secretion. However, mice deficient in mDia1 appear to have normal numbers of MCs in various organs at baseline.

Conclusion: Our results demonstrate a unique role of actin rearrangements in clustering the SGs and inhibiting their secretion during MC migration. We identify mDia1 as a novel regulator of MC response that coordinates MC chemotaxis and secretion through its actin-nucleating activity.

Keywords: Mast cells; actin; chemotaxis; exocytosis; mammalian diaphanous-related formin 1.


Conflict of interest statement

Disclosure of potential conflict of interest: The authors declare that they have no relevant conflicts of interest.

Figures

FIG 1.
FIG 1.
RBL-CXCR1 cells migrate in response to IL-8 and degranulate in response to IgE/antigen (IgE/Ag). A, Chemotactic migration of RBL-CXCR1 cells sensitized with 0.25 μg/mL DNP-specific IgE was assayed, as described in the Methods section, in response to 50 ng/mL IL-8, 50 ng/mL DNP-HSA (Ag), or both, as indicated. Stimulated migration was calculated relative to migration of untreated cells. Results are means ± SEMs of 5 separate experiments. *P = 2.89E-2 and **P = 5.84E-3. B, RBL-CXCR1 cells sensitized with 0.25 μg/mL DNP-specific IgE were either left untreated (UT) or triggered for 30 minutes with 50 ng/mL IL-8,50 ng/mL DNP-HSA (Ag), or 50 ng/mL IL-8,followed by a further 30 minutes of incubation with 50 ng/mL DNP-HSA (IL8 → Ag), as indicated. β-Hexosaminidase secretion was determined as described in the Methods section and is presented as a percentage of total cellular activity. Results are means ± SEMs of 8 separate experiments. **P = 8E-3 and ***P = 8.38E-7. C and D, RBL (black circles) and RBL-CXCR1 (gray circles) cells were sensitized with 0.25 μg/mL IgE and activated with 50 ng/mL DNP-HSA for the indicated time periods or for 30 minutes with the indicated concentrations of DNP-HSA. Results are means ± SEMs of 3 separate experiments.
FIG 2.
FIG 2.
Actin depolymerization inhibits migration but stimulates secretion. A, Chemotactic migration of RBL-CXCR1 cells was assayed in response to 50 ng/mL IL-8 in the absence or presence of 10 μmol/L CytD, as indicated. Results are means ± SEMs of 5 separate experiments. ***P = 9.57E-3. B, RBL-CXCR1 cells were sensitized with 0.25 μg/mL IgE and activated by 50 ng/mL DNP-HSA (Ag) in the absence or presence of 10 μmol/L CytD, as indicated. β-Hexosaminidase secretion was measured. Results are means ± SEMs of 6 separate experiments. *P = 3.6E-2. C, RBL-CXCR1 cells were cotransfected with 15 μg of LifeAct-GFP (green) and 15 μg of NPY-mRFP (red), sensitized with 0.25 μg/mL IgE, and activated by 50 ng/mL DNP-HSA. Cells were imaged in real time by means of TIRF microscopy, as described in the Methods section. Insets are magnifications of the boxed areas. Arrows point to the “exit spot” at which actin is depolymerized to allow SG exocytosis. D, Quantification of fluorescent signals in the boxed areas as a function of time of trigger.
FIG 3.
FIG 3.
Characterization of the actin meshwork, cell height, and SG distribution under migratory and secretory conditions. A, RBL-CXCR1 cells were transiently cotransfected with 10 μg of LifeAct-GFP (green) and 15 μg of NPY-mRFP (red) sensitized with 0.25 μg/mL IgE and either left untreated (UT) or triggered for 30 minutes with 50 ng/mL IL-8, 50 ng/mL DNP-HSA (IgE/Ag), or IL-8 followed by DNP-HSA (IL8/IgE/Ag), as indicated. Cells were processed for microscopy, as described in the Methods section, and imaged with a Leica SP5 confocal microscope. LifeAct-GFP fluorescence is also presented as heat maps (Lifeact-HM). Scale bars = 10 μm. B, Cell roundness (range, 0-1) was calculated by tracing the cells’ footprints and using the roundness measurement parameter in ImageJ software. *P = .034, **P = .007, and ***P ≤ 3E-3 (n ≥ 20 for each treatment from at least 3 different experiments). C, Cell area was calculated by tracing the cells’ footprints and using the area measurement parameter in ImageJ software. ***P≤3E-3 (n ≥ 20 for each treatment from at least 3 different experiments). D, Confocal images were 3-dimensionally reconstructed by using Imaris software. Scale bars = 5 μm. E, Quantification of the average cell height derived from 3-dimensional images of cells transfected with 30 mg of either empty vector (CTRL) or CA mDia1, as indicated. Cells were either left untreated (UT) or triggered for 30 minutes with IL-8, IgE/antigen, or IL-8 followed by antigen. ***P< 8.4E-4 (n = 15 cells for each treatment). F, Quantification of LifeAct-GFP fluorescence in RBL-CXCR1 cells cotransfected with LifeAct-GFP and either empty vector (CTRL) or CA mDia1, as in Fig 3, E. Cells were IgE sensitized with 0.25 μg/mL IgE and either left untreated (UT) or activated for 30 minutes by 50 ng/mL DNP-HSA (Ag), as indicated. Cells were imaged at the footprint with a Leica SP5 confocal microscope. The LifeAct-GFP signal was classified as low or high according to a uniform threshold and quantified as the percentage of cell area with low/high-density actin per cell. Quantification is based on 9 (UT) to 25 cells derived from 3 separate experiments. *P = 1.23E-2 and ***P = 3.23E-7. n.s., Not significant.
FIG 4.
FIG 4.
Three-dimensional characterization of BMMCs, cell height, and SG distribution under migratory and secretory conditions. A, BMMCs were sensitized with 0.25 μg/mL IgE and either left untreated (UT) or triggered for 30 minutes with 100 nmol/L PGE2, 50 ng/mL DNP-HSA (IgE/Ag), or PGE2, followed by DNP-HSA, as indicated. Cells were stained with anti-syntaxin 3 antibodies and Alexa Fluor 647 phalloidin and processed for microscopy, as described in the Methods section. Images were taken with a Leica SP5 confocal microscope and 3-dimensionally reconstructed by using Imaris software. Scale bars = 5 μm. B, Quantification o average cell height derived from the 3-dimensional images of BMMCs that were either left untreated (UT) or triggered for 30 minutes with PGE2, IgE/antigen, or PGE2 followed by antigen. *P< .04 and ***P < 1.57E-7 (n ≥46 cells for each treatment). n.s., Not significant.
FIG 5.
FIG 5.
mDia1 enforces a migratory actin phenotype. A, Expression of mDia1 was determined by resolving lysates (100 μg) derived from naive RBL cells, BMMCs, HMC-1 cells, and LAD2 cells by means of SDS-PAGE and immunoblotting with anti-mDia1 antibodies. B, RBL-CXCR1 cells cotransfected with 30 μg of CAmDia1, 10 μg of LifeAct-GFP (green), and 15 μg of NPY-mRFP (red) were IgE sensitized and either left untreated (UT) or activated with 50 ng/mL DNP-HSA (IgE/Ag) for 30 minutes. Cells were processed for confocal microscopy and imaged with a Leica SP5 confocal microscope. Scale bars = 10 μm. C, Incidence of cells displaying converged SGs was calculated based on images of cells that were cotransfected with LifeAct-GFP, NPY-mRFP, and either empty vector (CTRL) or CA mDia1 and either left untreated (UT) or activated with IgE/antigen as in Fig 5, B. Quantification is based on 63 cells for each treatment derived from 3 separate experiments. ***P < .001. D, Images of cells transfected and activated were 3-dimensionally constructed by using Imaris software. Scale bars = 5 μm. E, RBL-CXCR1 cells were cotransfected with 20 μg of CA mDia1, 30 μg of p150glued-CC1-GFP (green), and 10 μg of NPY-mRFP (red) and sensitized with 0.25 μg/mL IgE. Cells were subsequently left untreated (UT) or activated with 50 ng/mL DNP-HSA for 30 minutes (IgE/Ag). Cells were processed for confocal microscopy and imaged with a Leica SP5 confocal microscope. Scale bars = 10 μm.
FIG 6.
FIG 6.
CA mDia1 stimulates migration and inhibits secretion. A, RBL-CXCR1 cells cotransfected with 10 μg of NPY-mRFP and 20 μg of either empty vector (CTRL) or WT or CAmDia1 and sensitized with IgE and were either left untreated (UT) or activated with 50 ng/mLDNP-HSA for 30 minutes (IgE/Ag). NPY-mRFP secretion was measured. Results are means ± SEMs of 4 separate experiments. **P = 2E-3. B, RBL-CXCR1 cells transfected and IgE sensitized as in Fig 6, A, were either left untreated (UT) or pretreated with vehicle or 10 μmol/L CytD for 15 minutes and then activated with 50 ng/mL DNP-HSA for 30 minutes, as indicated. Cells were assayed for NPY-mRFP secretion. Results are means ± SEMs of 3 separate experiments **P = 6.02E-3 and ***P ≤ 6.2E-4. C, RBL-CXCR1 cells were cotransfected with 15 μg of NPY-mRFP and 20 μg of either empty vector and 30 μg of GFP, CA mDia1 and GFP, empty vector and p150glued-CC1-GFP, or CA mDia1 and p150glued-CC1-GFP, as indicated. Cells were IgE sensitized and either left untreated (UT) or activated with 50 ng/ml DNP-HSA for 30 minutes (IgE/Ag). NPY-mRFP secretion was assayed. Results are mean ± SEMs of 3 separate experiments. N.S., Not significant. D, RBL-CXCR1 cells were cotransfected with 10 μg of LifeAct-GFP and 20 μg of either empty vector (CTRL), WT, or CA mDia1, as indicated. Cell migration was assayed in response to 50 ng/mL IL-8. Fold migration was calculated relative to basal migration measured in the absence of IL-8. Results are means ± SEMs of 9 separate experiments. *P = 1.26E-2 and **P = 5E-3.
FIG 7.
FIG 7.
mDia1 KD inhibits chemotactic migration and migratory actin rearrangements. A, Cell lysates (100 μg) derived from RBL-CXCR1 cells stably infected with control scrambled shRNA (SCR) or mDia1-targeting shRNA (mDia1 KD) were resolved by using SDS-PAGE and immunoblotted with anti-mDia1 antibodies. Blots were reprobed with anti-total ERK2 antibodies as protein-loading controls. A representative blot of 3 similar experiments is shown. B, Relative expression of mDia1, mDia2, and mDia3 in control and mDia1 KD RBL-CXCR1 cells was determined by using quantitative RT-PCR. Results are means ± SEMs of 3 separate experiments. ***P = 1.77E-4. C, Migration of control and mDia1 KD RBL-CXCR1 cells was assayed in response to 50 ng/mL IL-8. Fold migration was calculated relative to migration in the absence of IL-8. Results are means ± SEMs of 9 separate experiments. **P = 4E-3. D, IgE-sensitized control and mDia1 KD RBL-CXCR1 cells were either left untreated (UT) or activated with 50 ng/mL DNP-HAS for 30 minutes (Ag). Secretion of β-hexosaminidase was determined. Results are means ± SEMs of 3 separate experiments. E and F, Control and mDia1 KD RBL-CXCR1 cells were cotransfected with 10 μg of LifeAct-GFP (green) and 15 μg of NPY-mRFP (red). Cells were activated by 50 ng/mL IL-8 for 30 minutes, processed for confocal microscopy, and imaged with a Leica SP5 confocal microscope. The incidence of cells featuring central actin and pericentral clustering of the SGs was quantified based on 50 cells for each treatment derived from 3 separate experiments. **P = 7E-3. G, Migration of control and mDia1 KD BMMCs was assayed in response to 100 nmol/L PGE2. Fold migration was calculated relative to migration in the absence of PGE2. Results are means ± SEMs of 3 separate experiments. *P = .047. The inset depicts a representative blot of cell lysates (30 μg) derived from BMMCs infected with either control scrambled shRNA (SCR) or mDia1-targeting shRNA (mDia1 KD) probed with anti-mDia1 antibody and with anti–total ERK2 antibody as a protein-loading control.
FIG 8.
FIG 8.
The amount of tissue histamine is unaltered in mDia1 knockout mice: effect of a congenital deficiency of mDia1 on mouse MC numbers in various locations. WT and mDia1 knockout mice (KO) were assessed for histamine content in lysates of cells isolated from peritoneal lavage fluid (PL) and ears and spleens corrected for micrograms of protein. Values represent means ± SDs from 6 to 7 mice.
FIG 9.
FIG 9.
Model for the role of mDia1 in coordinating MC migration and secretion. According to our proposed model, MC activation by IL-8 involves activation of RhoA, which in turn binds to and relieves mDia1 from its autoinhibited state (Closed IA converted to Open IA). Another yet unknown modification is required that can be transduced by either IL-8 or FcεRI signaling to achieve full activation of mDia1 (Open IA converted to mDia1-X Open A). Through its actin-polymerizing activity, mDia1 then builds up the pericentral actin clusters that prevent cell flattening and converge the SGs, thereby inhibiting their release. When IL-8-stimulated cells are exposed to FcεRI signaling, the latter inhibits RhoA activation, thereby reverting mDia1 to its autoinhibited state. Therefore the secretory signal overrides the migratory signal, which is elicited by the chemokine receptor.

Similar articles

Cited by

References

    1. Okayama Y, Kawakami T. Development, migration, and survival of mast cells. Immunol Res 2006;34:97–116. - PMC - PubMed
    1. Mukai K, Tsai M, Starkl P, Marichal T, Galli SJ. IgE and mast cells in host defense against parasites and venoms. Semin Immunopathol 2016;38:581–603. - PMC - PubMed
    1. Chan CY, St John AL, Abraham SN. Plasticity in mast cell responses during bacterial infections. Curr Opin Microbiol 2012;15:78–84. - PMC - PubMed
    1. Mukai K, Tsai M, Saito H, Galli SJ. Mast cells as sources of cytokines, chemokines, and growth factors. Immunol Rev 2018;282:121–50. - PMC - PubMed
    1. Wernersson S, Pejler G. Mast cell secretory granules: armed for battle. Nat Rev Immunol 2014;14:478–94. - PubMed

Publication types