

Microbial differences between dental plaque and historic dental calculus are related to oral biofilm maturation stage
- PMID: 31279340
- PMCID: PMC6612086
- DOI: 10.1186/s40168-019-0717-3
Microbial differences between dental plaque and historic dental calculus are related to oral biofilm maturation stage
Abstract
Background: Dental calculus, calcified oral plaque biofilm, contains microbial and host biomolecules that can be used to study historic microbiome communities and host responses. Dental calculus does not typically accumulate as much today as historically, and clinical oral microbiome research studies focus primarily on living dental plaque biofilm. However, plaque and calculus reflect different conditions of the oral biofilm, and the differences in microbial characteristics between the sample types have not yet been systematically explored. Here, we compare the microbial profiles of modern dental plaque, modern dental calculus, and historic dental calculus to establish expected differences between these substrates.
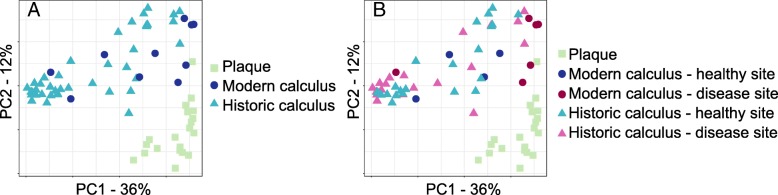
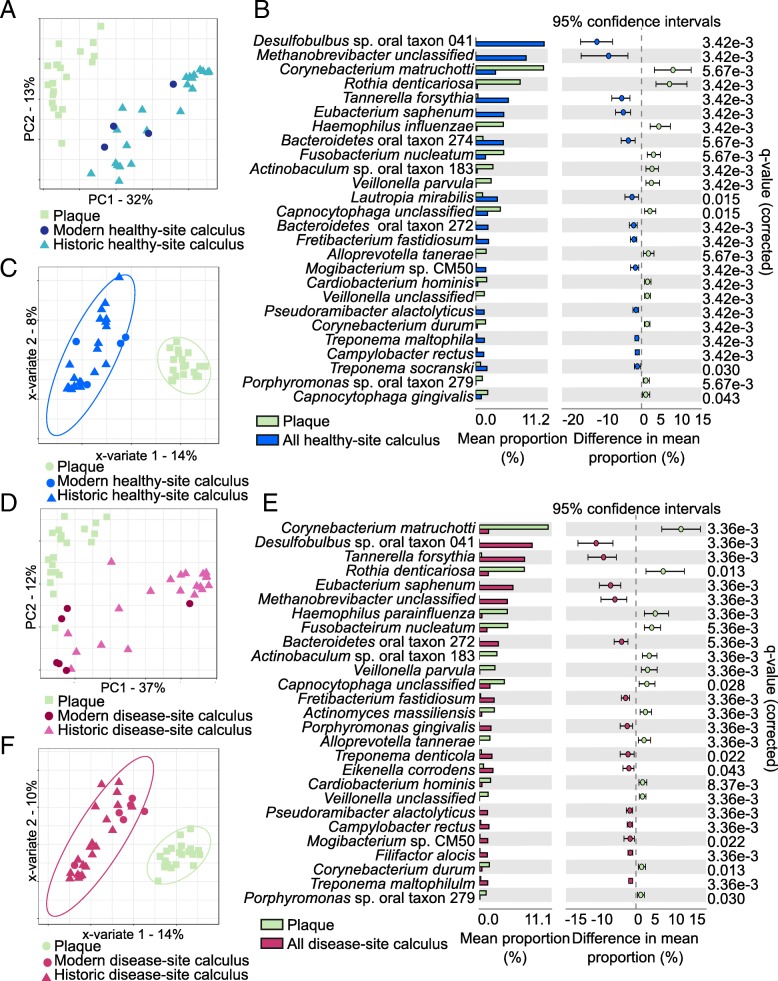
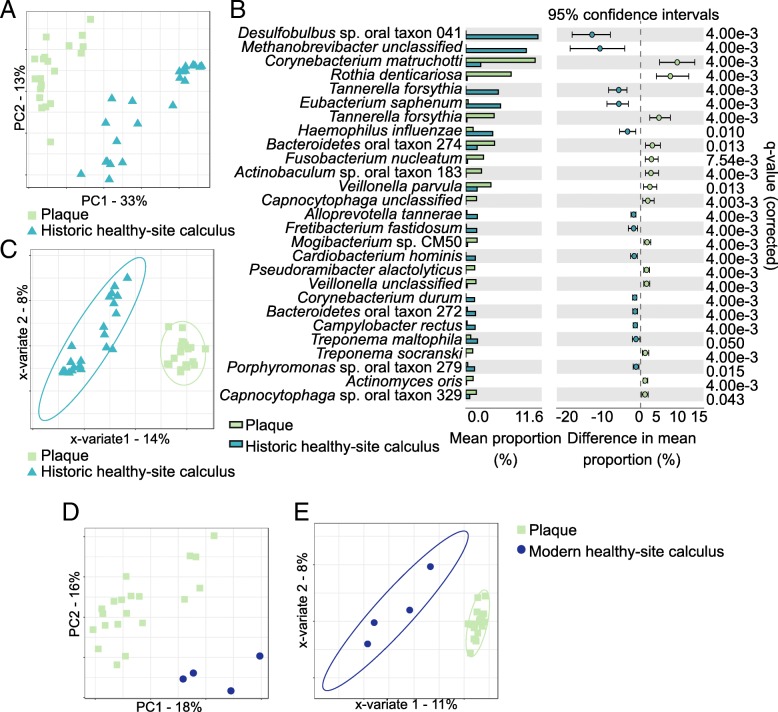
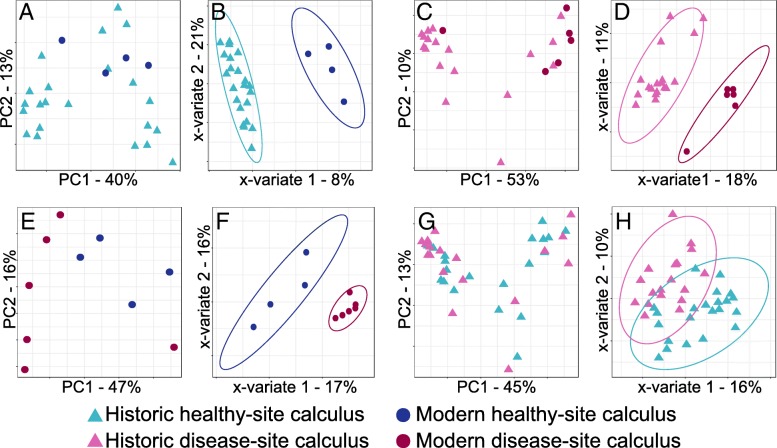
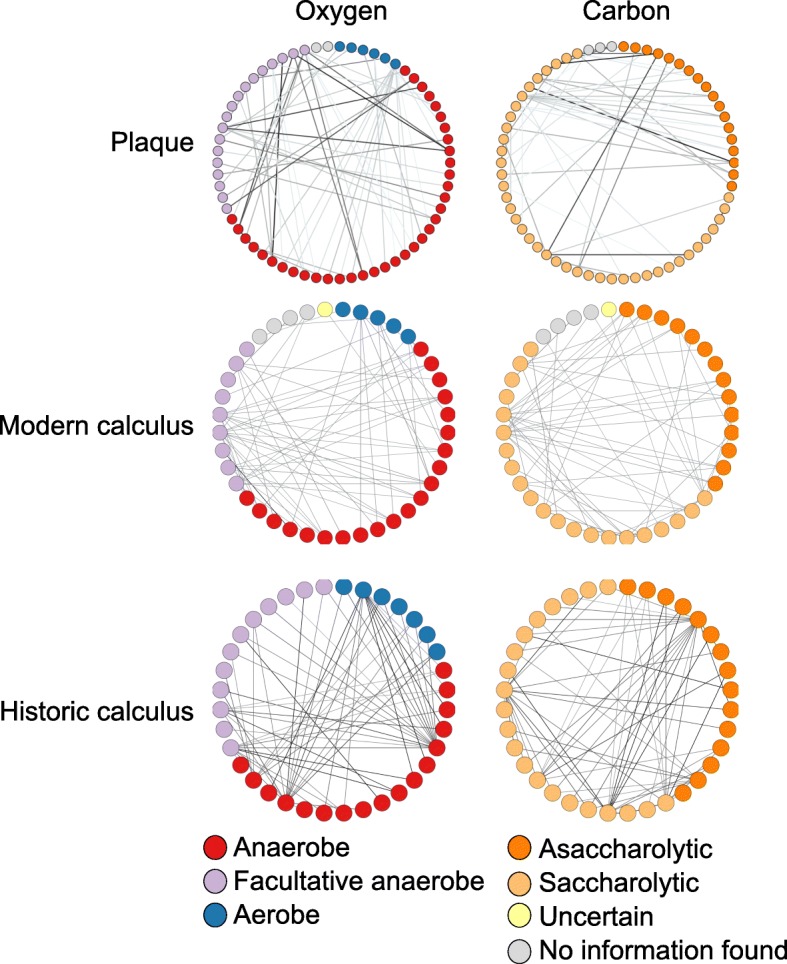
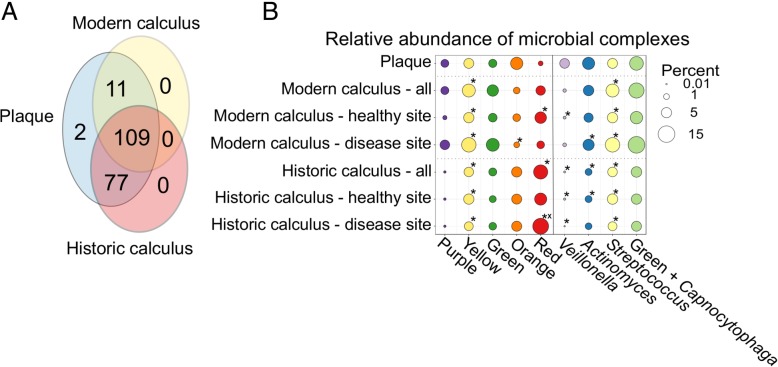
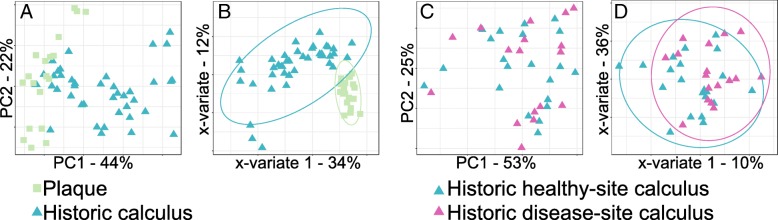
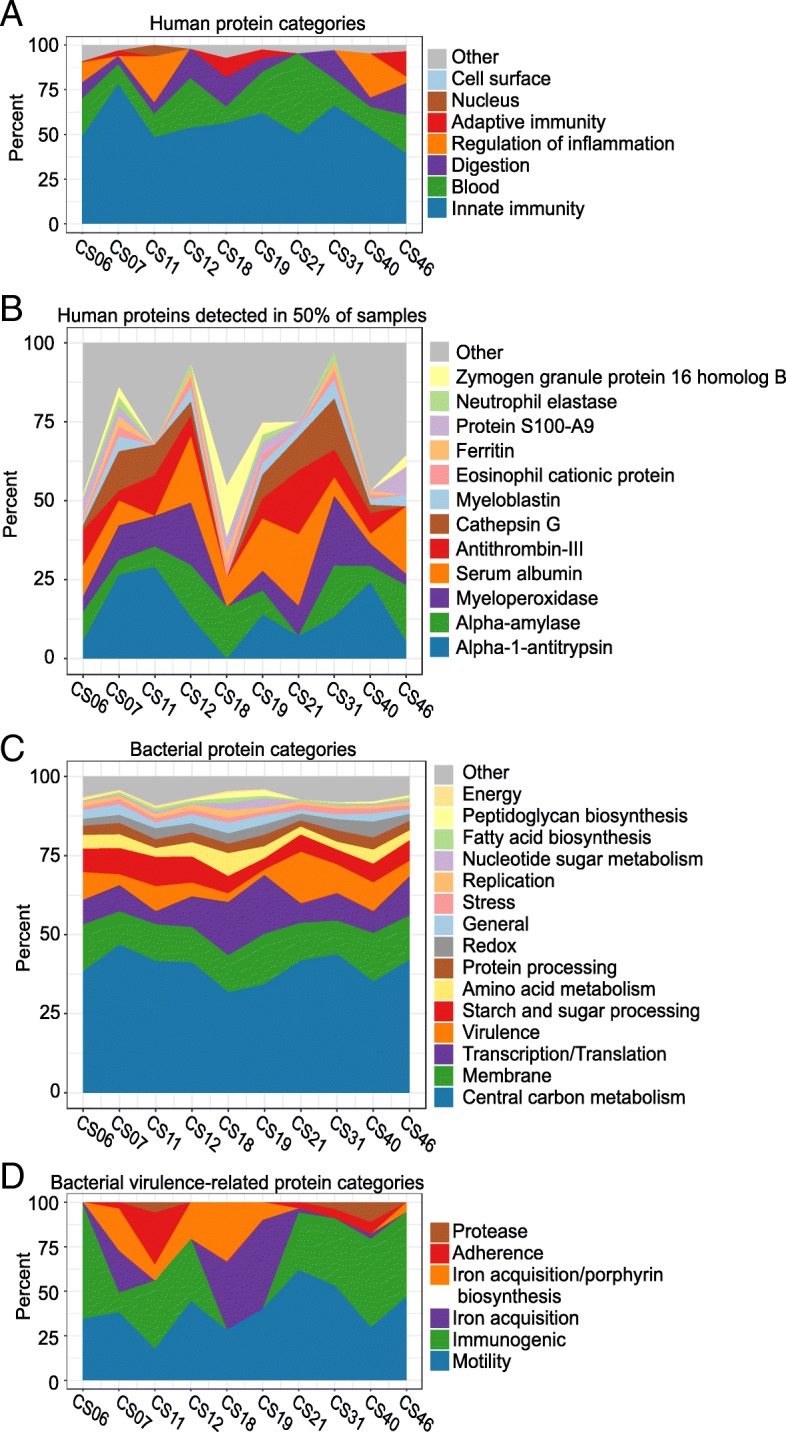
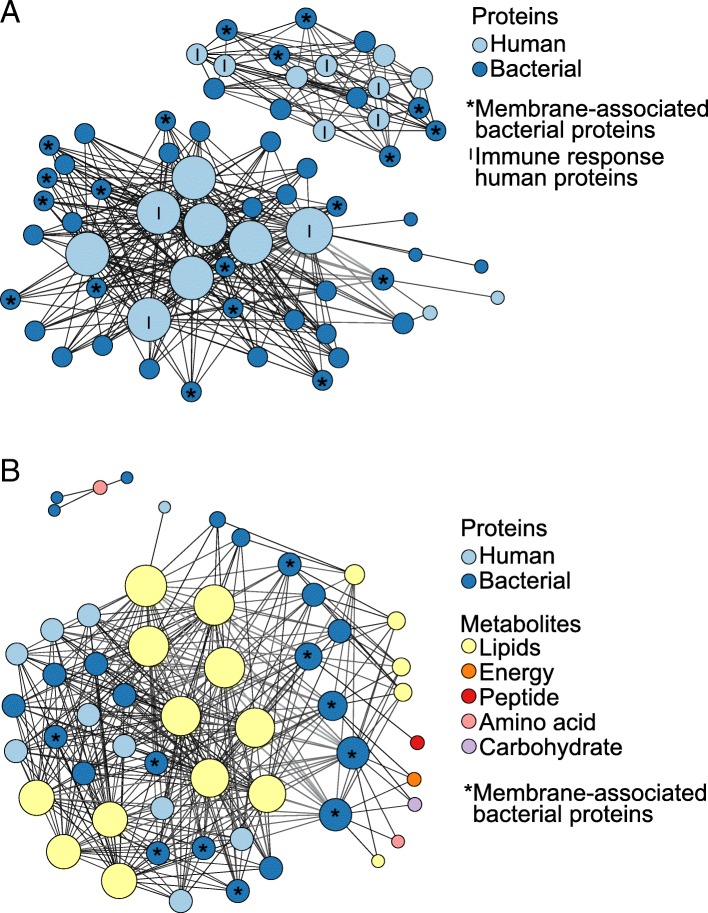
Results: Metagenomic data was generated from modern and historic calculus samples, and dental plaque metagenomic data was downloaded from the Human Microbiome Project. Microbial composition and functional profile were assessed. Metaproteomic data was obtained from a subset of historic calculus samples. Comparisons between microbial, protein, and metabolomic profiles revealed distinct taxonomic and metabolic functional profiles between plaque, modern calculus, and historic calculus, but not between calculus collected from healthy teeth and periodontal disease-affected teeth. Species co-exclusion was related to biofilm environment. Proteomic profiling revealed that healthy tooth samples contain low levels of bacterial virulence proteins and a robust innate immune response. Correlations between proteomic and metabolomic profiles suggest co-preservation of bacterial lipid membranes and membrane-associated proteins.
Conclusions: Overall, we find that there are systematic microbial differences between plaque and calculus related to biofilm physiology, and recognizing these differences is important for accurate data interpretation in studies comparing dental plaque and calculus.
Keywords: Ancient dental calculus; Metagenomics; Metaproteomics; Oral microbiome; Periodontal disease.
Conflict of interest statement
The authors declare that they have no competing interests.
Figures
Similar articles
-
The Postmedieval Latvian Oral Microbiome in the Context of Modern Dental Calculus and Modern Dental Plaque Microbial Profiles.Genes (Basel). 2021 Feb 22;12(2):309. doi: 10.3390/genes12020309. Genes (Basel). 2021. PMID: 33671794 Free PMC article.
-
Quantitative metaproteomics of medieval dental calculus reveals individual oral health status.Nat Commun. 2018 Nov 20;9(1):4744. doi: 10.1038/s41467-018-07148-3. Nat Commun. 2018. PMID: 30459334 Free PMC article.
-
Functional diversity of microbial ecologies estimated from ancient human coprolites and dental calculus.Philos Trans R Soc Lond B Biol Sci. 2020 Nov 23;375(1812):20190586. doi: 10.1098/rstb.2019.0586. Epub 2020 Oct 5. Philos Trans R Soc Lond B Biol Sci. 2020. PMID: 33012230 Free PMC article.
-
Dental Calculus and the Evolution of the Human Oral Microbiome.J Calif Dent Assoc. 2016 Jul;44(7):411-20. J Calif Dent Assoc. 2016. PMID: 27514153 Review.
-
Dental calculus: recent insights into occurrence, formation, prevention, removal and oral health effects of supragingival and subgingival deposits.Eur J Oral Sci. 1997 Oct;105(5 Pt 2):508-22. doi: 10.1111/j.1600-0722.1997.tb00238.x. Eur J Oral Sci. 1997. PMID: 9395117 Review.
Cited by
-
Quorum Sensing in Oral Biofilms: Influence on Host Cells.Microorganisms. 2023 Jun 28;11(7):1688. doi: 10.3390/microorganisms11071688. Microorganisms. 2023. PMID: 37512861 Free PMC article. Review.
-
Metagenomics of the modern and historical human oral microbiome with phylogenetic studies on Streptococcus mutans and Streptococcus sobrinus.Philos Trans R Soc Lond B Biol Sci. 2020 Nov 23;375(1812):20190573. doi: 10.1098/rstb.2019.0573. Epub 2020 Oct 5. Philos Trans R Soc Lond B Biol Sci. 2020. PMID: 33012228 Free PMC article.
-
Bioarchaeological and paleogenomic profiling of the unusual Neolithic burial from Grotta di Pietra Sant'Angelo (Calabria, Italy).Sci Rep. 2023 Jul 24;13(1):11978. doi: 10.1038/s41598-023-39250-y. Sci Rep. 2023. PMID: 37488251 Free PMC article.
-
Comparison of Periodontal Bacteria of Edo and Modern Periods Using Novel Diagnostic Approach for Periodontitis With Micro-CT.Front Cell Infect Microbiol. 2021 Sep 20;11:723821. doi: 10.3389/fcimb.2021.723821. eCollection 2021. Front Cell Infect Microbiol. 2021. PMID: 34616690 Free PMC article.
-
Level of Agreement Between Plaque Detection with Clinical Assessment and Assessment on Intraoral Scanner.Dent J (Basel). 2024 Dec 5;12(12):395. doi: 10.3390/dj12120395. Dent J (Basel). 2024. PMID: 39727452 Free PMC article.
References
Publication types
MeSH terms
Substances
LinkOut - more resources
Full Text Sources
