. 2019 Aug 8;75(3):631-643.e8.
doi: 10.1016/j.molcel.2019.06.006. Epub 2019 Jul 3.

Identification of the m6Am Methyltransferase PCIF1 Reveals the Location and Functions of m6Am in the Transcriptome

Affiliations

Identification of the m6Am Methyltransferase PCIF1 Reveals the Location and Functions of m6Am in the Transcriptome

Konstantinos Boulias et al. Mol Cell. .

Abstract

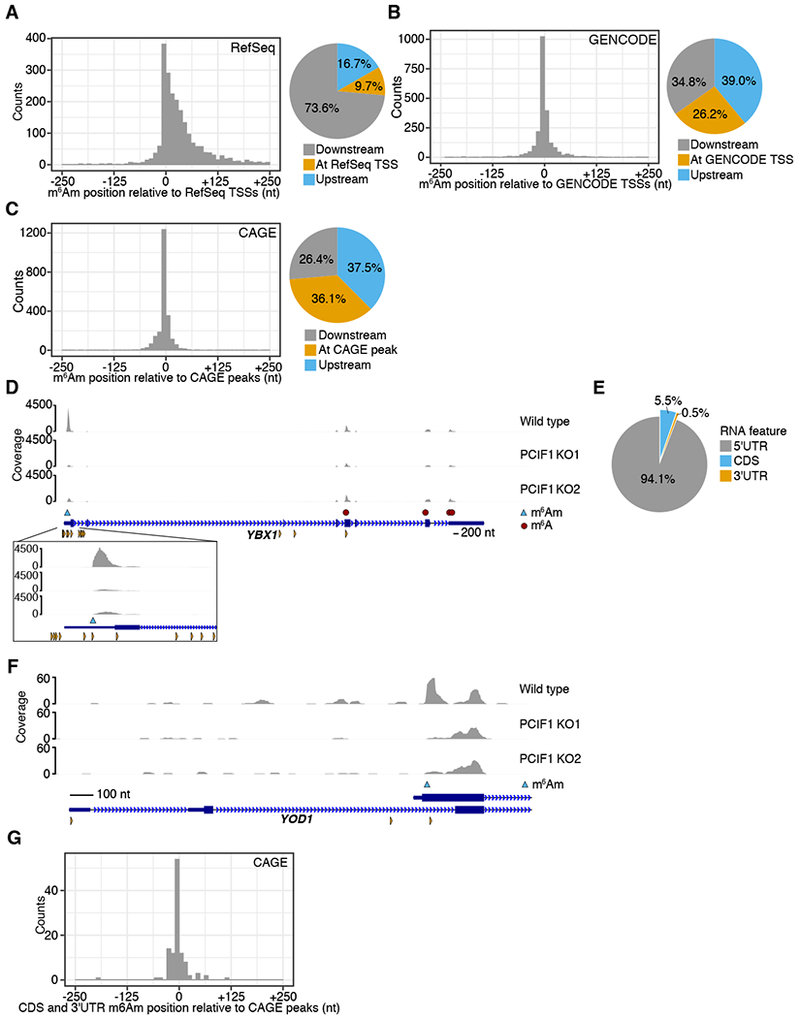
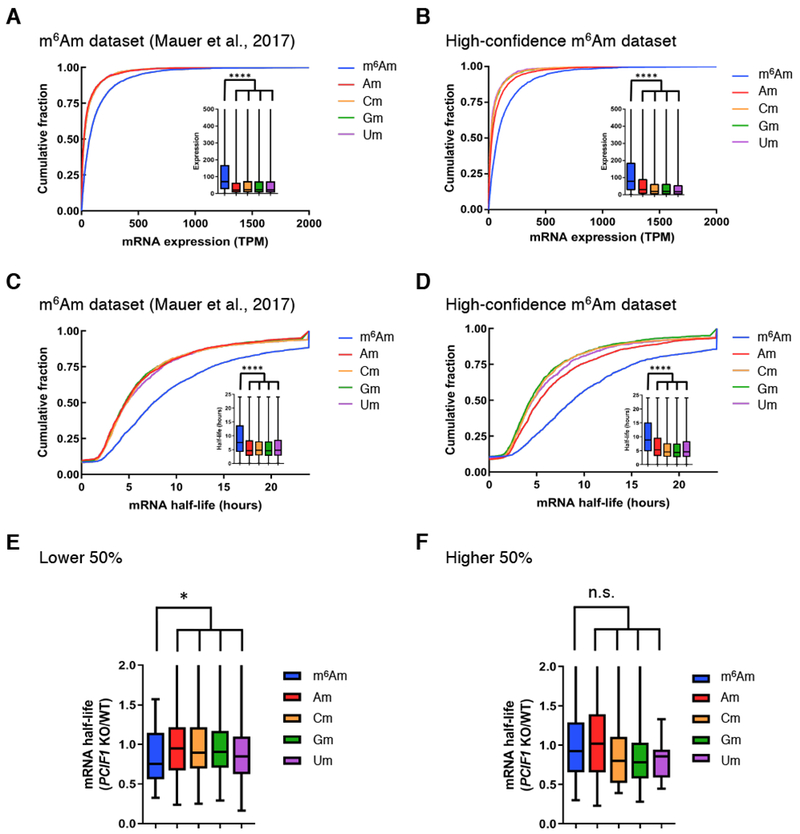
mRNAs are regulated by nucleotide modifications that influence their cellular fate. Two of the most abundant modified nucleotides are N6-methyladenosine (m6A), found within mRNAs, and N6,2'-O-dimethyladenosine (m6Am), which is found at the first transcribed nucleotide. Distinguishing these modifications in mapping studies has been difficult. Here, we identify and biochemically characterize PCIF1, the methyltransferase that generates m6Am. We find that PCIF1 binds and is dependent on the m7G cap. By depleting PCIF1, we generated transcriptome-wide maps that distinguish m6Am and m6A. We find that m6A and m6Am misannotations arise from mRNA isoforms with alternative transcription start sites (TSSs). These isoforms contain m6Am that maps to "internal" sites, increasing the likelihood of misannotation. We find that depleting PCIF1 does not substantially affect mRNA translation but is associated with reduced stability of a subset of m6Am-annotated mRNAs. The discovery of PCIF1 and our accurate mapping technique will facilitate future studies to characterize m6Am's function.

Keywords: PCIF1; m(6)A; m(6)Am; mRNA methylation; mRNA stability; mRNA translation.


Conflict of interest statement

DECLARATION OF INTERESTS

S.R.J. is scientific founder, advisor to, and owns equity in Gotham Therapeutics.

Figures

Figure 1.
Figure 1.. PCIF1 N6-methylates 2′-O-methyladenosine in vitro in an m7G cap-dependent manner.
A. Schematic of PCIF1 indicating the position of predicted functional domains. The location of the sites of mutations used in the study are shown. The catalytic domain includes a four amino acid motif, NPPF, which is predicted to be essential for mediating methylation (Iyer et al., 2016). The location of the site guide RNAs (gRNAs; 5′- CGGUUGAAAGACUCCCGUGG-3′ and 5′- ACUUAACAUAUCCUGCGGGG-3′) used in Figure 2 are indicated. B. Oligonucleotide sequences used in methyltransferase assays. C. PCIF1 methylates m7G-ppp-Am-N20 RNA. GST-PCIF1 (50 nM), but not the catalytically inactive mutants APPA or SPPG efficiently converts m7G-ppp-Am (4 μM) to m7G-ppp-m6Am as assessed by UHPLC-MS/MS. Under the same conditions (SAM, 160 μM, 10 min), PCIF1 does not convert any of the 5 internal adenosines to m6A. Each bar represents the mean ± s.e.m of 3 independent experiments. n.s: not significant, ***: p < 0.001, as assessed by unpaired Student’s t-tests. D. PCIF1 methylates cap-adjacent adenosine regardless of 2′-O-ribose methylation. GST-PCIF1, but not the APPA or SPPG PCIF1 mutants efficiently converts m7G-ppp-A-N20 (4 μM) to m7G-ppp-m6A-N20. Assays were performed as in C. Each bar represents the mean ± s.e.m of 3 independent experiments. ***: p < 0.001, as assessed by unpaired t-tests. E. PCIF1 enzyme kinetics. m7G-ppp-Am-N20 (at indicated concentration) was incubated with GST-PCIF1 (20 nM) for the indicated times in the presence of 1.33 μM 3H-SAM and 10 μM SAM. Methylation was determined by the presence of 3H in the RNA, as assessed by scintillation counting. Each point represents the mean ± s.e.m of 3 independent experiments. F. Michaelis-Menten kinetics of PCIF1 methylytransferase activity toward m7G-ppp-Am and m7G-ppp-A. Each point represents the mean ± s.e.m of 3 independent experiments. G. PCIF1 activity depends on the presence of the m7G cap. m7G-ppp-Am-N20 or ppp-Am-N20 (4 μM) was incubated with GST-PCIF1 as in C. PCIF1 converted Am to m6Am specifically in the m7G capped RNA. Each bar represents the mean ± s.e.m of 3 independent experiments. ***: p < 0.001, as assessed by unpaired t-tests. H. PCIF1 directly binds the m7G cap. Anti-FLAG immunoblotting was used to detect binding of 3xFLAG-PCIF1 from HeLa cell extracts to m7GTP-conjugated beads. The beads were eluted with m7G-ppp-A or G-ppp-A. eIF4E and eIF4G were used to control for binding to m7G.
Figure 2.
Figure 2.. PCIF1 N6-methylates 2′-O-methyladenosine in cells
A. CRISPR-mediated PCIF1 knockout (KO) in HEK293T cells was assessed by anti-PCIF1 immunoblotting. The upper band represents endogenous PCIF1, whereas the lower band is a non-specific band. β-actin, loading control. B. PCIF1 is required for formation of m6Am in mRNA in cells. m6Am and Am levels in poly(A) RNA was detected by radiolabeling the 5′ nucleotide after decapping. RNA hydrolysates were resolved by 2D-TLC. Representative images are shown from 3 biological replicates. The bar graph on the right represents the mean ± s.e.m of 3 independent experiments. *** p < 0.001, Student’s t-test. C. m6Am is depleted in PCIF1 KO HEK293T cells as assessed by UHPLC-MS/MS. Each bar represents the mean ± s.e.m of 3 independent experiments. ****: p <0.0001 as assessed by paired t-tests. D. PCIF1 does not affect the level of internal m6A. 2D-TLC analysis of poly(A) RNA from HEK293T (WT) and PCIF1 KO HEK293T show no effect on the level of m6A. E. Internal m6A is not affected in PCIF1 KO HEK293T cells as assessed by UHPLC-MS/MS. Each bar represents the mean ± s.e.m of 3 independent experiments. ns: not significant, as assessed by paired t-tests. F. Wild-type but not a catalytically inactive PCIF1 mutant restores m6Am levels in PCIF1 knockout cells as assessed by 2D-TLC. Each bar represents the mean ± s.e.m of two independent experiments. G. Wild-type but not catalytically inactive PCIF1 mutant restores m6Am levels in PCIF1 KO cells as assessed by UHPLC-MS/mS. Each bar represents the mean ± s.e.m of two independent experiments. Ns: not significant, * p < 0.05 as assessed by paired t-tests. H. Western blot analysis demonstrates equivalent expression of wild-type and catalytically inactive FLAG-tagged PCIF1. β-actin, loading control. I. Overexpression of wild-type but not catalytically inactive PCIF1 increases m6Am levels in HEK293T cells as assessed by 2D-TLC. Upper and left panels show representative images of 3 independent experiments. The bar graph represents the mean ± s.e.m of 3 independent experiments. ns: not significant, ****P ≤ 0.0001, unpaired t-tests. See also Figure S1.
Figure 3.
Figure 3.. Depletion of PCIF1 distinguishes m6A and m6Am in transcriptome-wide 6mA maps.
A. Metagene of miCLIP reads in wild-type and PCIF1 knockout (KO) HEK293T cells. Shown is a metagene analysis of reads from the wild-type or PCIF1 KO miCLIP dataset. The first nucleotide of each read (with respect to the RNA strand) was extracted and plotted. Reads in the 5′UTR were lost in the PCIF1 knockout, suggesting a complete loss of m6Am in the PCIF1 knockout cells. B. DREME motif search within called peaks show the DRACH motif as the most enriched in all datasets, consistent m6A as the most abundant 6mA-containing nucleotide mapped by miCLIP. C. miCLIP peaks can be identified as m6Am or m6A based on their decrease in PCIF1 KO cells. Genome tracks were plotted for RPL35 and KDELR2 with called m6A sites (FDR<0.1) and m6Am sites indicated by red circles and blue triangle, respectively. Zoomed insets show m6Am peaks can be distinguished from nearby m6A sites. D. The previously annotated m6Am site in RACK1 is actually a 5′UTR m6A. The TSS-proximal peak in RACK1 is not affected in the PCIF1 knockout and overlaps with a DRACH motif. E. Metagene analysis of PCIF1 KO-validated m6Am sites shows m6Am sites throughout the 5′UTR and in the transcript body. Shown is a metagene of the exact sites of m6Am within the PCIF1-dependent peaks as determined by A to T transitions and the read drop-off method. The metagene reveals an overall enrichment at the TSS, with some sites that appear to be within the CDS and 3′UTR. F. DREME motif search of the nucleotides surrounding each m6Am was performed confirms the previously reported BCA motif, and shows that the promoter sequence upstream of the m6Am is GC-enriched. See also Figure S2.
Figure 4.
Figure 4.. Internally mapped m6Am sites reflect m6Am in mRNA isoforms with alternative TSSs.
A. A metaplot centered on the closest RefSeq TSS for each called m6Am site shows most m6Am sites are found downstream of the annotated start site, but not at the annotated start site. The proportion of m6Am directly at the annotated TSS, or up- or downstream is shown. B. A metaplot analysis of m6Am locations using GENCODE TSS annotations shows higher overlap with TSSs. GENCODE annotations include more transcript isoforms and TSSs than RefSeq. C. A metaplot of the distance from each m6Am site to the closest CAGE peak in the FANTOM5 database shows that m6Am sites are indeed TSSs. Here, the overlap of m6Am was highest, suggesting that m6Am sites are selectively localized to TSSs and not internal nucleotides within mRNA. D. The m6Am mapping to the annotated 5′UTR of the YBX1 transcript reflects a transcript isoform. The PCIF1-dependent 6mA peak in YBX1 maps within the annotated 5′UTR of YBX1. However, this peak overlaps with a CAGE site (orange triangles), indicating the existence of a transcript isoform that initiates at this 6mA site. m6Am peaks that appear within the 5′UTR reflect m6Am in transcript isoforms with alternative TSSs. The exact m6Am site (blue triangle) was determined using the A to T transition within the PCIF1-dependent peak. E. Most m6Am are found in the annotated 5′UTR of transcripts. F. The internally mapping m6Am in YOD1 derives from a TSS of a YOD1 transcript isoform. The m6Am peak in YOD1 begins beyond the start codon of both annotated isoforms. CAGE peaks (orange triangles) suggest this is indeed a TSS. G. A metaplot analysis of CDS and 3′UTR mapping m6Am sites show overlap with CAGE data, indicating that m6Am occurs at TSSs. The closest CAGE peak to each of the 6% of sites that appeared to not map to the 5′UTR (E) was calculated and plotted. See also Figure S3.
Figure 5.
Figure 5.. mRNA expression level and mRNA half-life depending on TSS
A. mRNAs with an annotated m6Am start nucleotide show higher mRNA expression than other mRNAs. mRNA expression level in wild-type HEK293T cells was based on the first annotated nucleotide and an earlier m6Am map (Mauer et al., 2017a) . Transcripts that start with m6Am are significantly upregulated. ****, P < 2.2 × 10⁻¹⁶, Student’s t-test. Cumulative distribution plot and boxplot represent the expression for mRNAs starting with m6Am, Am, Cm, Gm and Um. Data shown are the average gene expression measured from two replicates for HEK293T cells. B. m6Am mRNAs annotated using the PCIF1 knockout (KO) miCLIP dataset show increased expression compared to mRNAs with other start nucleotides. Cumulative distribution plots were prepared as in A using the high-confidence m6Am dataset. The transcripts start with m6Am are significantly upregulated as in A. ****, P < 2.2 × 10⁻¹⁶, Student’s t-test. C. mRNAs with an annotated m6Am start nucleotide show higher mRNA half-life than other mRNAs. Annotated mRNA half-lives were based on the first annotated nucleotide and an earlier m6Am map (Mauer et al., 2017a). mRNAs with an annotated m6Am exhibit a significantly elevated mRNA half-life than mRNAs with other annotated start nucleotides. ****, P < 2.2 × 10⁻¹⁶, Student’s t-test. D. m6Am mRNAs annotated using the PCIF1 KO miCLIP dataset show increased expression compared to mRNAs with other start nucleotides. Transcripts with m6Am have significantly longer half-life with similar P-value. ****, P < 2.2 × 10⁻¹⁶, Student’s t-test. E. Influence of PCIF1 depletion on mRNA half-life for transcripts in the lower half of gene expression. Transcripts with m6Am have significantly shorter half-life in comparison to mRNAs with other annotated start nucleotides. *, P = 0.0258 by Student’s t-test. F. Influence of PCIF1 depletion on mRNA half-life for highly expressed transcripts. Transcripts with m6Am show no significant decrease in mRNA half-life in comparison to mRNAs with other annotated start nucleotides. n.s., Student’s t-test. See also Figure S4.

Similar articles

Cited by

References

    1. Abugessaisa I, Noguchi S, Hasegawa A, Harshbarger J, Kondo A, Lizio M, Severin J, Carninci P, Kawaji H, and Kasukawa T (2017). FANTOM5 CAGE profiles of human and mouse reprocessed for GRCh38 and GRCm38 genome assemblies. Sci Data 4, 170107. - PMC - PubMed
    1. Akichika S., Hirano S, Shichino Y, Suzuki T, Nishimasu H, Ishitani R, Sugita A, Hirose Y, Iwasaki S, Nureki O, et al. (2019). Cap-specific terminal N (6)-methylation of RNA by an RNA polymerase II-associated methyltransferase. Science 363, 6423, eaav0080, doi:10.1126/science.aav0080. - DOI - PubMed
    1. Barral K, Sallamand C, Petzold C, Coutard B, Collet A, Thillier Y, Zimmermann J, Vasseur JJ, Canard B, Rohayem J, et al. (2013). Development of specific dengue virus 2′-O- and N7-methyltransferase assays for antiviral drug screening. Antiviral Res 99, 292–300. - PubMed
    1. Belanger F, Stepinski J, Darzynkiewicz E, and Pelletier J (2010). Characterization of hMTr1, a human Cap1 2′-O-ribose methyltransferase. J Biol Chem 285, 33037–33044. - PMC - PubMed
    1. Bokar JA, Shambaugh ME, Polayes D, Matera AG, and Rottman FM (1997). Purification and cDNA cloning of the AdoMet-binding subunit of the human mRNA (N6-adenosine)-methyltransferase. RNA 3, 1233–1247. - PMC - PubMed

Publication types

MeSH terms