. 2019 Sep;145(9):2383-2396.
doi: 10.1007/s00432-019-02974-4. Epub 2019 Jul 6.

Co-expression network analysis identified candidate biomarkers in association with progression and prognosis of breast cancer

Affiliations

Co-expression network analysis identified candidate biomarkers in association with progression and prognosis of breast cancer

Qiang Zhou et al. J Cancer Res Clin Oncol. 2019 Sep.

Abstract

Purpose: Breast cancer is one of the most common malignancies among females, and its prognosis is affected by a complex network of gene interactions. Weighted gene co-expression network analysis was used to construct free-scale gene co-expression networks and to identify potential biomarkers for breast cancer progression.

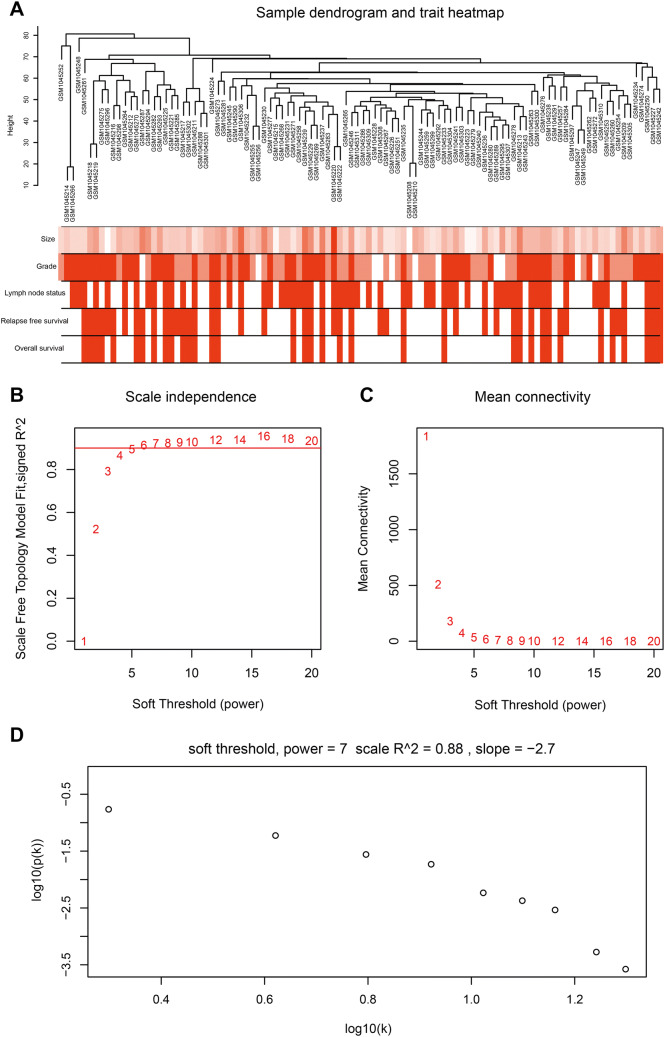
Methods: The gene expression profiles of GSE42568 were downloaded from the Gene Expression Omnibus database. RNA-sequencing data and clinical information of breast cancer from TCGA were used for validation.

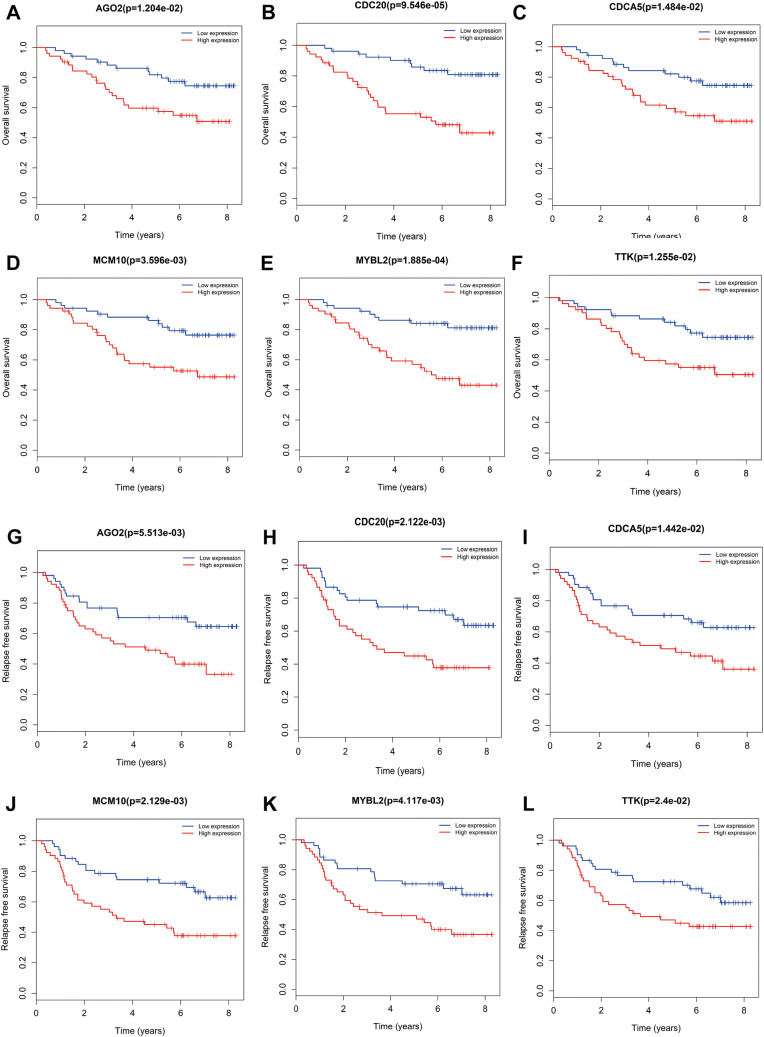
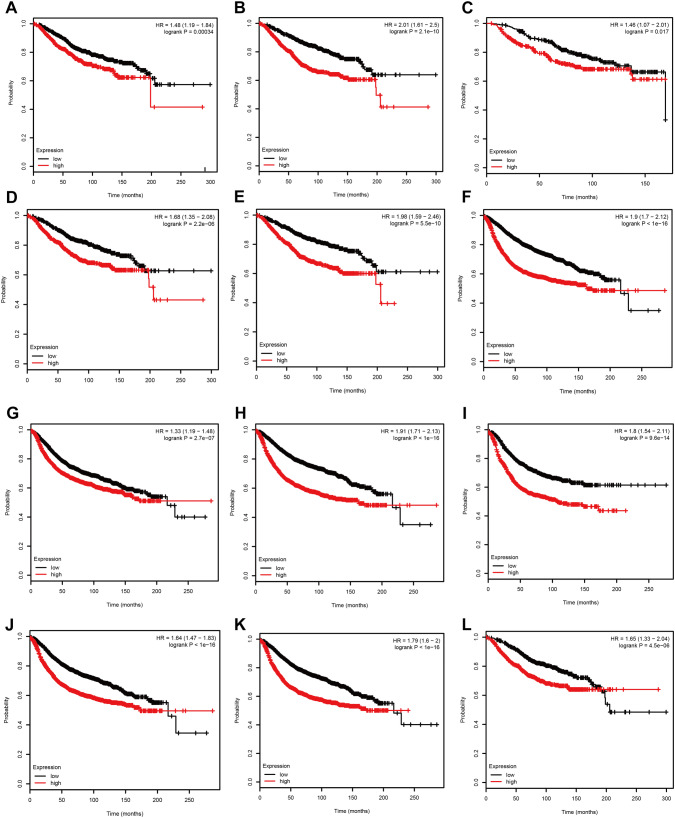
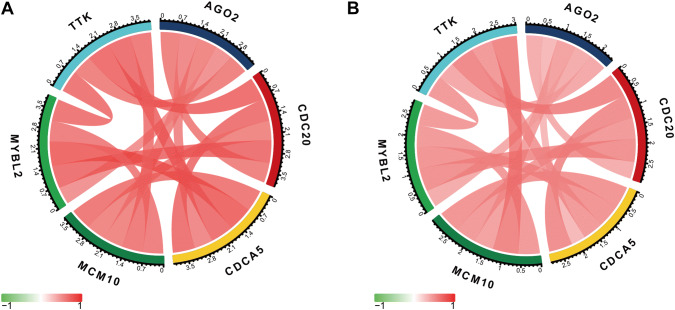
Results: A total of ten modules were established by the average linkage hierarchical clustering. We identified 58 network hub genes in the significant module (R2 = 0.44) and 6 hub genes (AGO2, CDC20, CDCA5, MCM10, MYBL2, and TTK), which were significantly correlated with prognosis. Receiver-operating characteristic curve validated that the mRNA levels of these six genes exhibited excellent diagnostic efficiency in the test data set of GSE42568. RNA-sequencing data from TCGA showed that the expression levels of these six genes were higher in triple-negative tumors. One-way ANOVA suggested that these six genes were upregulated at more advanced stages. The results of independent sample t test indicated that MCM10 and TTK were associated with tumor size, and that AGO2, CDC20, CDCA5, MCM10, and MYBL2 were overexpressed in lymph-node positive breast cancer.

Conclusions: AGO2, CDC20, CDCA5, MCM10, MYBL2, and TTK were identified as candidate biomarkers for further basic and clinical research on breast cancer based on co-expression analysis.

Keywords: Biomarker; Breast cancer; Gene Expression Omnibus; Prognosis; Weighted gene co-expression network analysis.


Conflict of interest statement

The authors declare no conflicts of interest.

Figures

Fig. 1
Fig. 1
Clustering dendrogram and determination of soft-thresholding power in the WGCNA. a Clustering dendrogram of 104 samples. b Analysis of the scale-free fit index for various soft-thresholding powers (β). c Analysis of the mean connectivity for various soft-thresholding powers. d Checking the scale-free topology when β = 6
Fig. 2
Fig. 2
Identification of modules associated with the clinical traits of breast cancer. a Dendrogram of all differentially expressed genes clustered based on a dissimilarity measure (1-TOM). b Heatmap of the correlation between module eigengenes and clinical traits of breast cancer. c Distribution of average gene significance and errors in the modules associated with tumor grades of breast cancer
Fig. 3
Fig. 3
GO and pathway enrichment analysis of blue module genes. a Biological process analysis. b Cellular component analysis. c Molecular function analysis. d KEGG pathway analysis
Fig. 4
Fig. 4
Overall survival (OS) and relapse-free survival (RFS) of the six hub genes in breast cancer based on the data set GSE42568. The patients were stratified into high-level group and low-level group according to median expression. a OS of AGO2. b OS of CDC20. c OS of CDCA5. d OS of MCM10. e OS of MYBL2. f OS of TTK. g RFS of AGO2. h RFS of CDC20. i RFS of CDCA5. j RFS of MCM10. k RFS of MYBL2. l RFS of TTK
Fig. 5
Fig. 5
OS and RFS of the six hub genes in breast cancer based on Kaplan–Meier-plotter. The patients were stratified into high-level group and low-level group according to median expression. a OS of AGO2. b OS of CDC20. c OS of CDCA5. d OS of MCM10. e OS of MYBL2. f OS of TTK. g RFS of AGO2. h RFS of CDC20. i RFS of CDCA5. j RFS of MCM10. k RFS of MYBL2. l RFS of TTK
Fig. 6
Fig. 6
Validation of AGO2, CDC20, CDCA5, MCM10, MYBL2, and TTK. a ROC curve of AGO2. b ROC curve of CDC20. c ROC curve of CDCA5. d ROC curve of MCM10. e ROC curve of MYBL2. f ROC curve of TTK. g Heatmap of the expression of hub genes in different stages of breast cancer
Fig. 7
Fig. 7
Validation of AGO2, CDC20, CDCA5, MCM10, MYBL2, and TTK based on TCGA data set. a ROC curve of AGO2. b ROC curve of CDC20. c ROC curve of CDCA5. d ROC curve of MCM10. e ROC curve of MYBL2. f ROC curve of TTK. g AGO2 expression at different stages of breast cancer. h CDC20 expression at different stages of breast cancer. i CDCA5 expression at different stages of breast cancer. j MCM10 expression at different stages of breast cancer. k MYBL2 expression at different stages of breast cancer. l TTK expression at different stages of breast cancer. m MCM10 expression and tumor size. n TTK expression and tumor size. o AGO2 expression and lymph-node metastasis. p CDC20 expression and lymph-node metastasis. q CDCA5 expression and lymph-node metastasis. r MCM10 expression and lymph-node metastasis. s MYBL2 expression and lymph-node metastasis. *p < 0.05; **p < 0.01; ***p < 0.001; ****p < 0.0001
Fig. 8
Fig. 8
Correlation among AGO2, CDC20, CDCA5, MCM10, MYBL2, and TTK. a GSE42568 and b TCGA

References

    1. Adams BD, Claffey KP, White BA (2009) Argonaute-2 expression is regulated by epidermal growth factor receptor and mitogen-activated protein kinase signaling and correlates with a transformed phenotype in breast cancer cells. Endocrinology 150:14–23. 10.1210/en.2008-0984 - DOI - PMC - PubMed
    1. Bray F, Ferlay J, Soerjomataram I, Siegel RL, Torre LA, Jemal A (2018) Global cancer statistics 2018: GLOBOCAN estimates of incidence and mortality worldwide for 36 cancers in 185 countries. CA Cancer J Clin. 68:394–424. 10.3322/caac.21492 - DOI - PubMed
    1. Chang IW et al (2015) CDCA5 overexpression is an indicator of poor prognosis in patients with urothelial carcinomas of the upper urinary tract and urinary bladder. Am J Transl Res 7:710–722 - PMC - PubMed
    1. Chen T et al (2017) Role of triosephosphate isomerase and downstream functional genes on gastric cancer. Oncol Rep 38:1822–1832. 10.3892/or.2017.5846 - DOI - PubMed
    1. Chen X et al (2018) A novel USP9X substrate TTK contributes to tumorigenesis in non-small-cell lung cancer. Theranostics 8:2348–2360. 10.7150/thno.22901 - DOI - PMC - PubMed

Substances

LinkOut - more resources