. 2019 Jan-Dec:23:2331216519858301.
doi: 10.1177/2331216519858301.

Direct-to-Consumer Hearing Devices: Capabilities, Costs, and Cosmetics

Affiliations

Direct-to-Consumer Hearing Devices: Capabilities, Costs, and Cosmetics

Ibrahim Almufarrij et al. Trends Hear. 2019 Jan-Dec.

Abstract

Direct-to-consumer (DTC) hearing devices can be purchased without consulting a hearing health professional. This project aims to compare 28 DTC devices with the most popular hearing aid supplied by the U.K. National Health Service (NHS). The comparison was based on technical performance, cosmetic acceptability, and the ability to match commonly used gain and slope targets. Electroacoustic performance was evaluated in a 2-cc coupler. Match to prescription target for both gain and slope was measured on a Knowles Electronic Manikin for Acoustic Research using a mild and also a moderate sloping hearing loss. Using an online blinded paired comparison of each DTC and the NHS reference device, 126 participants (50 were hearing aid users and 76 were nonhearing aid users) assessed the cosmetic appearance and rated their willingness-to-wear the DTC devices. The results revealed that higher purchase prices were generally associated with a better match to prescribed gain-frequency response shapes, lower distortion, wider bandwidth, better cosmetic acceptability, and higher willingness-to-wear. On every parameter measured, there were devices that performed worse than the NHS device. Most of the devices were rated lower in terms of aesthetic design than the NHS device and provided gain-frequency responses and maximum output levels that were markedly different from those prescribed for commonly encountered audiograms. Because of the absence or inflexibility of most of the devices, they have the potential to deliver poor sound quality and uncomfortably loud sounds. The challenge for manufacturers is to develop low-cost products with cosmetic appeal and appropriate electroacoustic characteristics.

Keywords: direct-to-consumer; gain; hearing aids; personal sound amplification products; slope.


Figures

Figure 1.
Figure 1.
The two standard audiometric configurations used. The crosses represent the audiometric configurations for the mild audiogram (N2), and the circles represent the audiometric configuration for the moderate audiogram (N3; Bisgaard, Vlaming, & Dahlquist, 2010).
Figure 2.
Figure 2.
An example of the panels for physical appearance rating and willingness-to-wear the DTC devices. Each panel contains the same device photographed from two angles and on two ears.
Figure 3.
Figure 3.
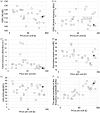
The electroacoustic characteristics of the hearing devices as a function of price: (a) maximum output at any frequency for an input level of 90 dB; (b) peak frequency with an input level of 90 dB SPL; (c) total harmonic distortion averaged across 0.5, 0.8, and 1.6 kHz; (d) equivalent input noise in dB; (e) high-frequency average full-on gain in a 2 cc coupler with an input of 50 dB SPL; and (f) the upper boundary of the frequency bandwidth. Note that the upper boundary of the measurement device was limited to 8 kHz. The filled marker is the most popular NHS hearing aid.
Figure 4.
Figure 4.
Measured maximum OSPL90 for DTC devices in this study (squares). The dotted line represents the AHCA’s recommended limits for moderate hearing loss (AHCA, 2018). The solid line represents the estimated maximum OSPL90 to avoid loudness discomfort based on Dillon and Storey (1998) for the N3 hearing loss used in this study. Data from previous studies have been included for comparison. The triangles are the data from Callaway and Punch (2008), the circles are the data from Chan and McPherson (2015), the crosses are the data from Reed, Betz, Lin, and Mamo (2017). The filled marker represents the NHS hearing aid. Devices that were reported in more than one study are plotted only once. Costs were estimated using the USD to GBP exchange rate from 10 September 2018 of $1.30 to £1.00.
Figure 5.
Figure 5.
Measured maximum HFA FOG for DTC devices in this study (squares). The dotted line represents the AHCA’s recommended limits for moderate hearing loss (AHCA, 2018). Data from previous studies have been included for comparison. The triangles are the data from Callaway and Punch (2008), the circles are the data from Chan and McPherson (2015). The filled marker represents the NHS hearing aid. Devices that were reported in more than one study are plotted only once. Costs were estimated using the USD to GBP exchange rate from 10 September 2018 of $1.30 to £1.00. HFA FOG = high-frequency average full-on gain.
Figure 6.
Figure 6.
The root-mean-square of the difference between the NAL-NL2 insertion gain target and the measured insertion gain for an input level of 65 dB are shown in Panels A and B for mild (N2), and moderate (N3) hearing loss, respectively. The root-mean-square of the difference between measured and the prescribed NAL-NL2 85 dB SPL maximum output target while the hearing aid’s volume control was set to full-on gain are shown in Panel C. The results for DTC devices are shown as open markers, and the filled marker represents the NHS hearing aid.
Figure 7.
Figure 7.
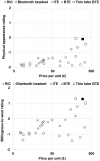
The average physical appearance (top panel) and willingness-to-wear (bottom panel) ratings of the hearing devices as a function of device price. For appearance, positive values represent a preference for each device compared with the reference NHS hearing aid. For willingness, positive values indicate willingness-to-wear the device. Each hearing device style is given a different marker. The filled marker represents the ratings for the NHS hearing aid. ITE = in the ear; BTE = behind the ear.
Figure 8.
Figure 8.
Total standardized z scores as a function of device price. Negative scores = below the average, positive scores = above the average. ITE = in the ear; BTE = behind the ear; RIC = receiver-in-the-canal.

References

    1. Abrams H., Chisolm T., McManus M., McArdle R. (2012) Initial-fit approach versus verified prescription: Comparing self-perceived hearing aid benefit. Journal of the American Academy of Audiology 23(10): 768–778. doi:10.3766/jaaa.23.10.3. - PubMed
    1. American Hearing Care Associations. (2018). Regulatory recommendation For OTC hearing aids: Safety & effectivness (pp. 1–35). Retrieved from https://www.asha.org/uploadedFiles/Consensus-Paper-From-Hearing-Care-Ass....
    1. ASHA Ad Hoc Committee on Hearing Aid Selection and Fitting (1998) Guidelines for hearing aid fitting for adults. American Journal of Audiology 7(1): 5–13. doi:10.1044/1059-0889.0701.05. - PubMed
    1. Bainbridge K. E., Ramachandran V. (2014) Hearing aid use among older U.S. adults; the national health and nutrition examination survey, 2005-2006 and 2009-2010. Ear and Hearing 35(3): 289–294. doi:10.1097/01.aud.0000441036.40169.29. - PMC - PubMed
    1. Baumfield, A., & Dillon, H. (2001). Factors affecting the use and perceived benefit of ITE and BTE hearing aids. British Journal of Audiology, 35(4), 247–258. doi:10.1080/00305364.2001.11745243. - PubMed

Publication types