. 2019 Sep 4;103(5):922-933.e7.
doi: 10.1016/j.neuron.2019.06.001. Epub 2019 Jul 4.

Stable Representations of Decision Variables for Flexible Behavior

Affiliations

Stable Representations of Decision Variables for Flexible Behavior

Bilal A Bari et al. Neuron. .

Abstract

Decisions occur in dynamic environments. In the framework of reinforcement learning, the probability of performing an action is influenced by decision variables. Discrepancies between predicted and obtained rewards (reward prediction errors) update these variables, but they are otherwise stable between decisions. Although reward prediction errors have been mapped to midbrain dopamine neurons, it is unclear how the brain represents decision variables themselves. We trained mice on a dynamic foraging task in which they chose between alternatives that delivered reward with changing probabilities. Neurons in the medial prefrontal cortex, including projections to the dorsomedial striatum, maintained persistent firing rate changes over long timescales. These changes stably represented relative action values (to bias choices) and total action values (to bias response times) with slow decay. In contrast, decision variables were weakly represented in the anterolateral motor cortex, a region necessary for generating choices. Thus, we define a stable neural mechanism to drive flexible behavior.


Figures

Figure 1:
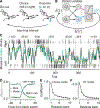
Figure 1:. Mice use reward history to drive flexible decisions.
(A) Dynamic foraging task in which mice chose freely between a leftward and rightward lick, followed by a drop of water with a probability that varied. (B) Reinforcement-learning model illustrating the distinction between decision variables (relative value, QrQl, in pink, and total value, Qr + Ql, in blue), and feedback variables δ (t), the error between expected and received reward). Left and right action values (Ql, Qr ) are used to compute choice direction (c (t)) and response time (RT), and are followed by reward on a given trial ( R (t)). (C) Example mouse behavior in the “multiple-probability” task. Black (rewarded) and gray (unrewarded) ticks correspond to left (below) and right (above) choices. Black curve: mouse (smoothed over 5 trials) choices. Green curve: generative model probability of making a rightward choice. Gold lines correspond to matching behavior. Numbers indicate left/right reward probabilities. (D) Probability of rightward mouse and generative model choices around block changes (changes in reward probabilities) for both task variants. Blocks with 1:1 reward probabilities were excluded from this analysis. (E) Logistic regression coefficients for choice as a function of reward history (“choice model”). Error bars: 95% CI. (F) Linear regression coefficients for RT as a function of reward history (“RT model”). Error bars: 95% CI. See also Figure S1.
Figure 2:
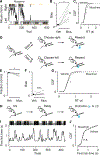
Figure 2:. mPFC drives choice bias and response time.
(A) Example mPFC inactivation (muscimol injected during trials under curly brace). (B) Choice bias after vehicle and muscimol injections within and across mice (Wilcoxon signed rank test, P< 0.01). (C) Cumulative distributions of response times (RT) after vehicle (solid) and muscimol (dashed) injections (vehicle mean, 581±2 ms, median, 553 ms, muscimol mean, 672±4 ms, median, 618 ms, Wilcoxon rank sum test, P < 0.0001 ). (D) Two-alternative forced choice (2AFC) task, in which two odors signaled leftward or rightward choice. (E) Mean fraction correct in the 2AFC task, with vehicle or muscimol injections, within and across mice. Inactivation produced a small reduction in fraction of correct choices (Wilcoxon signed rank test, P < 0.05). (F) Inactivation did not bias choices in this task (Wilcoxon signed rank test, P > 0.3). (G) Inactivation increased RT (vehicle mean, 542±3 ms, median, 533 ms, muscimol mean, 586±5 ms, median, 556 ms, Wilcoxon rank sum, P< 0.0001). (H) Dynamic classical conditioning task, in which a single odor was followed by a delayed reward with a nonstationary probability. (I) Example session, in which latency to first lick following the odor varied with the probability of reward. Gold lines correspond to high-probability blocks. (J) Inactivation did not slow the latency to first lick (4 mice; vehicle mean, 691±6 ms, median, 517 ms, muscimol mean, 647±7 ms, median, 550 ms, Wilcoxon rank sum, P > 0.7 ). See also Figure S2.
Figure 3:
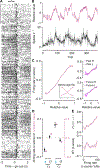
Figure 3:. Background, persistent activity in mPFC correlates with relative value.
(A) Example neuronal activity relative to go cues (each tick is an action potential). Trials proceed downward. Scale bar: 50 trials. Curly brace indicates analysis window. (B) Relative value (Ql −Qr ) and firing rate (gray; smoothed in black) in the 1 s before go cues for the same neuron. (C) Left: firing rate (z-score) for pure relative-value neurons (inset shows firing rates split by neurons that increase or decrease activity; neurons that decreased activity were sign-flipped and combined with those that increased activity). Right: the same neurons split by the direction of the previous (top) or next (bottom) choice (left, dark shading, right, light shading). (D) Comparison of changes in firing rate (black, in which neurons with increasing or decreasing activity are combined, mean ± SEM) and model relative value (pink) following rewards (water drop) or no rewards (Ø), for left choices (cl ) and right choices (cr ). (E) Relative-value neurons predict choice (top) but not RT (bottom). See also Figure S3 and S4.
Figure 4:
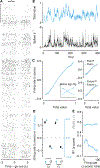
Figure 4:. Background, persistent activity in mPFC correlates with total value.
(A)-(E), the same as Figure 3A–E, but for total value.
Figure 5:
Figure 5:. Relative-value signals are persistent and stable in time, while total-value signals are persistent but decay over time.
(A) Firing rates of relative-value neurons during ITIs, split by quintiles of relative value. Scale bar: 0.1 z-score. (B) Firing rates of total-value neurons during ITIs, split by quintiles of total value. The difference across quintiles (averaged across adjacent quintiles) remained stable over time for relative-value (C, linear slope, 2.600×10⁻⁴ ± 1.8×10⁻⁵ z-score s−1, 95% CI) but not total-value (D, linear slope, −1.9×10⁻³ ±1.6×10⁻⁵ z-score s−1, 95% CI) neurons. (E) The probability that the model choice matches the mouse’s choice remains stable as a function of previous ITI (linear slope, −1.3×10⁻³ ±4.6 × 10⁻⁴ probability s−1 , 95% CI). (F) RT increases following longer ITIs (linear slope, 0.036±0.0019 z-score RT s−1 , 95% CI). Shading denotes SEM. Neurons were sign-flipped as in Figures 3C and 4C. See also Figure S5.
Figure 6:
Figure 6:. ALM weakly represents relative and total value.
(A) Example neuronal activity relative to go cues (each tick is an action potential). Trials proceed downward. Scale bar: 50 trials. Curly brace indicates analysis window. Bottom, average firing rates of the same neuron during leftward and rightward choice trials. (B) Cumulative distribution functions (CDF) of | z | values from generalized linear models, for relative (top left) and total value (bottom left) were larger for mPFC than ALM (Wilcoxon rank sum tests, P <10−10 ). Poisson regressions use z statistics to determine significance. For reference, | z |=1.96 is significant at P= 0.05. Right: larger fraction of neurons significantly encoded relative (top, proportion test χ12=90.9, P <10−10 ) and total value (bottom, χ12=158.3, P<10−10 ) in mPFC than ALM. See also Figure S6.
Figure 7:
Figure 7:. Neurons projecting to dorsomedial striatum encode decision variables using persistent activity.
(A) Localization of corticostriatal neurons. AAVretro-Cre was injected into an Ai9 mouse. Scale bar: 500μm. Box denotes region of recording sites. (B) Distribution of somata of labeled corticostriatal neurons. Marginal distributions are shown for each mouse (gray) and all mice (black). (C) Schema of inactivation of mPFC projections to dorsomedial striatum, using inhibitory designer receptors exclusively activated by designer drugs (DREADDs). (D) Left, inactivation of these neurons increased choice bias in DREADD, but not control, mice (Wilcoxon rank sum test, P < 0.05). Right, inactivation slowed response times. We calculated the change in response time induced by CNO relative to vehicle in DREADD and control mice. ΔRT is the difference between DREADD and control mice (95% bootstrapped CI). (E) Schema of experiment to identify corticostriatal neurons. (F) Example of a corticostriatal neuron, identified using collision tests. Top, action potentials evoked by optical axonal stimulation several milliseconds after spontaneous action potentials. Middle, failure to evoke action potentials briefly after spontaneous ones (“collisions”). Bottom, action potentials evoked following intervals without spontaneous firing. (G) Example corticostriatal neuron with persistent activity encoding decision variables. Scale bar: 50 trials. (H) Corticostriatal neurons encoded relative and total value using background firing rates. See also Figure S7.
Figure 8:
Figure 8:. Summary of information flow during dynamic decision making.
(A) Model, reproduced from Figure 1B. (B) Schema of experimental results, in which choices (c (t)) and reward prediction errors (δ(t)) are brief, and induce stable changes in relative value, and decaying changes in total value. (C) Localization of persistent decision variables in mPFC projections to dorsomedial striatum, whereas brief signals in ALM and from dopaminergic (DA) neurons instantiate choices and reward prediction errors. Dashed arrow stylizes recurrent computations in cortico-basal-ganglia loops.

Comment in

  • The Value of Persistent Value.
    Stoll FM, Rudebeck PH. Stoll FM, et al. Neuron. 2019 Sep 4;103(5):757-758. doi: 10.1016/j.neuron.2019.08.018. Neuron. 2019. PMID: 31487525

Similar articles

Cited by

References

    1. Anastasiades PG, Boada C, Carter AG. Cell-type-specific D1 dopamine receptor modulation of projection neurons and interneurons in the prefrontal Cortex. Cereb Cortex, 2018. - PMC - PubMed
    1. Balleine BW, Delgado MR, Hikosaka O. The role of the dorsal striatum in reward and decision-making. J Neurosci 27: 8161–8165, 2007. - PMC - PubMed
    1. Balleine BW, O’Doherty JP. Human and rodent homologies in action control: corticostriatal determinants of goal-directed and habitual action. Neuropsychopharmacology 35: 48–69, 2010. - PMC - PubMed
    1. Barak O, Tsodyks M. Persistent activity in neural networks with dynamic synapses. PLoS Comput Biol 3: e35, 2007. - PMC - PubMed
    1. Baum WM. Optimization and the matching law as accounts of instrumental behavior. J Exp Anal Behav 36: 387–403, 1981. - PMC - PubMed

Publication types

LinkOut - more resources