. 2019 Jul 22;29(14):2380-2388.e5.
doi: 10.1016/j.cub.2019.05.062. Epub 2019 Jul 4.

Insulin/IGF Signaling and Vitellogenin Provisioning Mediate Intergenerational Adaptation to Nutrient Stress

Affiliations

Insulin/IGF Signaling and Vitellogenin Provisioning Mediate Intergenerational Adaptation to Nutrient Stress

James M Jordan et al. Curr Biol. .

Abstract

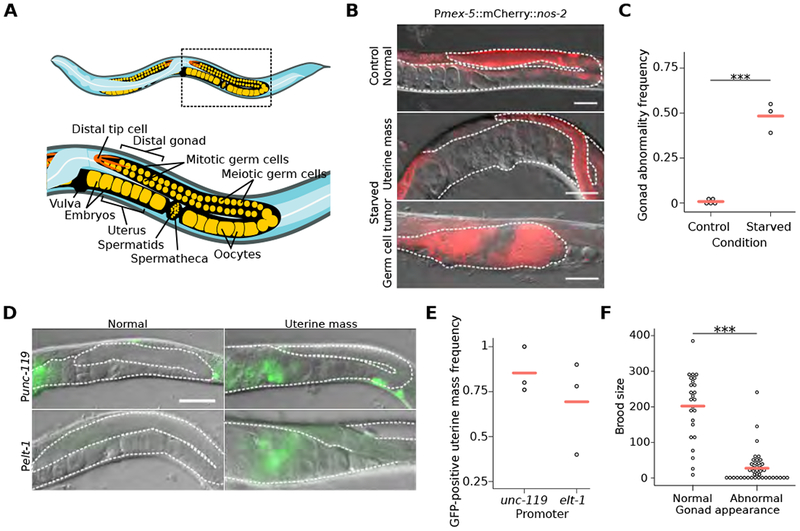
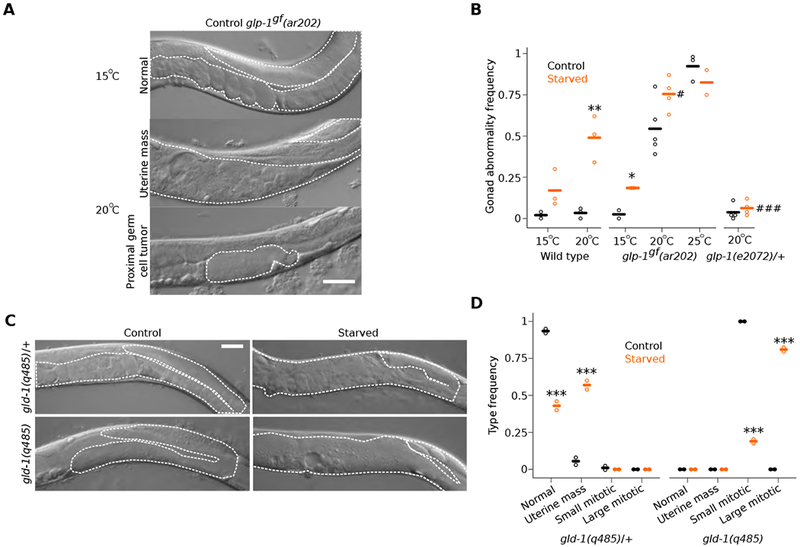
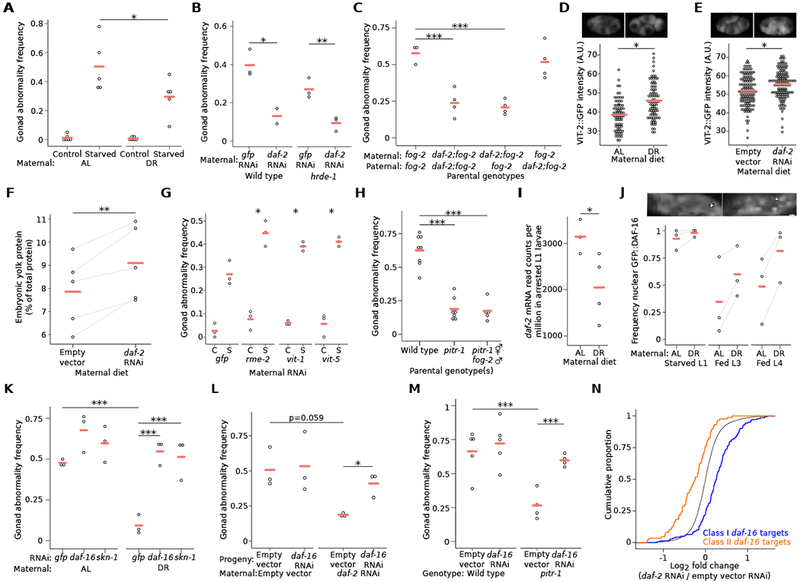
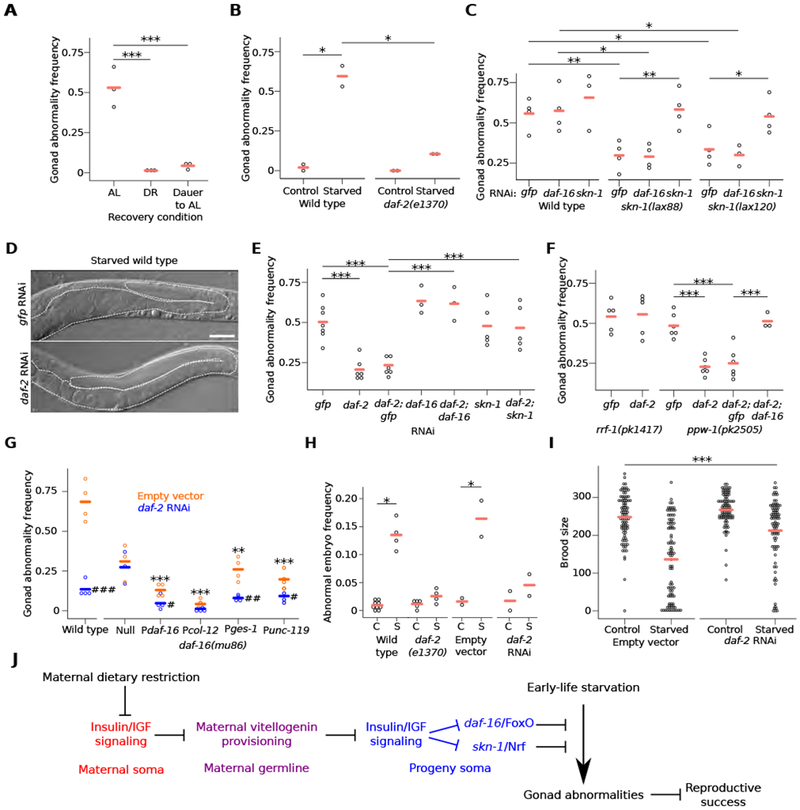
The roundworm C. elegans reversibly arrests larval development during starvation [1], but extended early-life starvation reduces reproductive success [2, 3]. Maternal dietary restriction (DR) buffers progeny from starvation as young larvae, preserving reproductive success [4]. However, the developmental basis of reduced fertility following early-life starvation is unknown, and it is unclear how maternal diet modifies developmental physiology in progeny. We show here that extended starvation in first-stage (L1) larvae followed by unrestricted feeding results in a variety of developmental abnormalities in the reproductive system, including proliferative germ-cell tumors and uterine masses that express neuronal and epidermal cell fate markers. We found that maternal DR and reduced maternal insulin/insulin-like growth factor (IGF) signaling (IIS) increase oocyte provisioning of vitellogenin lipoprotein, reducing penetrance of starvation-induced abnormalities in progeny, including tumors. Furthermore, we show that maternal DR and reduced maternal IIS reduce IIS in progeny. daf-16/FoxO and skn-1/Nrf, transcriptional effectors of IIS, are required in progeny for maternal DR and increased vitellogenin provisioning to suppress starvation-induced abnormalities. daf-16/FoxO activity in somatic tissues is sufficient to suppress starvation-induced abnormalities, suggesting cell-nonautonomous regulation of reproductive system development. This work reveals that early-life starvation compromises reproductive development and that vitellogenin-mediated intergenerational insulin/IGF-to-insulin/IGF signaling mediates adaptation to nutrient availability.

Keywords: L1 arrest; L1 diapause; dietary restriction; insulin; maternal provisioning; starvation; tumors; vitellogenin.


Conflict of interest statement

Declaration of Interests

Authors declare no competing interests.

Figures

Figure 1.
Figure 1.. Early-life starvation followed by unrestricted feeding results in reproductive abnormalities.
(A) Cartoon depicting organization of posterior gonad arm of an adult C. elegans hermaphrodite. Boxed area is enlarged to show region assessed for gonad abnormalities. (B) Representative images of control worms and previously starved adults with a germ-cell tumor or uterine mass. DIC and fluorescent images of the germ-cell reporter Pmex-5::H2B::mCherry (naSi2) are overlaid. (C) Frequency of all gonad abnormalities; at least 50 worms per condition per replicate. (D) Representative images of adults after L1 starvation with or without uterine masses. (E) Frequency of GFP-positive uterine masses; at least 20 masses were scored per condition per replicate. (F) Individual brood sizes of worms with either a normal or abnormal gonad; two biological replicates of at least 31 worms each. (B, D) Visible portions of the gonad and uterus are outlined with a white dashed line, animals are oriented as in (A), and scale bar is 50 microns. (C, F) ***p < 0.001; t-test on means of replicates. (C, E) Circles represent biological replicates. (C, E, F) Cross bars reflect the mean. See also Figure S1.
Figure 2.
Figure 2.. Early-life starvation followed by unrestricted feeding results in the formation of germ-cell masses.
(A) Representative image of glp-1gf(ar202) from control conditions at permissive and semi-permissive temperatures. (B) Frequency of all gonad abnormalities; at least 40 worms per condition per replicate. *p < 0.05, ** < 0.01; t-test between control and starved. #p < 0.05, ### < 0.001; t-test between starved mutant and starved wild type. (C) Representative images of adult gld-1(q485) mutants from given conditions. (D) Frequency of indicated abnormalities; frequencies sum to one for each genotype; at least 30 worms per condition per replicate. ***p < 0.001; t-test between frequencies of control and starved abnormalities of given type. (A, C) Visible portions of the gonad and uterus are outlined with a white dashed line and scale bars are 50 microns. (B, D) Circles indicate biological replicates and cross bars reflect their means. See also Figure S2.
Figure 3.
Figure 3.. Maternal DR and reduced IIS increase vitellogenin provisioning and reduce progeny IIS, protecting progeny from starvation-induced gonad abnormalities.
(A) Frequency of all gonad abnormalities; average of 49 progeny from ad libitum-fed (AL) or dietary restricted (DR) parents per replicate. *interaction p-value < 0.05; two-way analysis of variance (ANOVA). (B) Frequency of all gonad abnormalities in starved progeny from parents fed the indicated RNAi diet; at least 42 worms per replicate. (C) Frequency of all gonad abnormalities in starved cross progeny; at least 34 worms per replicate. (D, E) Circles indicate Pvit-2::VIT-2::GFP (pwIs23) fluorescence intensity of individual 1-4 cell embryos from parents raised in AL or DR conditions (D) and fed empty vector or daf-2 RNAi (E). Representative images of Pvit-2::VIT-2::GFP in 4-cell embryos are also provided for each condition. Three biological replicates of at least 24 embryos; cross bars reflect the mean of all embryos measured. A linear mixed-effect model was fit to all data with maternal diet as a fixed effect and biological replicate as a random effect; ***p < 0.001. Note that baseline discrepancy in VIT-2::GFP intensity is likely attributable to differences in culture methods (i.e., liquid versus solid media and E. coli HB101 versus HT115). (F) Summed density of wild-type yolk proteins 170, 115 and 88 relative to total protein on a gel. Lines connect results from five biological replicates. **p < 0.01; paired t-test. (G) Frequency of all gonad abnormalities in progeny from hrde-1 parents treated with the indicated RNAi; C = control, S = starved; at least 40 individuals were scored per condition. interaction p < 0.05, **p < 0.01; two-way ANOVA compared to gfp RNAi on means of replicates. (H) Frequency of all gonad abnormalities in starved self and cross progeny of the indicated genotype; at least 33 animals were scored per condition per replicate. (I) daf-2 mRNA read counts per million (CPM) in arrested L1 progeny of AL or DR parents. *q < 0.1. The full set of differentially expressed genes in progeny of parents fed AL and DR is listed in Table S1. Gene ontology (GO) terms for these genes are shown in Table S2. See Table S3 for daf-16 signature analysis of these genes. (J) Frequency of worms with intestinal nuclear GFP::DAF-16; 50 worms per condition per replicate; lines connect results from individual replicates. **p < 0.01; paired t-test of AL vs. DR across all replicates and stages. Insets are representative images of L1 larvae with cytoplasmic GFP::DAF-16 localization (left) or nuclear GFP::DAF-16 localization (right); white arrows indicate intestinal nuclei; scale bar is 5 microns. (K) Frequency of all gonad abnormalities in starved progeny of AL or DR parents raised on indicated RNAi food; at least 50 worms per replicate. (L) Frequency of all gonad abnormalities in starved hrde-1 mutants grown on the given RNAi food in each generation; at least 41 worms were scored per condition per replicate. (M) Frequency of all gonad abnormalities in starved progeny of the given genotype and raised on empty vector or daf-16 RNAi; at least 41 animals were scored per condition per replicate. (N) daf-16 target gene expression changes in progeny of hrde-1 parents fed empty vector or daf-2 RNAi. p = 3.664 × 10⁻¹⁵; Kolmogorov-Smirnov test. (A-C, F-M) Circles indicate biological replicates and cross bars reflect their mean. (A-C, F-H, K-M) * p < 0.05, ** p < 0.01, ***p < 0.001; t-test on means of replicates. See also Figure S3.
Figure 4.
Figure 4.. Reducing somatic IIS signaling during recovery from early-life starvation suppresses gonad abnormalities.
(A) Frequency of all gonad abnormalities in worms starved for 8 d and recovered in ad libitum (AL), dietary restriction (DR), or dauer-forming followed by AL conditions (Dauer to AL); at least 40 worms per condition per replicate. (B) Frequency of all gonad abnormalities in control or starved worms of the given genotype; at least 38 animals per condition per replicate. (C) Frequency of all gonad abnormalities in starved wild type and skn-1 gain-of-function mutants raised on the indicated RNAi; at least 50 worms per condition per replicate. (D) Representative images of starved worms raised on gfp or daf-2 RNAi. Visible portions of the gonad and uterus are outlined with a dashed white line. Scale bar is 50 microns. (E, F) Frequency of all gonad abnormalities in starved worms raised on the indicated single or double RNAi (E) or given genotype raised on the indicated RNAi (F); at least 50 worms per condition per replicate. (G) Transgenic rescue of daf-16; frequency of all gonad abnormalities in starved worms of the given genotype; at least 50 worms per condition per replicate. Pdaf-16 is an overexpression (gain-of-function) line. Pcol-12, Pges-1 and Punc-119 drive expression exclusively in the epidermis, intestine and nervous system, respectively. daf-16(mu86) null mutants without transgenic rescue do not survive 8 days of L1 starvation. Therefore, these animals were starved for three days; other genotypes were starved for eight days. Asterisks indicate comparisons between wild type and the other genotypes fed empty vector. Pound signs indicate comparisons within genotypes between empty vector and daf-2 RNAi; #p < 0.05, ## < 0.01, ### < 0.001; t-test. (H) Frequency of abnormally shaped embryos produced by starved worms of the given genotype or RNAi treatment; C = control, S = starved; at least 100 embryos per condition per replicate. (A-C, E-H) Circles indicate biological replicates and cross bars reflect their means. *p < 0.05, ** < 0.01, *** < 0.001; t-test on means of replicates. (I) Circles indicate individual brood sizes from five biological replicates of ~18 individuals per condition per replicate; cross bars reflect the mean of all individuals. A linear mixed-effect model was fit to all data with RNAi and length of starvation as fixed effects and biological replicate as a random effect. ***interaction p-value < 0.001. (J) A model of how IIS and vitellogenin provisioning mediate intergenerational adaptation to nutrient stress is presented. See also Figure S4.

Comment in

References

    1. Baugh LR (2013). To grow or not to grow: nutritional control of development during Caenorhabditis elegans L1 arrest. Genetics 194, 539–555. - PMC - PubMed
    1. Jobson MA, Jordan JM, Sandrof MA, Hibshman JD, Lennox AL, and Baugh LR (2015). Transgenerational Effects of Early Life Starvation on Growth, Reproduction, and Stress Resistance in Caenorhabditis elegans. Genetics 201, 201–212. - PMC - PubMed
    1. Lee I, A H., J Kim, J Yoshimoto, Y You (2012). Metabolic Rate Regulates L1 Longevity in C. elegans. PloS one 7. - PMC - PubMed
    1. Hibshman JD, Hung A, and Baugh LR (2016). Maternal Diet and Insulin-Like Signaling Control Intergenerational Plasticity of Progeny Size and Starvation Resistance. PLoS Genet 12, e1006396. - PMC - PubMed
    1. Roy D, Kahler DJ, Yun C, and Hubbard EJA (2018). Functional Interactions Between rsks-1/S6K, glp-1/Notch, and Regulators of Caenorhabditis elegans Fertility and Germline Stem Cell Maintenance. G3 (Bethesda). - PMC - PubMed

Publication types

MeSH terms