

The Modulation of Gamma Oscillations by Methamphetamine in Rat Hippocampal Slices
- PMID: 31281244
- PMCID: PMC6598082
- DOI: 10.3389/fncel.2019.00277
The Modulation of Gamma Oscillations by Methamphetamine in Rat Hippocampal Slices
Abstract
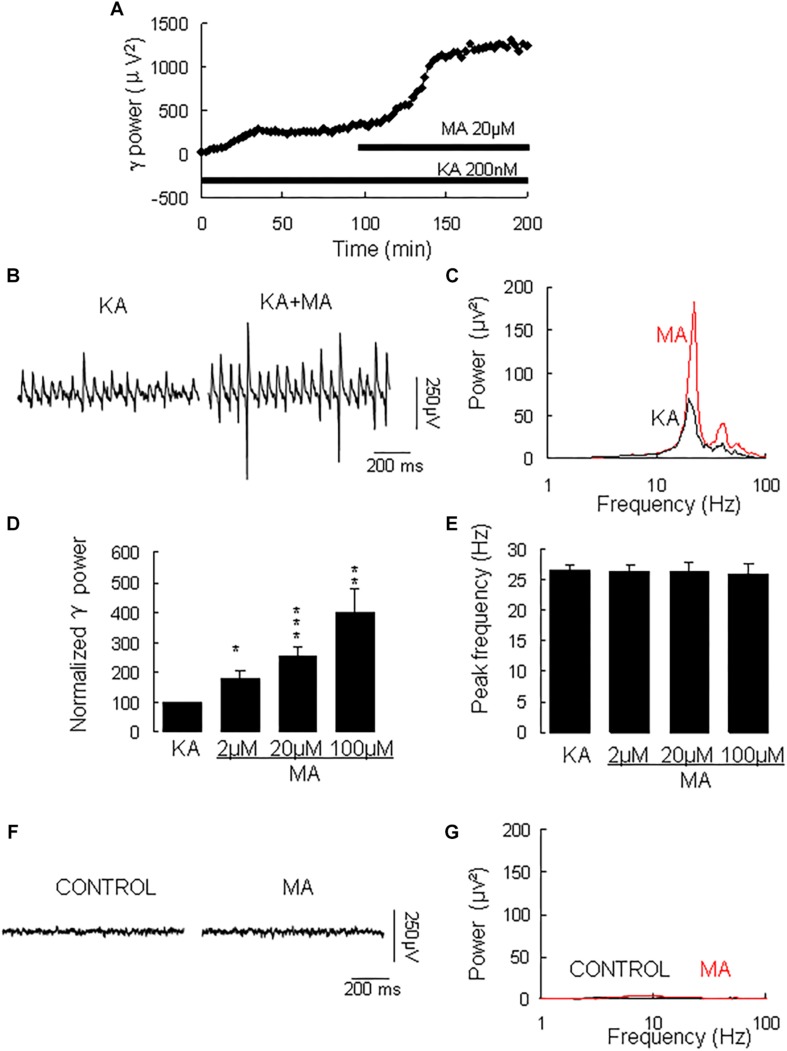
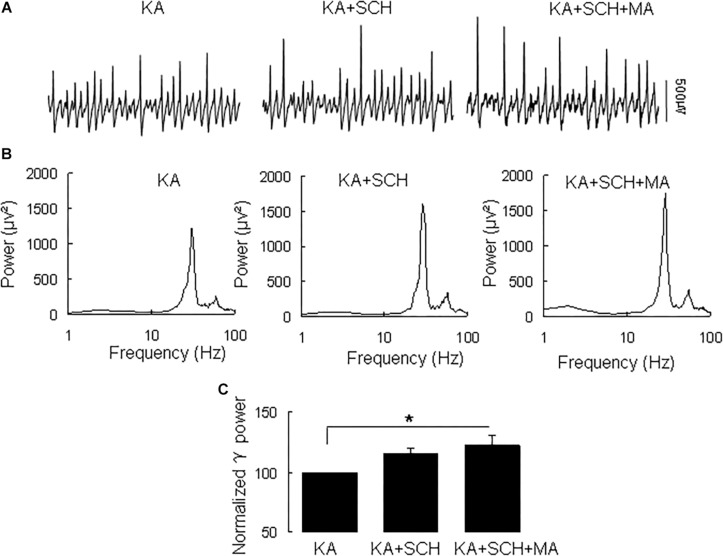
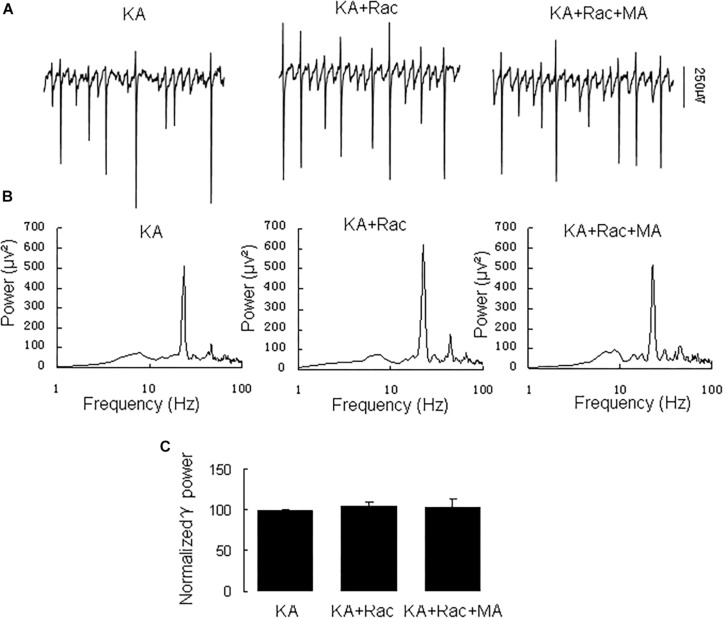
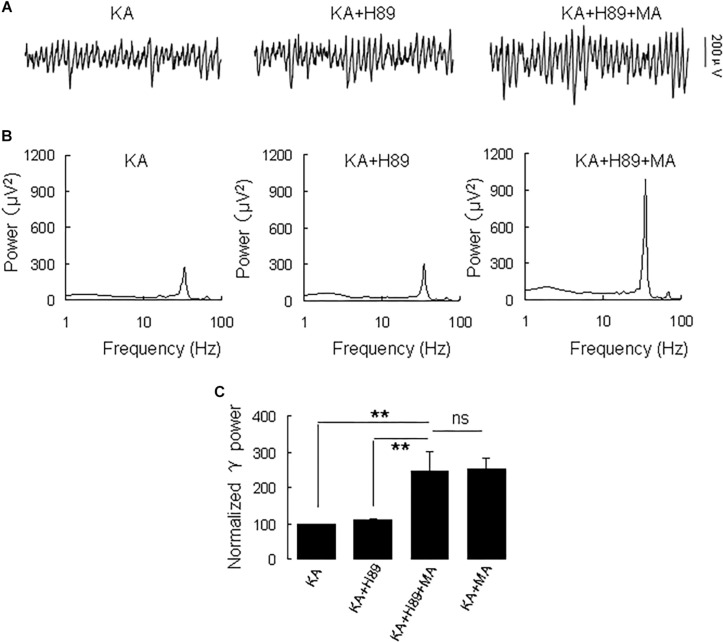
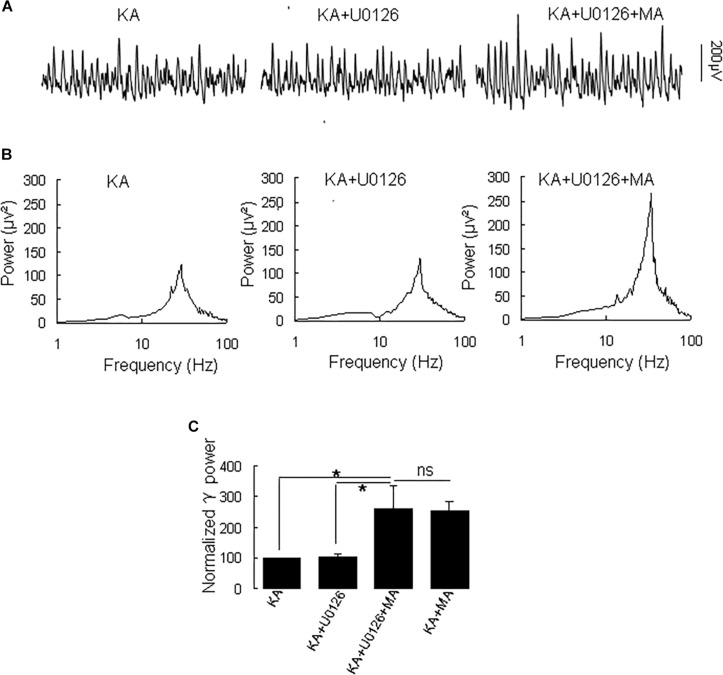
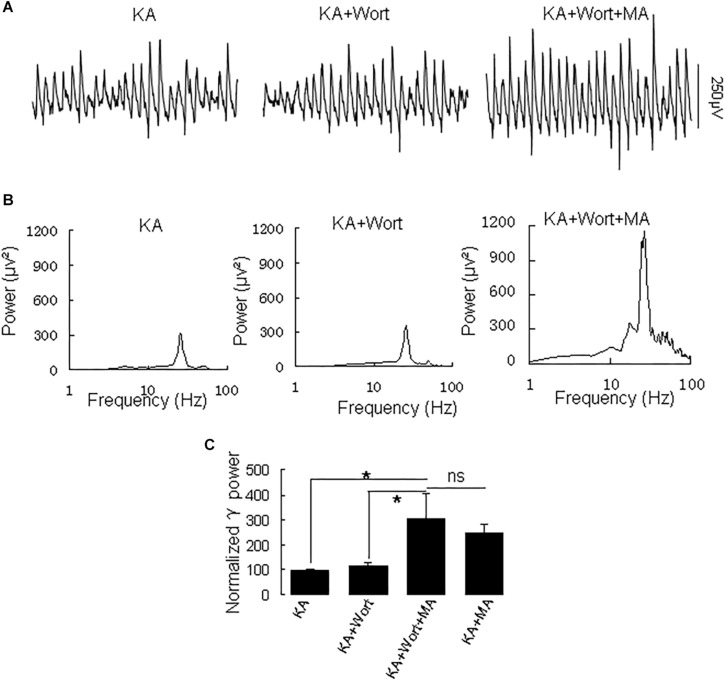
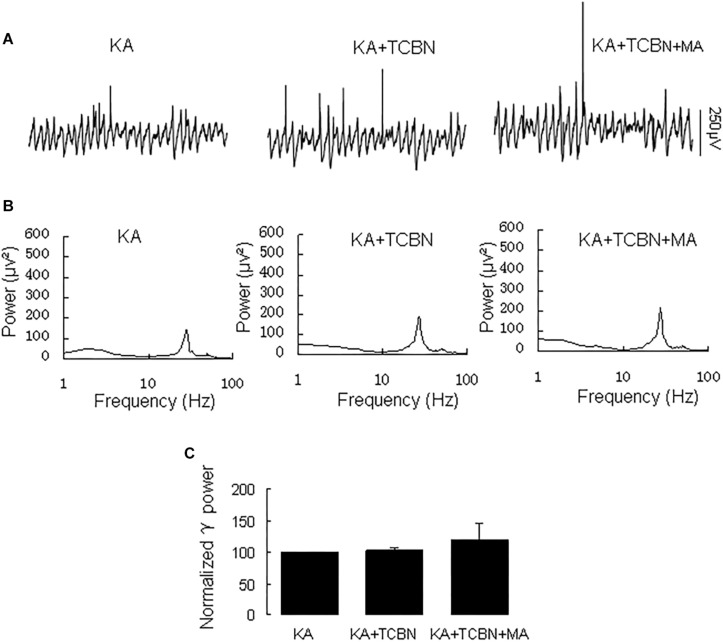
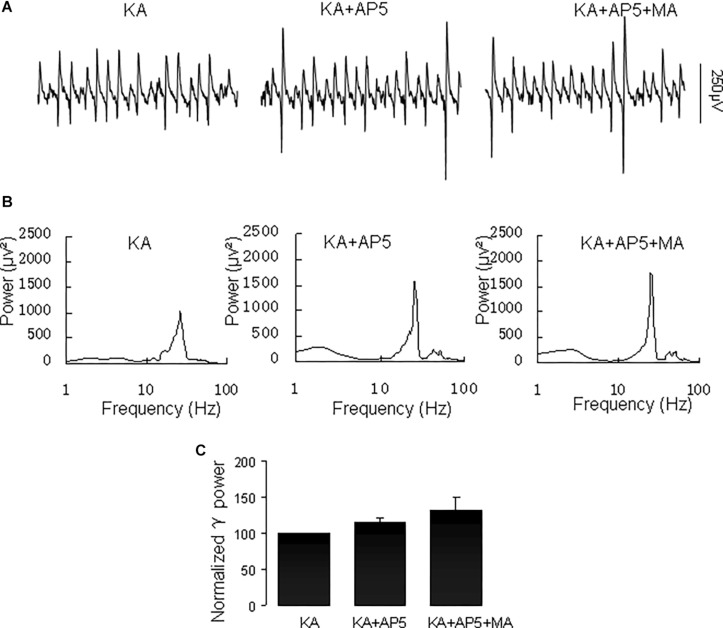
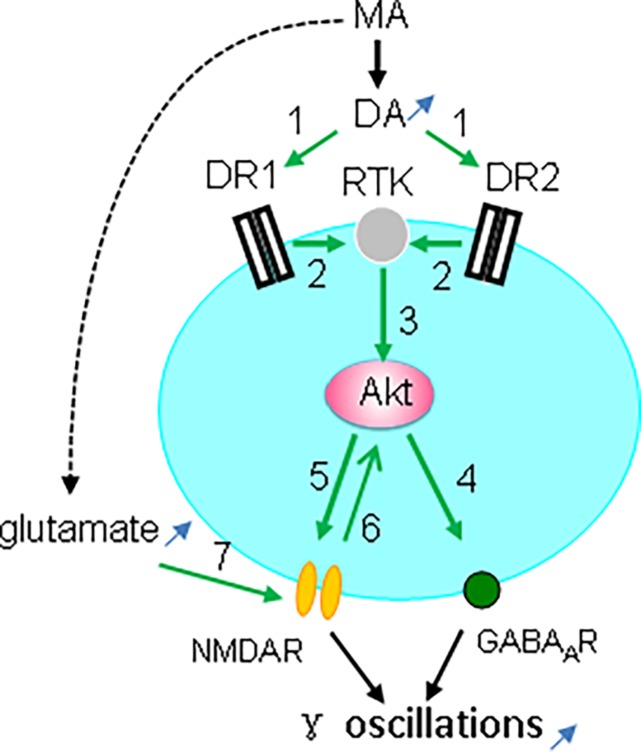
Gamma frequency oscillations (γ, 30-100 Hz) have been suggested to underlie various cognitive and motor functions. The psychotomimetic drug methamphetamine (MA) enhances brain γ oscillations associated with changes in psychomotor state. Little is known about the cellular mechanisms of MA modulation on γ oscillations. We explored the effects of multiple intracellular kinases on MA modulation of γ induced by kainate in area CA3 of rat ventral hippocampal slices. We found that dopamine receptor type 1 and 2 (DR1 and DR2) antagonists, the serine/threonine kinase PKB/Akt inhibitor and N-methyl-D-aspartate receptor (NMDAR) antagonists prevented the enhancing effect of MA on γ oscillations, whereas none of them affected baseline γ strength. Protein kinase A, phosphoinositide 3-kinase and extracellular signal-related kinases inhibitors had no effect on MA. We propose that the DR1/DR2-Akt-NMDAR pathway plays a critical role for the MA enhancement of γ oscillations. Our study provides an new insight into the mechanisms of acute MA on MA-induced psychosis.
Keywords: Akt/PKB; DR; NMDAR; hippocampus; methamphetamine; γ oscillation.
Figures
Similar articles
-
Multiple Kinases Involved in the Nicotinic Modulation of Gamma Oscillations in the Rat Hippocampal CA3 Area.Front Cell Neurosci. 2017 Mar 6;11:57. doi: 10.3389/fncel.2017.00057. eCollection 2017. Front Cell Neurosci. 2017. PMID: 28321180 Free PMC article.
-
The Cellular Mechanisms of Dopamine Modulation on the Neuronal Network Oscillations in the CA3 Area of Rat Hippocampal Slices.Neuroscience. 2021 Nov 1;475:83-92. doi: 10.1016/j.neuroscience.2021.09.005. Epub 2021 Sep 14. Neuroscience. 2021. PMID: 34534635
-
Atorvastatin enhances kainate-induced gamma oscillations in rat hippocampal slices.Eur J Neurosci. 2016 Sep;44(5):2236-46. doi: 10.1111/ejn.13322. Epub 2016 Jul 17. Eur J Neurosci. 2016. PMID: 27336700
-
Significance of protein kinase C in the neuropsychotoxicity induced by methamphetamine-like psychostimulants.Neurochem Int. 2019 Mar;124:162-170. doi: 10.1016/j.neuint.2019.01.014. Epub 2019 Jan 14. Neurochem Int. 2019. PMID: 30654115 Review.
-
Kainate receptors and rhythmic activity in neuronal networks: hippocampal gamma oscillations as a tool.J Physiol. 2005 Jan 1;562(Pt 1):65-72. doi: 10.1113/jphysiol.2004.077388. Epub 2004 Oct 28. J Physiol. 2005. PMID: 15513934 Free PMC article. Review.
Cited by
-
Modulation of Hippocampal Gamma Oscillations by Dopamine in Heterozygous Reeler Mice in vitro.Front Cell Neurosci. 2020 Feb 11;13:586. doi: 10.3389/fncel.2019.00586. eCollection 2019. Front Cell Neurosci. 2020. PMID: 32116553 Free PMC article.
-
Differential Effects of Chronic Methamphetamine Treatment on High-Frequency Oscillations and Responses to Acute Methamphetamine and NMDA Receptor Blockade in Conscious Mice.Brain Sci. 2022 Nov 5;12(11):1503. doi: 10.3390/brainsci12111503. Brain Sci. 2022. PMID: 36358429 Free PMC article.
-
Enhanced Interplay of Neuronal Coherence and Coupling in the Dying Human Brain.Front Aging Neurosci. 2022 Feb 22;14:813531. doi: 10.3389/fnagi.2022.813531. eCollection 2022. Front Aging Neurosci. 2022. PMID: 35273490 Free PMC article.
-
Activation of Dopamine 4 Receptor Subtype Enhances Gamma Oscillations in Hippocampal Slices of Aged Mice.Front Aging Neurosci. 2022 Mar 16;14:838803. doi: 10.3389/fnagi.2022.838803. eCollection 2022. Front Aging Neurosci. 2022. PMID: 35370600 Free PMC article.
References
-
- Balleza-Tapia H., Crux S., Andrade-Talavera Y., Dolz-Gaiton P., Papadia D., Chen G., et al. (2018). TrpV1 receptor activation rescues neuronal function and network gamma oscillations from Abeta-induced impairment in mouse hippocampus in vitro. eLife 7:e37703. 10.7554/eLife.37703 - DOI - PMC - PubMed
LinkOut - more resources
Full Text Sources
Miscellaneous