. 2019 Jul;18(1):566-572.
doi: 10.3892/etm.2019.7654. Epub 2019 Jun 10.

Effects of enhanced environment and induced depression on cuprizone mouse model of demyelination

Affiliations

Effects of enhanced environment and induced depression on cuprizone mouse model of demyelination

Ayman Mohamed et al. Exp Ther Med. 2019 Jul.

Abstract

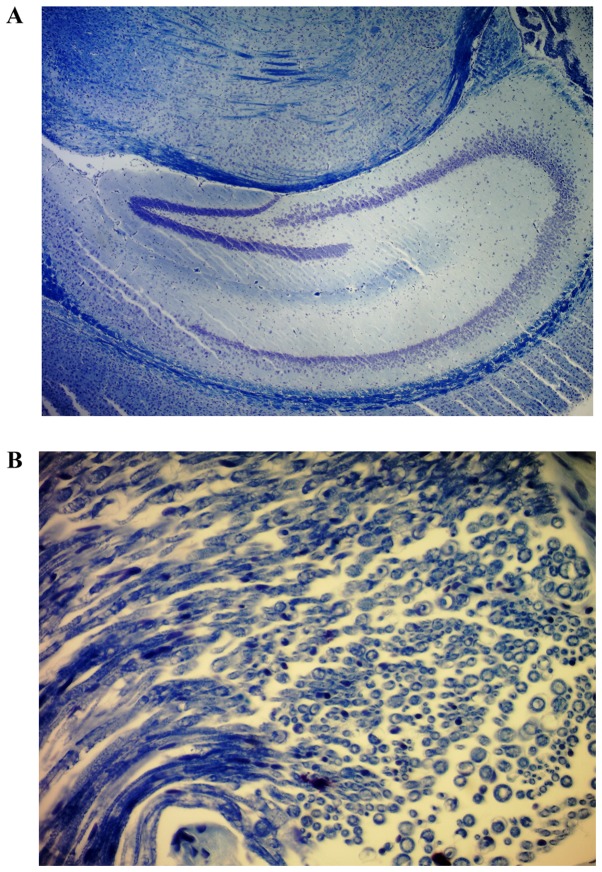
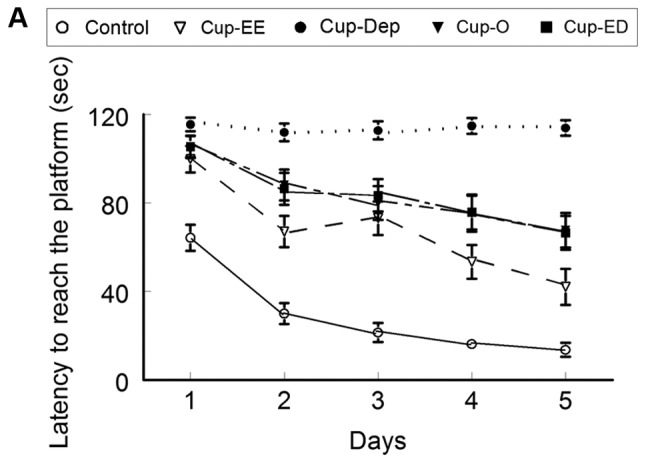
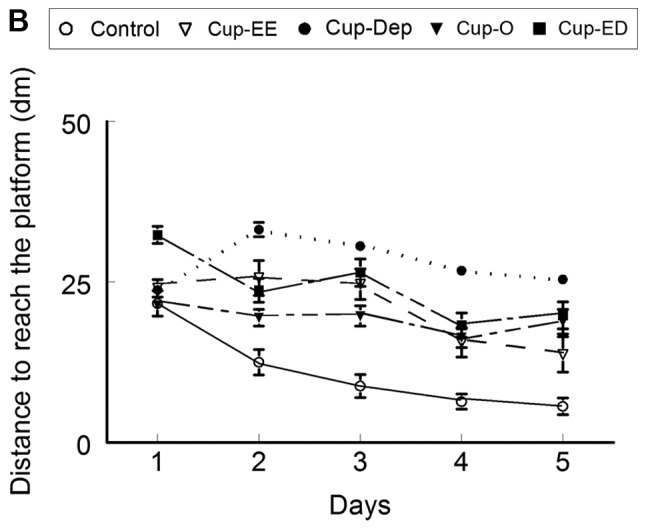
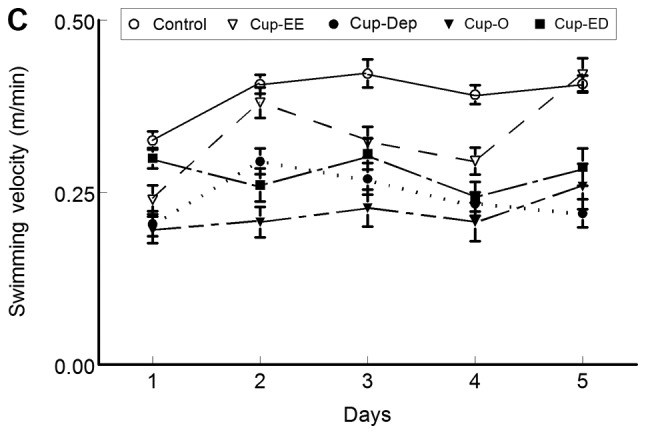
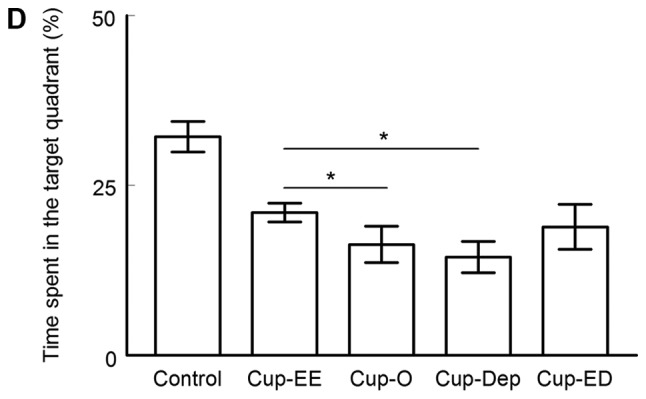
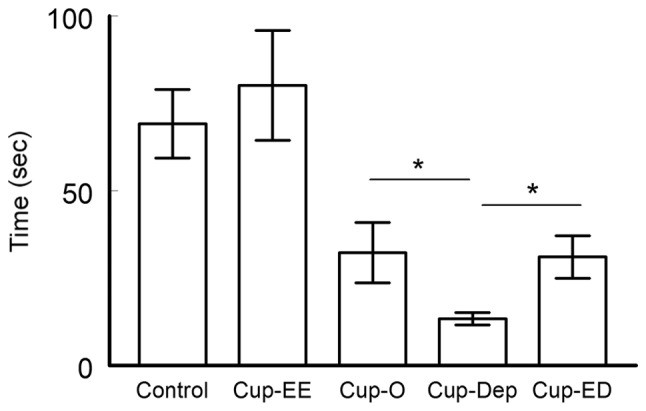
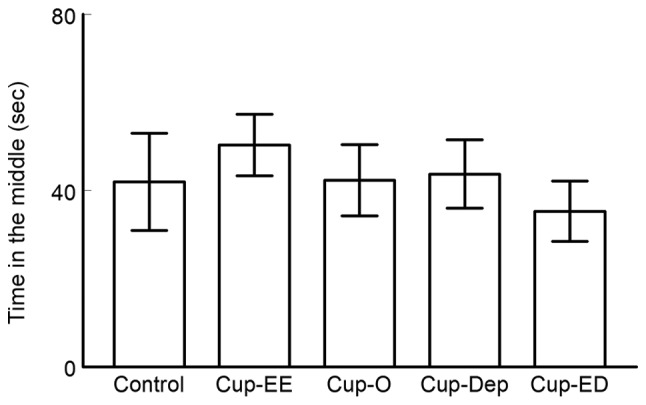
Impairment in cognition and motor activity are commonly encountered in patients affected by multiple sclerosis (MS), and depression is believed to be a contributing factor. The aim of the present study was to investigate the impact of induced depression on a cuprizone mouse model of demyelination and the effectiveness of enhanced environment (EE) as a method of intervention. C57BL/6 male mice were divided into five groups: Cuprizone only (Cup-O), cuprizone undergoing depression (Cup-Dep), cuprizone housed in EE (Cup-EE), cuprizone housed in EE and undergoing depression (Cup-ED) and the control (n=9-10 per group). Depression was induced by repeated open-space forced swim. Neurobehavioral tests were conducted following a 6-week period of 0.2% cuprizone-enriched diet. The Cup-EE group performed significantly better in terms of cognition and motor functions, when compared with the Cup-O group, as evidenced by the Morris water maze (MWM; P<0.001) and rotarod performance test (P<0.05) results. Conversely, the Cup-Dep group exhibited a significant decline in performance in the MWM (P<0.001) and rotarod performance test (P<0.05), when compared with the Cup-O group. The Cup-ED group had comparable results to those of the Cup-O group, indicating a reversal of the induced depression effects. Open field test results failed to show an anxiety-like behavior in the cuprizone mouse model. It was therefore concluded that EE can improve MS-associated cognitive and motor deficits. Insights gained from these results facilitate the exploration of non-medical modes of intervention as an emerging adjuvant therapy in MS.

Keywords: anxiety; cuprizone; demyelination; depression; environment enhancement; motor coordination; multiple sclerosis; water maze.


Figures

Figure 1.
Figure 1.
Hippocampal demyelination in cuprizone-treated mice. Mice were treated with cuprizone-enriched diet. Cross-sections (5 µm thick) from hippocampus were stained for myelin with LFB. (A) Hippocampal demyelination (magnification, ×400). (B) Hippocampal demyelination (magnification, ×100).
Figure 2.
Figure 2.
MWM. The cuprizone mouse model showed different levels of cognitive deficits based on the method of intervention. (A) Latency (sec) to reach the platform. (B) distance (dm) travelled to reach the platform throughout testing period (days). On day 5, cuprizone groups performed significantly worse than the control, as they had increased latencies and travelled a longer distance to reach the platform. Cup-EE performed better than the other cuprizone groups on day 5 (P<0.0001). Cup-Dep had the highest latency throughout the testing period and travelled the longest distance on days 2–5 (P<0.001). Cup-ED exhibited similar latencies and distance travelled to Cup-O (P>0.05). (C) Swimming velocity (m/sec) during testing period (days). The control group was relatively faster than the cuprizone group on days 1–4. Swimming velocity in the cuprizone groups varied during the testing period. No significant differences were observed among the groups (P>0.05). (D) Bar graph depicting the percentage of time spent in the target quadrant during the probe trial. None of the cuprizone groups exhibited a learning behavior, as they spent <25% of the time in the target quadrant. Cup-EE spent significantly more time in the target quadrant than Cup-Dep and Cup-O (*P<0.05), indicating better performance. The results of Cup-ED were comparable to those of Cup-O (P>0.05). MWM, Morris water maze.
Figure 2.
Figure 2.
MWM. The cuprizone mouse model showed different levels of cognitive deficits based on the method of intervention. (A) Latency (sec) to reach the platform. (B) distance (dm) travelled to reach the platform throughout testing period (days). On day 5, cuprizone groups performed significantly worse than the control, as they had increased latencies and travelled a longer distance to reach the platform. Cup-EE performed better than the other cuprizone groups on day 5 (P<0.0001). Cup-Dep had the highest latency throughout the testing period and travelled the longest distance on days 2–5 (P<0.001). Cup-ED exhibited similar latencies and distance travelled to Cup-O (P>0.05). (C) Swimming velocity (m/sec) during testing period (days). The control group was relatively faster than the cuprizone group on days 1–4. Swimming velocity in the cuprizone groups varied during the testing period. No significant differences were observed among the groups (P>0.05). (D) Bar graph depicting the percentage of time spent in the target quadrant during the probe trial. None of the cuprizone groups exhibited a learning behavior, as they spent <25% of the time in the target quadrant. Cup-EE spent significantly more time in the target quadrant than Cup-Dep and Cup-O (*P<0.05), indicating better performance. The results of Cup-ED were comparable to those of Cup-O (P>0.05). MWM, Morris water maze.
Figure 3.
Figure 3.
Rotarod performance test as a measure of motor coordination. Bar graph plots the time (sec) spent on the rotating rod when tested at a constant speed (4.5 m/min). No significant difference was observed between the control and Cup-EE groups (P>0.05). Cup-EE spent significantly more time on the rotating rod than other cuprizone groups (*P<0.05), indicating that EE improved motor coordination. Cup-Dep had significantly worse results than both Cup-O and cup-ED (*P<0.05). EE, enhanced environment.
Figure 4.
Figure 4.
Behavioral changes measured by OFT. Bar graph illustrating the time spent in the central zone (sec) of the arena. All groups spent comparable time in the central zone without any significant differences observed among the control and cuprizone groups (P>0.05). This indicates the absence of anxiety-like behavioral changes in the cuprizone groups. OFT, open field test.

References

    1. Beer S, Khan F, Kesselring J. Rehabilitation interventions in multiple sclerosis: An overview. J Neurol. 2012;259:1994–2008. doi: 10.1007/s00415-012-6577-4. - DOI - PubMed
    1. Langdon DW, Amato MP, Boringa J, Brochet B, Foley F, Fredrikson S, Hämäläinen P, Hartung HP, Krupp L, Penner IK, et al. Recommendations for a Brief International Cognitive Assessment for Multiple Sclerosis (BICAMS) Mult Scler. 2012;18:891–898. doi: 10.1177/1352458511431076. - DOI - PMC - PubMed
    1. Amato MP, Zipoli V, Portaccio E. Multiple sclerosis-related cognitive changes: A review of cross-sectional and longitudinal studies. J Neurol Sci. 2006;245:41–46. doi: 10.1016/j.jns.2005.08.019. - DOI - PubMed
    1. Cioncoloni D, Innocenti I, Bartalini S, Santamecchi E, Rossi S, Rossi A, Ulivelli M. Individual factors enhance poor health-related quality of life outcome in multiple sclerosis patients. Significance of predictive determinants. J Neurol Sci. 2014;345:213–219. doi: 10.1016/j.jns.2014.07.050. - DOI - PubMed
    1. Salter A, Thomas N, Tyry T, Cutter G, Marrie RA. Employment and absenteeism in working-age persons with multiple sclerosis. J Med Econ. 2017;20:493–502. doi: 10.1080/13696998.2016.1277229. - DOI - PubMed