. 2019 May 31;9(13):3687-3706.
doi: 10.7150/thno.33684. eCollection 2019.

Targeting mitochondrial dynamics by regulating Mfn2 for therapeutic intervention in diabetic cardiomyopathy

Affiliations

Targeting mitochondrial dynamics by regulating Mfn2 for therapeutic intervention in diabetic cardiomyopathy

Lang Hu et al. Theranostics. .

Abstract

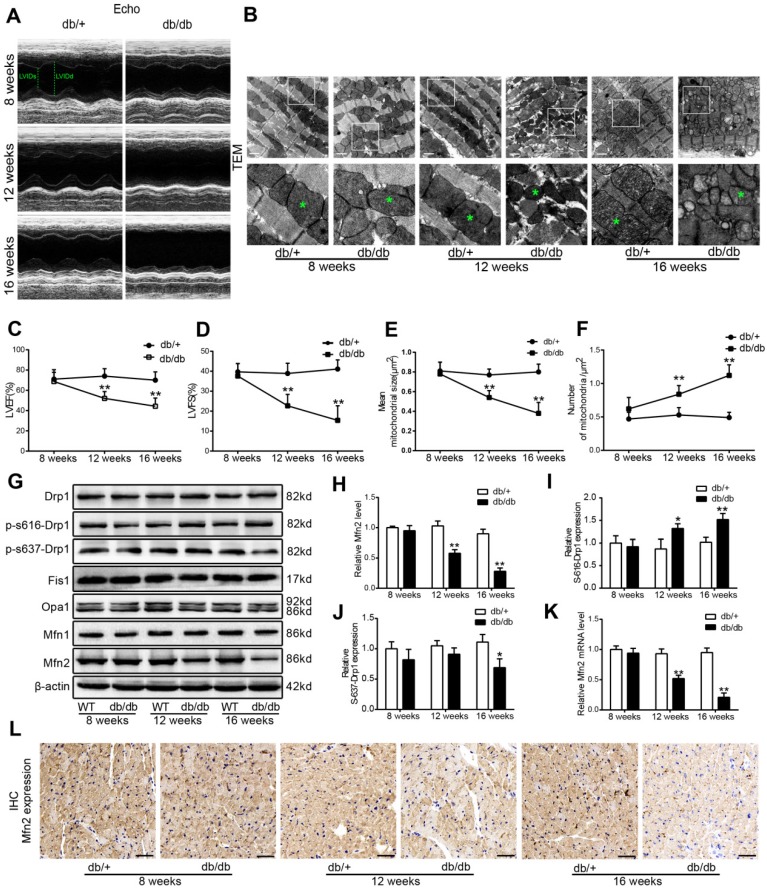
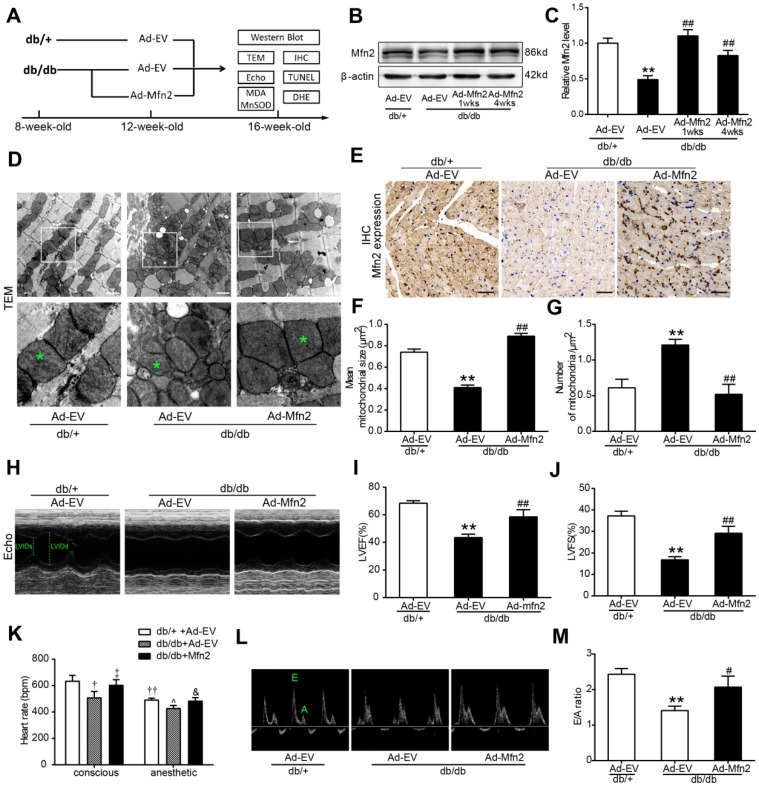
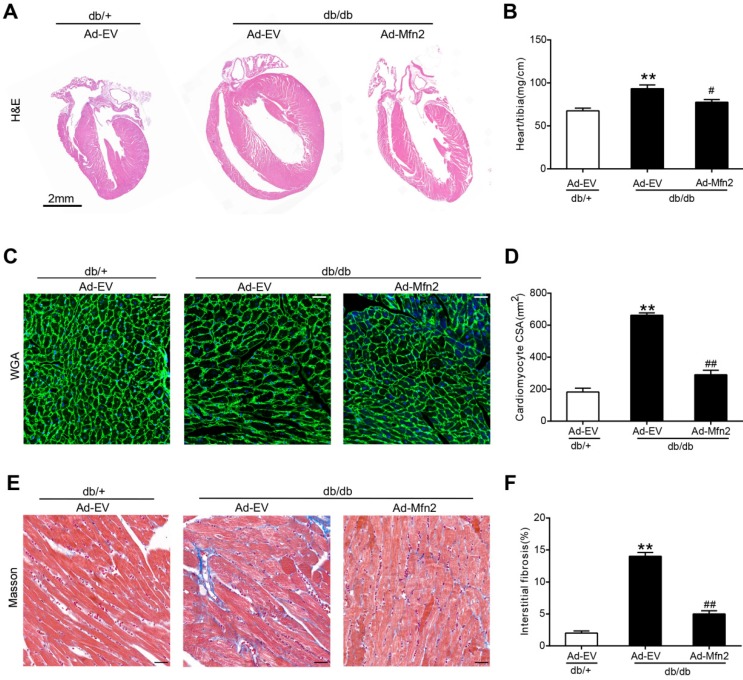
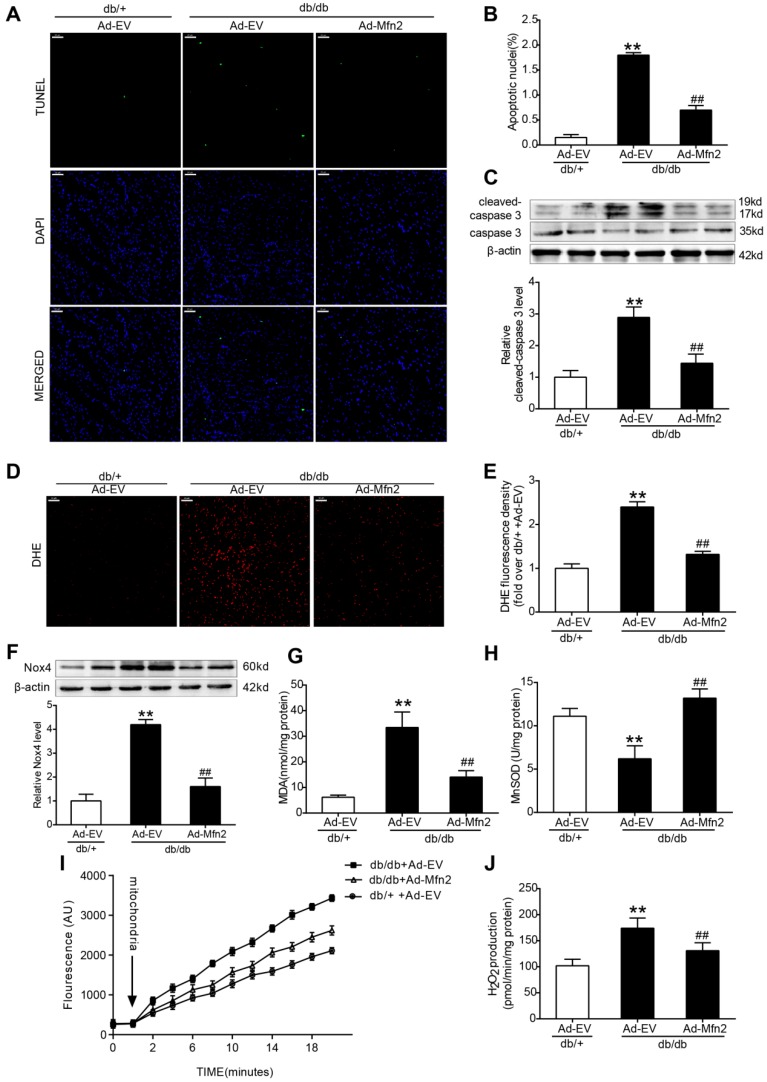
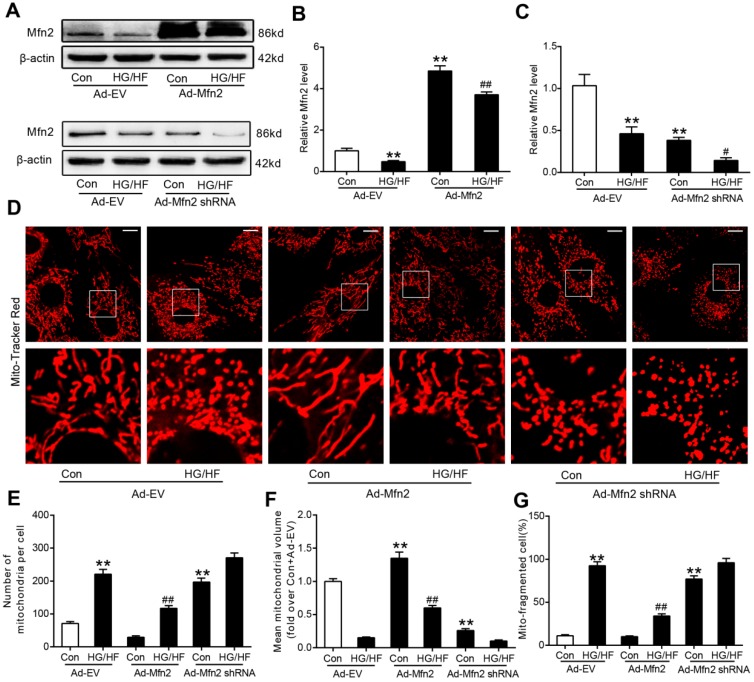
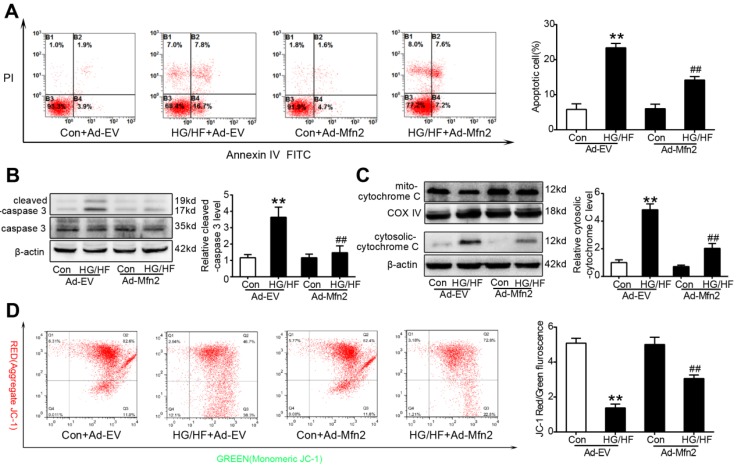
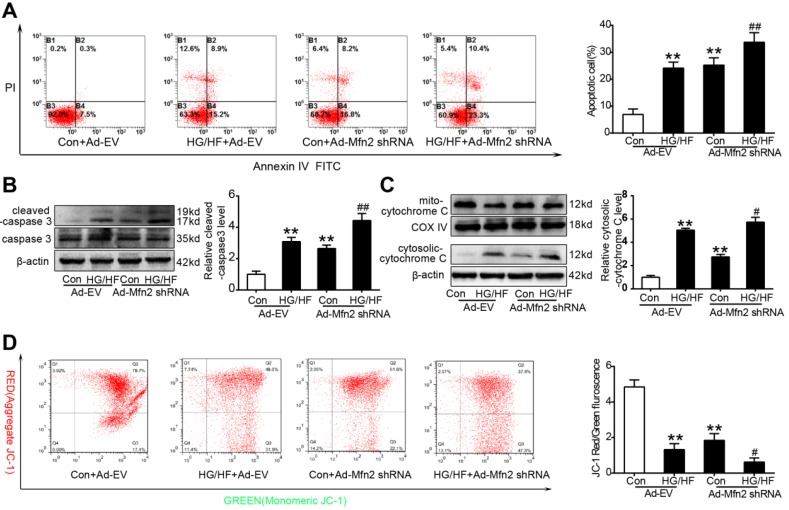
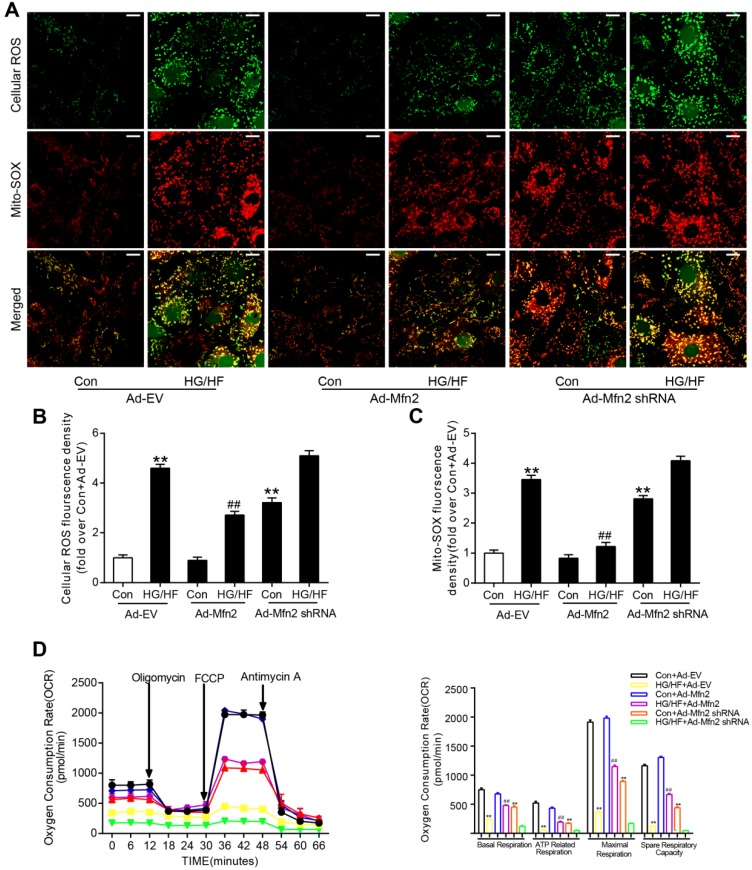
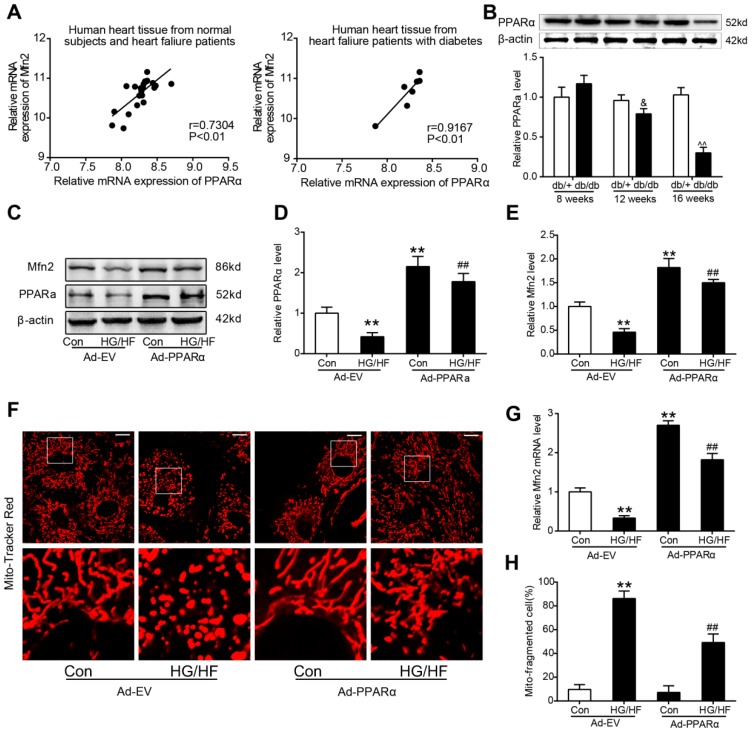
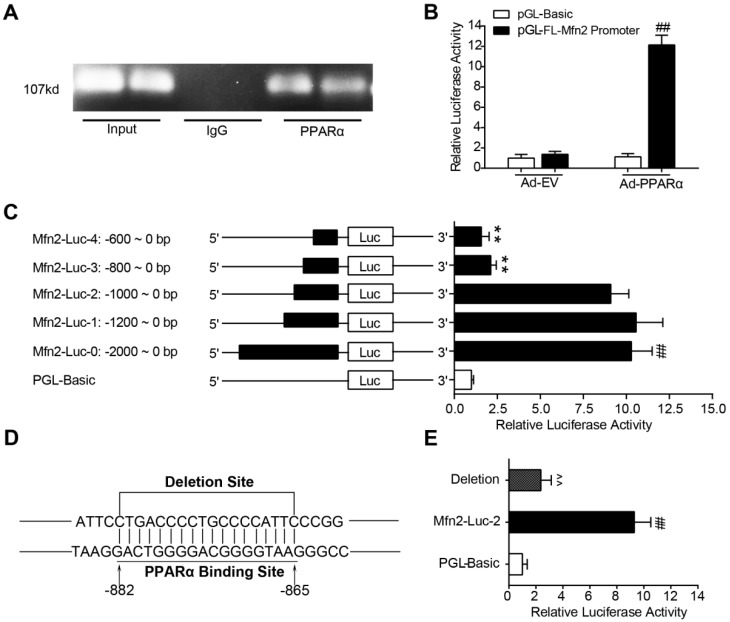
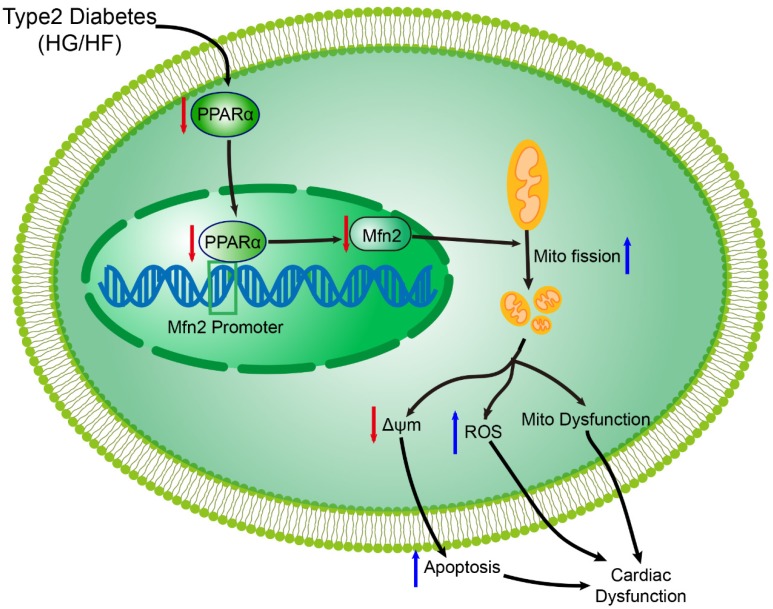
Increasing evidence has implicated the important role of mitochondrial pathology in diabetic cardiomyopathy (DCM), while the underlying mechanism remains largely unclear. The aim of this study was to investigate the role of mitochondrial dynamics in the pathogenesis of DCM and its underlying mechanisms. Methods: Obese diabetic (db/db) and lean control (db/+) mice were used in this study. Mitochondrial dynamics were analyzed by transmission electron microscopy in vivo and by confocal microscopy in vitro. Results: Diabetic hearts from 12-week-old db/db mice showed excessive mitochondrial fission and significant reduced expression of Mfn2, while there was no significant alteration or slight change in the expression of other dynamic-related proteins. Reconstitution of Mfn2 in diabetic hearts inhibited mitochondrial fission and prevented the progression of DCM. In an in-vitro study, cardiomyocytes cultured in high-glucose and high-fat (HG/HF) medium showed excessive mitochondrial fission and decreased Mfn2 expression. Reconstitution of Mfn2 restored mitochondrial membrane potential, suppressed mitochondrial oxidative stress and improved mitochondrial function in HG/HF-treated cardiomyocytes through promoting mitochondrial fusion. In addition, the down-regulation of Mfn2 expression in HG/HF-treated cardiomyocytes was induced by reduced expression of PPARα, which positively regulated the expression of Mfn2 by directly binding to its promoter. Conclusion: Our study provides the first evidence that imbalanced mitochondrial dynamics induced by down-regulated Mfn2 contributes to the development of DCM. Targeting mitochondrial dynamics by regulating Mfn2 might be a potential therapeutic strategy for DCM.

Keywords: Diabetic cardiomyopathy; Mfn2; Mitochondrial dynamics; Mitochondrial dysfunction; PPARα.


Conflict of interest statement

Competing Interests: The authors have declared that no competing interest exists.

Figures

Figure 1
Figure 1
Excessive mitochondrial fission and reduced Mfn2 expression were observed in diabetic hearts of 12-week-old db/db mice. (A) Representative echocardiography images. LVIDd and LVIDs were labeled. (B) Representative transmission electron microscopic images of the myocardium, mitochondria were labeled by asterisks. Scale bar = 1 μm. (C) LVEF, left ventricular ejection fraction (D) LVFS, left ventricular fractional shortening. (E) Mean size of mitochondria. (F) The number of mitochondria per um2. (G) Representative blot images of mitochondrial fission-related proteins (Drp1 and Fis1) and fusion-related proteins (Opa1, Mfn1 and Mfn2). (H) Quantitative analysis of Mfn2 protein expression. (I) Quantitative analysis of S-616-Drp1 protein expression. (J) Quantitative analysis of S-637-Drp1 protein expression. (K) Real-time PCR analysis of Mfn2 mRNA expression. (L) Representative immunohistochemical stains of Mfn2 in mouse hearts. Scale bars = 50 μm. * P<0.05 vs. db/+; **P<0.01 vs. db/+. n = 8 animals.
Figure 2
Figure 2
Reconstitution of Mfn2 prevents mitochondrial fission and DCM in db/db mice (A) Schematic representation of the experimental protocols. (B, C) Representative blot images and quantitative analysis of Mfn2 expression. (D) Representative transmission electron microscopic images of the myocardium, mitochondria were labeled by asterisks. Scale bars=1 μm. (E) Representative immunohistochemical stains of Mfn2 in mouse hearts. Scale bars = 50 μm. (F) Mean area of mitochondria. (G) The number of mitochondria per um2. (H) Representative M-mode echocardiography images. LVIDs and LVIDd were labeled. (I) LVEF, left ventricular ejection fraction (J) LVFS, left ventricular fractional shortening. (K) Heart rate of db/+ and db/db mice under conscious or anesthetic condition. (L) Representative Doppler echocardiography images. (M) E/A ratio. Ad-EV, control adenovirus; Ad-Mfn2, recombinant adenovirus encoding Mfn2. **P<0.01 vs. db/+ + Ad-EV. ##P<0.01 vs. db/db + Ad-EV. †P<0.05 vs. db/+ + Ad-EV (conscious). ††P<0.01 vs. db/+ + Ad-EV (conscious). ‡ P<0.05 vs. db/db + Ad-EV (conscious). ^ P<0.05 vs. db/+ + Ad-EV (anesthetic). &P<0.05 vs. db/db + Ad-EV (anesthetic). n = 8 animals.
Figure 3
Figure 3
Reconstitution of Mfn2 alleviated cardiac hypertrophy and fibrosis in diabetic db/db mice. (A) The gross morphology of hearts stained by hematoxylin and eosin staining. Scale bar = 2mm. (B) The ratio of heart weight to tibia length. (C, D) Representative images of wheat germ agglutinin staining and quantitative analysis of the cross-sectional area of cardiomyocytes. Scale bar= 20 μm. (E, F) Representative images of Masson trichrome staining of hearts and quantitative analysis of interstitial fibrosis. Scale bars=25 μm. Ad-EV, control adenovirus; Ad-Mfn2, recombinant adenovirus encoding Mfn2; CSA, cross-sectional area. **P<0.01 vs. db/+ + Ad-EV. #P<0.05 vs. db/db + Ad-EV. ##P<0.01 vs. db/db + Ad-EV. n=8 animals.
Figure 4
Figure 4
Reconstitution of Mfn2 inhibited cell apoptosis and oxidative stress in diabetic hearts. (A) Representative photomicrographs of TUNEL-stained and DAPI-stained heart sections. Green fluorescence shows TUNEL-positive nuclei; Blue fluorescence shows nuclei of total cardiomyocytes (DAPI-positive). Scale bar = 50 μm. (B) Percentage of TUNEL-positive nuclei. (C) Representative blot images and quantitative analysis of cleaved-caspase 3 and total caspase 3. (D) Representative microphotographs of DHE staining in heart sections. Scale bar=50 μm. (E) Quantitative analysis of DHE fluorescence density (fold over db/+ +Ad-EV). (F) Representative blot images and quantitative analysis of Nox4 protein expression. (G) Myocardial malondialdehyde (MDA) content. (H) Mitochondrial manganese superoxide dismutase (MnSOD) activity. (I) Time-dependent increase of mitochondrial ROS related fluorescence density. (J) Isolated mitochondrial H2O2 production. Ad-EV, control adenovirus; Ad-Mfn2, recombinant adenovirus encoding Mfn2. **P<0.01 vs. db/+ +Ad-EV. ##P<0.01 vs. db/db+Ad-EV. n=6-8 animals.
Figure 5
Figure 5
Mfn2 overexpression prevented HG/HF-induced mitochondrial fission, whereas Mfn2 knockdown caused mitochondrial fission in cardiomyocytes. (A) Representative blot images of Mfn2. (B, C) Quantitative analysis of Mfn2 protein expression. (D) Representative confocal microscope images showing mitochondrial morphology stained by MitoTracker Red. Original magnification ×600. (E) The number of mitochondria per cell. (F) Mean volume of mitochondria (fold over Con+Ad-EV). (G) The percentage of cells with fragmented mitochondria. Ad-EV, control adenovirus; Ad-Mfn2, recombinant adenovirus encoding Mfn2; Ad-Mfn2-shRNA, recombinant adenovirus encoding short hairpin RNA against Mfn2; HG/HF, high-glucose and high-fat medium (25 mmol/L glucose and 500 μmol/L palmitate). **P<0.01 vs. con + Ad-EV. #P<0.05, ##P<0.01 vs. HG/HF + Ad-EV. n = 6 in each group.
Figure 6
Figure 6
Mfn2 overexpression preserved mitochondrial membrane potential and inhibited mitochondria-dependent apoptosis in HG/HF-treated cardiomyocytes. (A) Flow cytometry analysis of apoptosis by annexin V and PI staining (left) and quantification of apoptotic cells (right) in primary cardiomyocytes. (B) Representative blot images and quantitative analysis of cleaved-caspase 3 expression. (C) Representative blot images and quantitative analysis of cytosolic cytochrome c expression. (D) Flow cytometry analysis (left) and quantification (right) of mitochondrial membrane potential by JC-1 in primary cardiomyocytes. High levels of green fluorescence (x-axis) represent reduced ΔΨm, and high levels of red fluorescence (y-axis) show increased ΔΨm. A decrease in the red/green fluorescence is indicative of loss of ΔΨm. Ad-EV, control adenovirus; Ad-Mfn2, recombinant adenovirus encoding Mfn2; HG/HF, high-glucose and high-fat medium (25 mmol/L glucose and 500 μmol/L palmitate). **P<0.01 vs. Con + Ad-EV. ##P<0.01 vs. HG/HF + Ad-EV. n = 6 in each group.
Figure 7
Figure 7
Mfn2 knockdown decreased mitochondrial membrane potential and induced mitochondria-dependent apoptosis in control normal cardiomyocytes. (A) Flow cytometry analysis of apoptosis by annexin V and PI staining (left) and quantification of apoptotic cells (right) in primary cardiomyocytes. (B) Representative blot images and quantitative analysis of cleaved-caspase 3 expression. (C) Representative blot images and quantitative analysis of cytosolic cytochrome c expression. (D) Flow cytometry analysis (left) and quantification (right) of mitochondrial membrane potential by JC-1 in primary cardiomyocytes. High levels of green fluorescence (x-axis) represent reduced ΔΨm, and high levels of red fluorescence (y-axis) show increased ΔΨm. A decrease in the red/green fluorescence is indicative of loss of ΔΨm. Ad-EV, control adenovirus; Ad-Mfn2-shRNA, recombinant adenovirus encoding short hairpin RNA against Mfn2; HG/HF, high-glucose and high-fat medium (25 mmol/L glucose and 500 μmol/L palmitate). **P<0.01 vs. Con + Ad-EV. #P<0.05, ##P<0.01 vs. HG/HF + Ad-EV. n = 6 in each group.
Figure 8
Figure 8
Mfn2 overexpression protected against HG/HF-induced mitochondrial dysfunction, whereas Mfn2 knockdown induced mitochondrial dysfunction. (A) Representative confocal microscope images of intracellular ROS and mitochondria derived superoxide production. Original magnification ×600. (B) Quantitative analysis of intracellular ROS density in primary cardiomyocytes (fold over Con + Ad-EV). (C) Quantitative analysis of mitochondria derived superoxide production in primary cardiomyocytes (fold over Con + Ad-EV). (D) Oxygen consumption rate (OCR) and quantitative statistical analysis of OCR. Ad-EV, control adenovirus; Ad-Mfn2, recombinant adenovirus encoding Mfn2; Ad-Mfn2-shRNA, recombinant adenovirus encoding short hairpin RNA against Mfn2; HG/HF, high-glucose and high-fat medium (25 mmol/L glucose and 500 μmol/L palmitate). **P<0.01 vs. Con + Ad-EV, ##P<0.01 vs. HG/HF + Ad-EV. n = 6 in each group.
Figure 9
Figure 9
Overexpression of PPARα inhibited the down-regulation of Mfn2 and mitochondrial fission induced by HG/HF. (A) Correlations between the mRNA expression levels of PPARα and Mfn2 were evaluated in human hearts based on a public microarray expression data set (GSE26887). Left: 19 hearts from patients with heart failure and 5 nonfailing control hearts. Right: Only 7 hearts from type 2 diabetes patients with heart failure were included. (B) Representative blot images and quantitative analysis of PPARα protein expression in db/+ and db/db mice hearts. (C-E) Representative blot images and quantitative analysis of PPARα and Mfn2 protein expression in primary cardiomyocytes with treatment as indicated. (F) Representative confocal microscope images showing mitochondrial morphology stained by MitoTracker Red. Original magnification ×600. (G) Real-time PCR analysis of Mfn2 mRNA expression in primary cardiomyocytes with treatment as indicated. (H) The percentage of cells with fragmented mitochondria. Ad-EV, control adenovirus; Ad-PPARα, recombinant adenovirus encoding PPARα; HG/HF, high-glucose and high-fat medium (25 mmol/L glucose and 500 μmol/L palmitate). &P<0.05 vs. 12-week-old db/+; ^^P<0.01 vs. 16-week-old db/+; **P<0.01 vs. Con + Ad-EV; ##P<0.01 vs. HG/HF + Ad-EV. n = 6 in each group.
Figure 10
Figure 10
PPARα directly binds to the promoter of Mfn2 gene. (A) ChIP analysis for PPARα binding to the Mfn2 promoter in primary rat cardiomyocytes. (B) Responses of the Full-length Mfn2 promoter reporter to Ad-EV or Ad-PPARα. (C) Responses of the individual fragments of Mfn2 promoter to Ad-PPARα. (D) A schematic illustrates the deleted sequence of Mfn2 promoter region. (E) Responses of sequence deleted promoter of Mfn2 to Ad-PPARα. Ad-PPARα, recombinant adenovirus encoding PPARα; ##P<0.01 vs. pGL-Basic + Ad-PPARα; **P<0.01 vs. Mfn2-Luc-0; ^^P<0.01 vs. Mfn2-Luc-2. n = 6 in each group.
Figure 11
Figure 11
Schematic figure illustrating that imbalanced mitochondrial dynamics induced by decreased Mfn2 promotes mitochondrial dysfunction and diabetic cardiomyopathy. PPARα positively regulates Mfn2 expression by directly binding to its promoter. Type 2 diabetes (high-glucose and high-fat, HG/HF) reduces the expression of PPARα and then decreases the expression of Mfn2. Reduction of Mfn2 causes mitochondrial fission and subsequently leads to the mitochondria-derived ROS production, mitochondrial dysfunction and mitochondria-dependent apoptosis, which results in the development of diabetic cardiomyopathy. Reconstitution of Mfn2 reduces mitochondria-dependent apoptosis, suppresses mitochondria-derived ROS production, alleviates mitochondrial dysfunction and protects against diabetic cardiomyopathy. Mito, mitochondrial; ΔΨm, mitochondrial membrane potential.

Similar articles

Cited by

References

    1. Wild S, Roglic G, Green A, Sicree R, King H. Global prevalence of diabetes: estimates for the year 2000 and projections for 2030. Diabetes Care. 2004;27:1047–53. - PubMed
    1. Yach D, Stuckler D, Brownell KD. Epidemiologic and economic consequences of the global epidemics of obesity and diabetes. Nat Med. 2006;12:62–6. - PubMed
    1. Bugger H, Abel ED. Molecular mechanisms of diabetic cardiomyopathy. Diabetologia. 2014;57:660–71. - PMC - PubMed
    1. Nathan DM. Diabetes: Advances in Diagnosis and Treatment. Jama. 2015;314:1052–62. - PubMed
    1. Aon MA, Tocchetti CG, Bhatt N, Paolocci N, Cortassa S. Protective mechanisms of mitochondria and heart function in diabetes. Antioxid Redox Signal. 2015;22:1563–86. - PMC - PubMed

Publication types

MeSH terms