

Oxidative Stress Induced by the Deubiquitinase Inhibitor b-AP15 Is Associated with Mitochondrial Impairment
- PMID: 31281566
- PMCID: PMC6590552
- DOI: 10.1155/2019/1659468
Oxidative Stress Induced by the Deubiquitinase Inhibitor b-AP15 Is Associated with Mitochondrial Impairment
Abstract
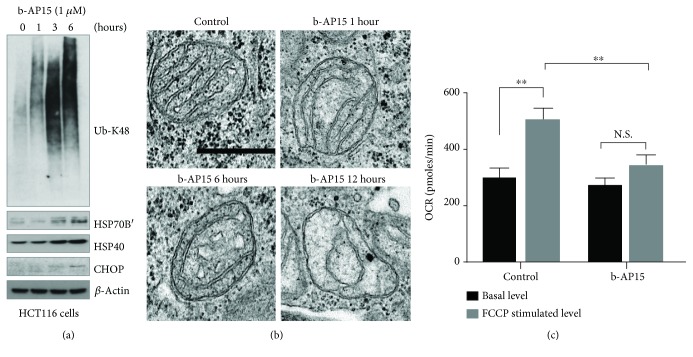
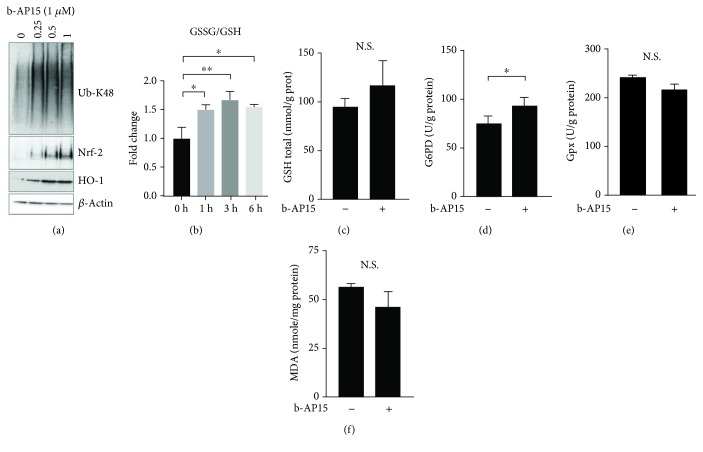
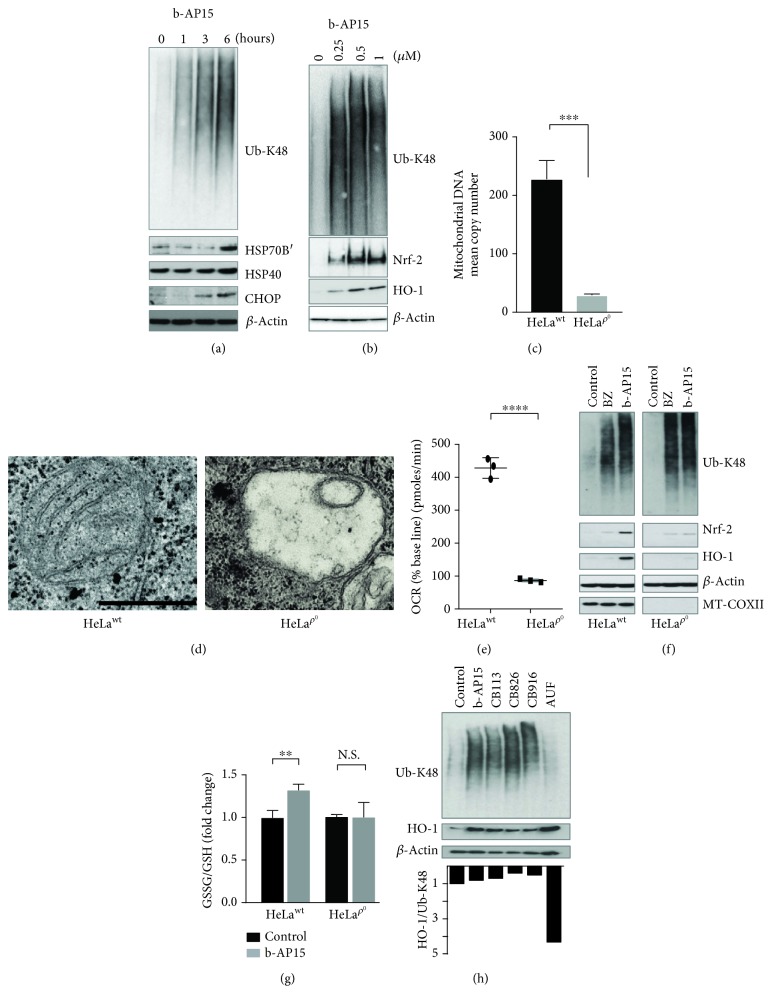
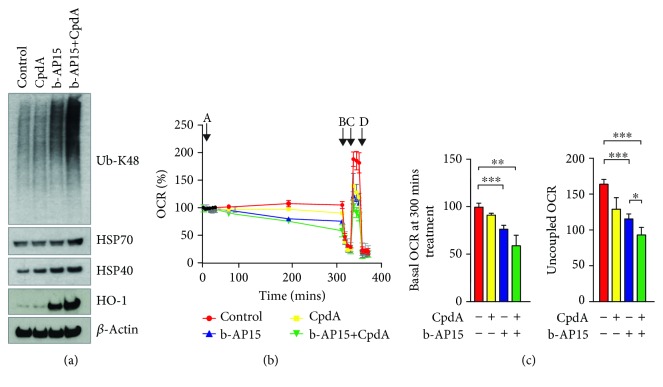
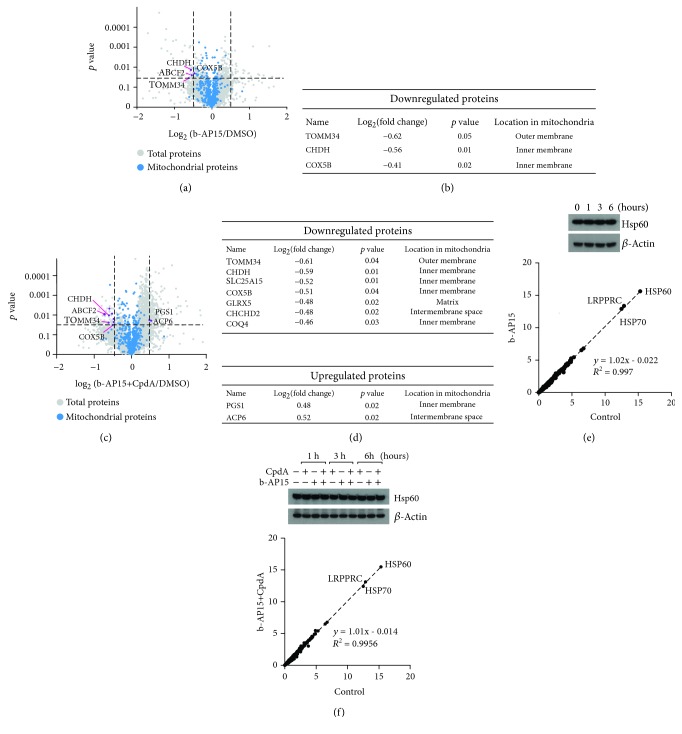
Inhibitors of the 20S proteasome such as bortezomib are cytotoxic to tumor cells and have been proven to be valuable for the clinical management of multiple myeloma. The therapeutic efficacy of bortezomib is, however, hampered by the emergence of acquired resistance. Available data suggest that blocking proteasome activity at the level of proteasome-associated deubiquitinases (DUBs) provides a mechanism to overcome resistance to bortezomib and also to other cancer therapies. The small molecule b-AP15 is an inhibitor of proteasome-associated DUB activity that induces both proteotoxic stress and increases in the levels of reactive oxygen species (ROS) in tumor cells. Antioxidants have been shown to decrease apoptosis induction by b-AP15 and we here addressed the question of the mechanism of redox perturbation by this compound. We show that oxidative stress induction by b-AP15 is abrogated in cells deprived of mitochondrial DNA (ρ 0 cells). We also show associations between the level of proteotoxic stress, the degree of mitochondrial dysfunction, and the extent of induction of hemeoxygenase-1 (HO-1), a target of the redox-regulated Nrf-2 transcription factor. Decreased expression of COX5b (cytochrome c oxidase subunit 5b) and TOMM34 (translocase of outer mitochondrial membrane 34) was observed in b-AP15-treated cells. These findings suggest a mitochondrial origin of the increased levels of ROS observed in cells exposed to the DUB inhibitor b-AP15.
Figures
Similar articles
-
The deubiquitinase inhibitor b-AP15 induces strong proteotoxic stress and mitochondrial damage.Biochem Pharmacol. 2018 Oct;156:291-301. doi: 10.1016/j.bcp.2018.08.039. Epub 2018 Aug 25. Biochem Pharmacol. 2018. PMID: 30149015
-
Induction of tumor cell apoptosis by a proteasome deubiquitinase inhibitor is associated with oxidative stress.Antioxid Redox Signal. 2014 Dec 10;21(17):2271-85. doi: 10.1089/ars.2013.5322. Epub 2013 Oct 17. Antioxid Redox Signal. 2014. PMID: 24011031 Free PMC article.
-
Targeted inhibition of the deubiquitinating enzymes, USP14 and UCHL5, induces proteotoxic stress and apoptosis in Waldenström macroglobulinaemia tumour cells.Br J Haematol. 2015 May;169(3):377-90. doi: 10.1111/bjh.13304. Epub 2015 Feb 17. Br J Haematol. 2015. PMID: 25691154 Free PMC article.
-
Proteasome deubiquitinases as novel targets for cancer therapy.Int J Biochem Cell Biol. 2012 Nov;44(11):1729-38. doi: 10.1016/j.biocel.2012.07.011. Epub 2012 Jul 20. Int J Biochem Cell Biol. 2012. PMID: 22819849 Review.
-
Deubiquitinase inhibition as a cancer therapeutic strategy.Pharmacol Ther. 2015 Mar;147:32-54. doi: 10.1016/j.pharmthera.2014.11.002. Epub 2014 Nov 6. Pharmacol Ther. 2015. PMID: 25444757 Review.
Cited by
-
Promising Anti-Mitochondrial Agents for Overcoming Acquired Drug Resistance in Multiple Myeloma.Cells. 2021 Feb 19;10(2):439. doi: 10.3390/cells10020439. Cells. 2021. PMID: 33669515 Free PMC article. Review.
-
Targeting USP14/UCHL5: A Breakthrough Approach to Overcoming Treatment-Resistant FLT3-ITD-Positive AML.Int J Mol Sci. 2024 Sep 26;25(19):10372. doi: 10.3390/ijms251910372. Int J Mol Sci. 2024. PMID: 39408703 Free PMC article.
-
Altered S-AdenosylMethionine availability impacts dNTP pools in Saccharomyces cerevisiae.Yeast. 2024 Aug;41(8):513-524. doi: 10.1002/yea.3973. Epub 2024 Jul 3. Yeast. 2024. PMID: 38961653 Free PMC article.
-
Comprehensive Target Screening and Cellular Profiling of the Cancer-Active Compound b-AP15 Indicate Abrogation of Protein Homeostasis and Organelle Dysfunction as the Primary Mechanism of Action.Front Oncol. 2022 Apr 22;12:852980. doi: 10.3389/fonc.2022.852980. eCollection 2022. Front Oncol. 2022. PMID: 35530310 Free PMC article.
-
Drug Development Targeting the Ubiquitin-Proteasome System (UPS) for the Treatment of Human Cancers.Cancers (Basel). 2020 Apr 7;12(4):902. doi: 10.3390/cancers12040902. Cancers (Basel). 2020. PMID: 32272746 Free PMC article. Review.
References
MeSH terms
Substances
LinkOut - more resources
Full Text Sources
