Two Distinct Subsets Are Identified from the Peritoneal Myeloid Mononuclear Cells Expressing both CD11c and CD115
- PMID: 31281712
- PMCID: PMC6597442
- DOI: 10.4110/in.2019.19.e15
Two Distinct Subsets Are Identified from the Peritoneal Myeloid Mononuclear Cells Expressing both CD11c and CD115
Abstract
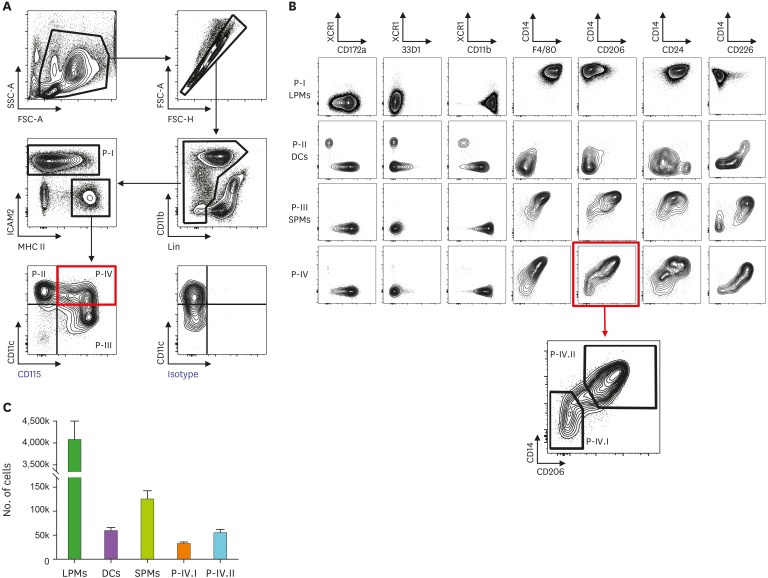
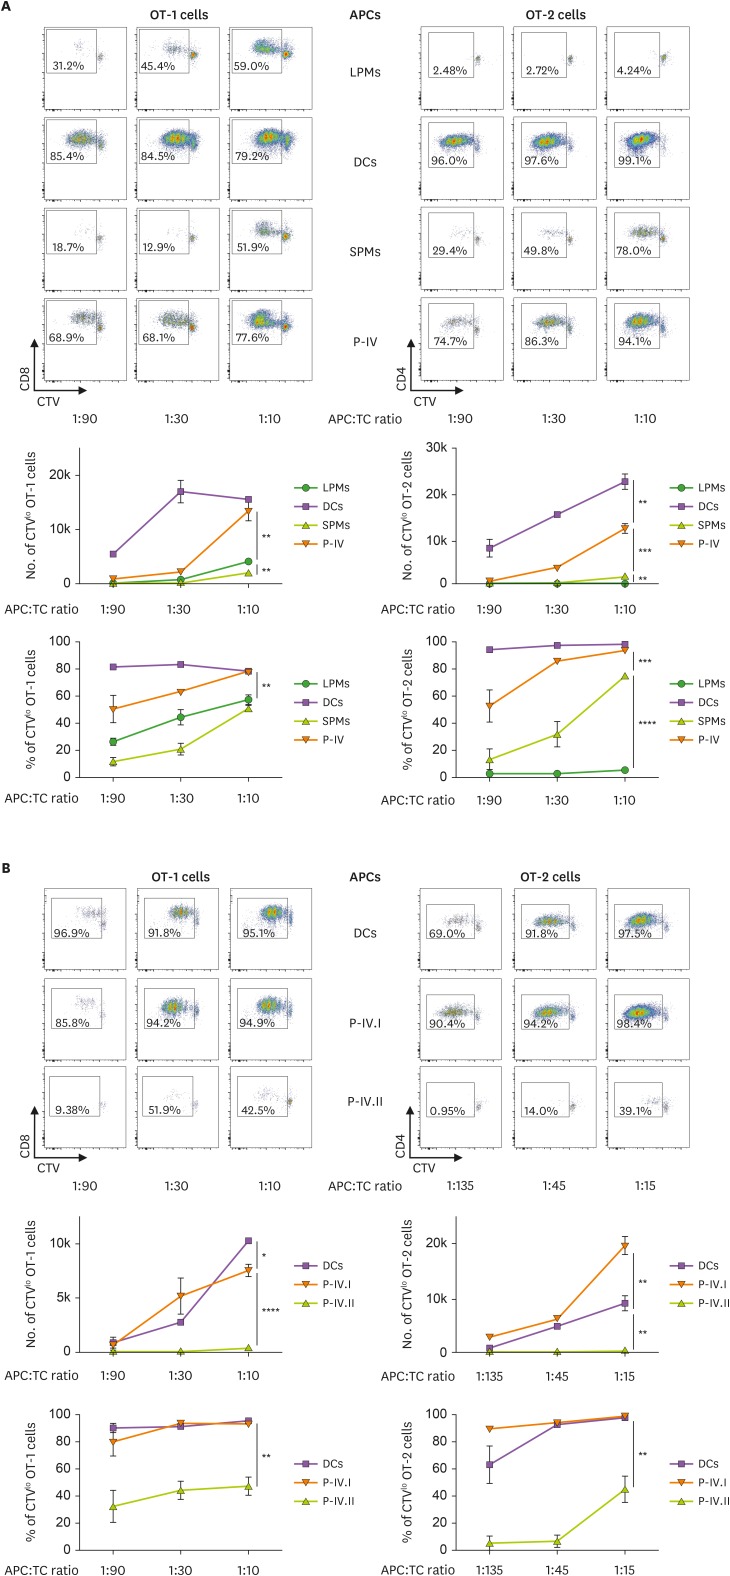
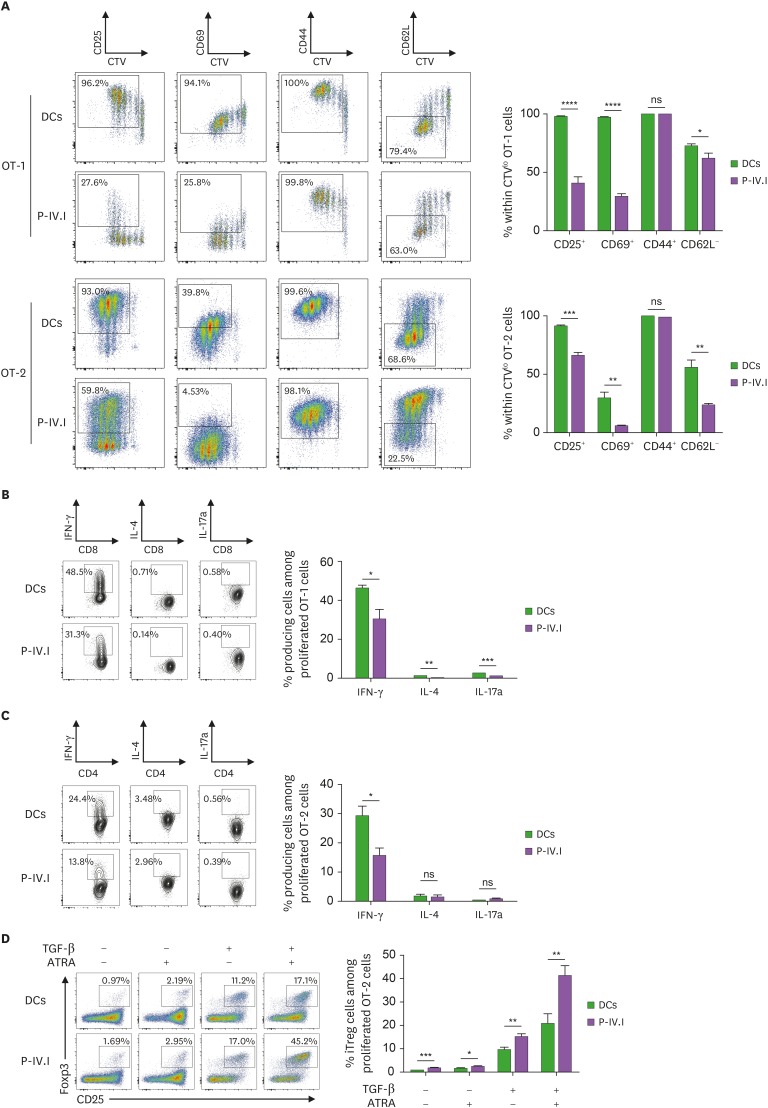
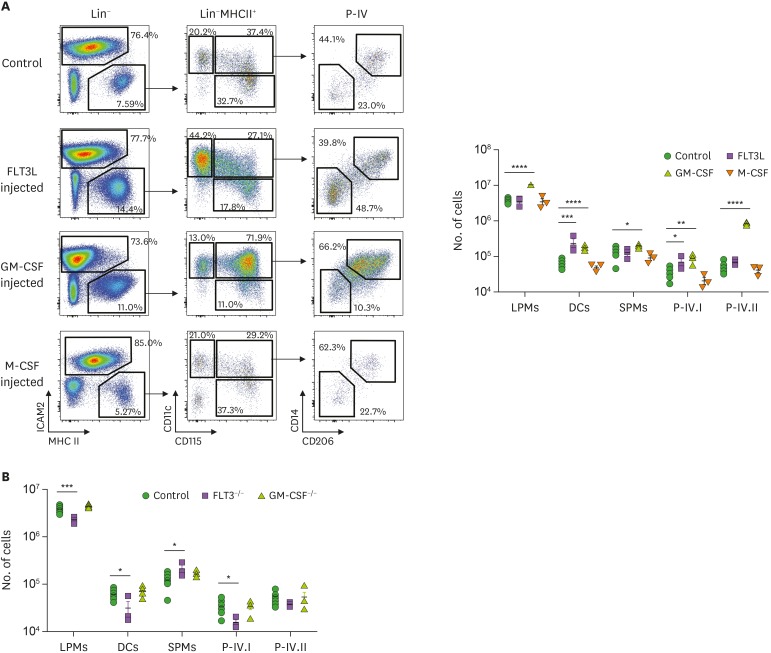
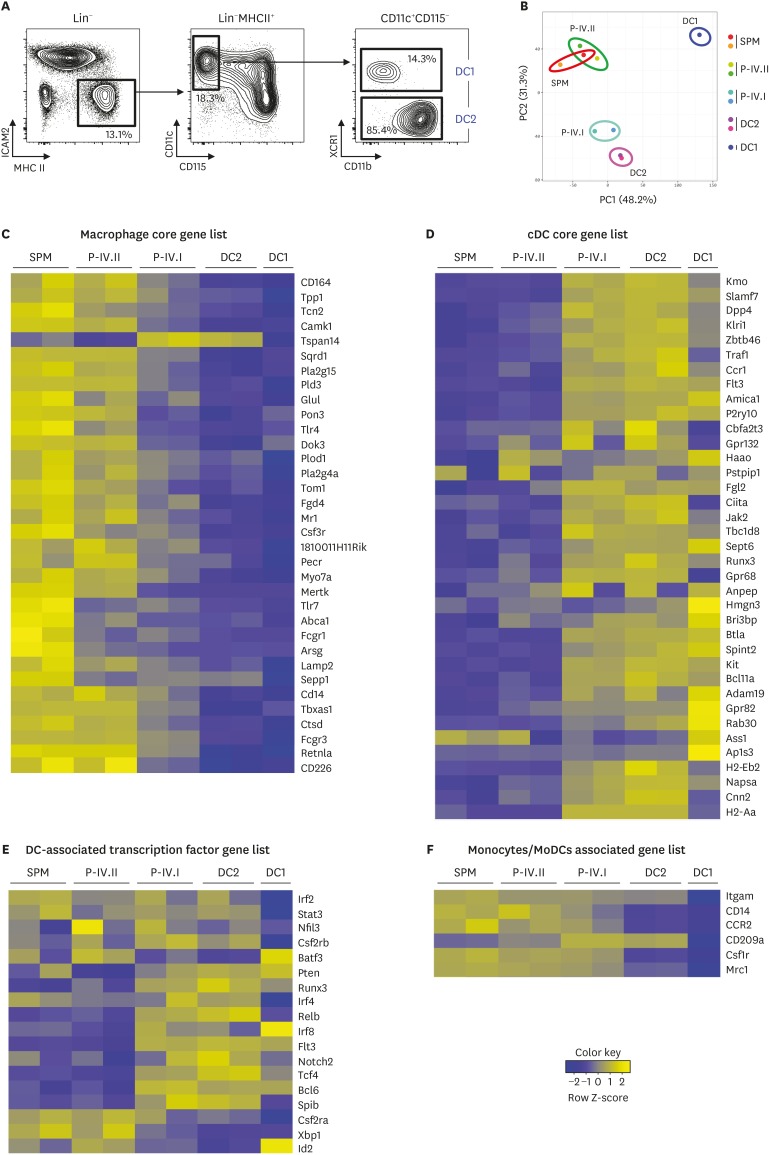
To this date, the criteria to distinguish peritoneal macrophages and dendritic cells (DCs) are not clear. Here we delineate the subsets of myeloid mononuclear cells in the mouse peritoneal cavity. Considering phenotypical, functional, and ontogenic features, peritoneal myeloid mononuclear cells are divided into 5 subsets: large peritoneal macrophages (LPMs), small peritoneal macrophages (SPMs), DCs, and 2 MHCII+CD11c+CD115+ subpopulations (i.e., MHCII+CD11c+CD115+CD14-CD206- and MHCII+CD11c+CD115+CD14+CD206+). Among them, 2 subsets of competent Ag presenting cells are demonstrated with distinct functional characteristics, one being DCs and the other being MHCII+CD11c+CD115+CD14-CD206- cells. DCs are able to promote fully activated T cells and superior in expanding cytokine producing inflammatory T cells, whereas MHCII+CD11c+CD115+CD14-CD206- cells generate partially activated T cells and possess a greater ability to induce Treg under TGF-β and retinoic acid conditions. While the development of DCs and MHCII+CD11c+CD115+CD14-CD206- cells are responsive to the treatment of FLT3 ligand and GM-CSF, the number of LPMs, SPMs, and MHCII+CD11c+CD115+CD14+CD206+ cells are only influenced by the injection of GM-CSF. In addition, the analysis of gene expression profiles among MHCII+ peritoneal myeloid mononuclear cells reveals that MHCII+CD11c+CD115+CD14+CD206+ cells share high similarity with SPMs, whereas MHCII+CD11c+CD115+CD14-CD206- cells are related to peritoneal DC2s. Collectively, our study identifies 2 distinct subpopulations of MHCII+CD11c+CD115+ cells, 1) MHCII+CD11c+CD115+CD14-CD206- cells closely related to peritoneal DC2s and 2) MHCII+CD11c+CD115+CD14+CD206+ cells to SPMs.
Keywords: Antigen presentation; Dendritic cells; Macrophages; Peritoneal cavity; T cells.
Conflict of interest statement
Conflicts of Interest: The authors declare no potential conflicts of interest.
Figures
Similar articles
-
Identification of dendritic cell precursor from the CD11c+ cells expressing high levels of MHC class II molecules in the culture of bone marrow with FLT3 ligand.Front Immunol. 2023 Nov 29;14:1179981. doi: 10.3389/fimmu.2023.1179981. eCollection 2023. Front Immunol. 2023. PMID: 38094300 Free PMC article.
-
Subsets of CD1c+ DCs: Dendritic Cell Versus Monocyte Lineage.Front Immunol. 2020 Sep 30;11:559166. doi: 10.3389/fimmu.2020.559166. eCollection 2020. Front Immunol. 2020. PMID: 33101275 Free PMC article. Review.
-
Downregulation of MHC Class II by Ubiquitination Is Required for the Migration of CD206+ Dendritic Cells to Skin-Draining Lymph Nodes.J Immunol. 2019 Dec 1;203(11):2887-2898. doi: 10.4049/jimmunol.1900593. Epub 2019 Oct 28. J Immunol. 2019. PMID: 31659013
-
Redefining Myeloid Cell Subsets in Murine Spleen.Front Immunol. 2016 Jan 11;6:652. doi: 10.3389/fimmu.2015.00652. eCollection 2015. Front Immunol. 2016. PMID: 26793192 Free PMC article.
-
Revisiting mouse peritoneal macrophages: heterogeneity, development, and function.Front Immunol. 2015 May 19;6:225. doi: 10.3389/fimmu.2015.00225. eCollection 2015. Front Immunol. 2015. PMID: 26042120 Free PMC article. Review.
Cited by
-
Identification of dendritic cell precursor from the CD11c+ cells expressing high levels of MHC class II molecules in the culture of bone marrow with FLT3 ligand.Front Immunol. 2023 Nov 29;14:1179981. doi: 10.3389/fimmu.2023.1179981. eCollection 2023. Front Immunol. 2023. PMID: 38094300 Free PMC article.
-
Granulocyte Macrophage-Colony Stimulating Factor Produces a Splenic Subset of Monocyte-Derived Dendritic Cells That Efficiently Polarize T Helper Type 2 Cells in Response to Blood-Borne Antigen.Front Immunol. 2022 Jan 3;12:767037. doi: 10.3389/fimmu.2021.767037. eCollection 2021. Front Immunol. 2022. PMID: 35069539 Free PMC article.
-
Deciphering Macrophage Phenotypes upon Lipid Uptake and Atherosclerosis.Immune Netw. 2020 Jun 22;20(3):e22. doi: 10.4110/in.2020.20.e22. eCollection 2020 Jun. Immune Netw. 2020. PMID: 32655970 Free PMC article. Review.
-
Sequential Transcriptome Changes in the Penumbra after Ischemic Stroke.Int J Mol Sci. 2019 Dec 16;20(24):6349. doi: 10.3390/ijms20246349. Int J Mol Sci. 2019. PMID: 31888302 Free PMC article.
-
GATA6+ Peritoneal Resident Macrophage: The Immune Custodian in the Peritoneal Cavity.Front Pharmacol. 2022 Mar 23;13:866993. doi: 10.3389/fphar.2022.866993. eCollection 2022. Front Pharmacol. 2022. PMID: 35401237 Free PMC article. Review.
References
-
- Varol C, Mildner A, Jung S. Macrophages: development and tissue specialization. Annu Rev Immunol. 2015;33:643–675. - PubMed
LinkOut - more resources
Full Text Sources
Medical
Molecular Biology Databases
Research Materials
Miscellaneous