. 2019 Jun 11:2019:8785263.
doi: 10.1155/2019/8785263. eCollection 2019.

High Thymic Output of Effector CD4+ Cells May Lead to a Treg : T Effector Imbalance in the Periphery in NOD Mice

Affiliations

High Thymic Output of Effector CD4+ Cells May Lead to a Treg : T Effector Imbalance in the Periphery in NOD Mice

Yuan Zhao et al. J Immunol Res. .

Abstract

Regulatory T cells (Tregs) play a critical role in controlling autoreactive T cells, and quantitative and/or qualitative deficiencies in Tregs are associated with autoimmune diseases, including type 1 diabetes (T1D), in both humans and mice. Both the incidence of T1D and percentages of peripheral Tregs in NOD mice vary considerably between animal facilities. In our animal facility, the incidence of T1D in NOD mice is high at 90-100% and the percentages of peripheral CD4+Foxp3+ cells in ~9-10-week-old female NOD mice are decreased compared to control (B6) mice shortly before high glucose is first detected (~12 weeks). These data suggest that there is an imbalance between Tregs and potentially pathogenic effector T cells at this age that could have significant impact on disease progression to overt diabetes. The goal of the current study was to investigate mechanisms that play a role in peripheral Treg : T effector cell balance in NOD mice, including differences in persistence/survival, peripheral homeostatic proliferation, and thymic production and output of CD4+ T cells. We found no differences in persistence/survival or homeostatic proliferation of either Tregs or effector T cells between NOD and B6 mice. Furthermore, although the percentages and absolute numbers of CD4+Foxp3+ cells in thymus were not decreased in NOD compared to B6 mice, the percentage of CD4+ recent thymic emigrants (RTE) that were Foxp3+ was significantly lower in 9-week-old NOD mice. Interestingly, the thymic output of CD4+Foxp3+ cells was not lower in NOD mice, whereas the thymic output of CD4+Foxp3- cells was significantly higher in NOD mice at that age compared to B6 mice. These data suggest that the higher thymic output of CD4+Foxp3- T cells contributes, at least in part, to the lower percentages of peripheral CD4+Foxp3+ Tregs in NOD mice and an imbalance between Tregs and T effector cells that may contribute to the development of full-blown diabetes.


Figures

Figure 1
Figure 1
Low percentages of CD4+Foxp3+ cells are found in the periphery of NOD mice shortly before onset of overt diabetes. (a) Female NOD mice were monitored weekly for glycosuria and considered diabetic when they had two consecutive positive readings (>250 mg/dl). Diabetes incidence is expressed as a percentage of the mice that are positive for glucose (n = 10). (b) Percentages of CD4+ cells that express Foxp3 were analyzed in the peripheral lymph nodes of female NOD and B6 mice at varying ages. ∗ denotes a significant difference at p < 0.05 (n = 3-10). (c) Sample histograms of Foxp3 expression in CD4+ cells from 12-week-old female B6 and NOD mice.
Figure 2
Figure 2
NOD and B6 CD4+ Tregs exhibit equivalent suppressive activity in vitro. (a) Percentages of CD4+CD25+ cells that express Foxp3+ in peripheral lymph nodes of female NOD and B6 mice at varying ages (n = 3-10). (b) Sample histograms of Foxp3 expression in CD4+CD25+ cells from peripheral lymph nodes of 12-week-old female B6 and NOD mice. (c) Lymphoid cells from NOD and B6 mice were collected at 12 weeks of age and CD4+CD25+ cells sorted. Varying numbers of CD4+CD25+ cells were cocultured with age-matched NOD CD4+CD25 responder cells, irradiated splenocytes, and anti-CD3 in vitro. Proliferation was determined by detection of H3-thymidine uptake. ∗ denotes a significant difference from positive control at p < 0.01.
Figure 3
Figure 3
Transferred NOD CD4+ Tregs persist/survive similarly to B6 controls under both lymphopenic and nonlymphopenic conditions. (a) Five hundred thousand purified CD4+CD25+ cells (~92% Foxp3+) from NOD or B6 mice were transferred into NOD.RAG or B6.RAG (lymphopenic) recipients, respectively. Four weeks after transfer, LN and spleen cells were collected and absolute numbers were counted from individual samples. Percentages of CD4+ cells that express Foxp3 were analyzed. The percent recovery of transferred cells was calculated based on the absolute number of recovered donor CD4+Foxp3+ cells divided by the total cell number injected. (b, c) Five hundred thousand purified CD4+CD25+ cells and CD4+CD25 cells from NOD (Thy1.2) or B6.SJL (CD45.1) mice were transferred into NOD.NON (Thy1.1) or B6 (CD45.2) intact (nonlymphopenic) recipients, respectively. Four or 8 weeks after transfer, LN and spleen cells were collected and the absolute number of cells from individual samples were counted. Percentages of CD4+ cells that did or did not express Foxp3 were analyzed. The percent recovery of transferred cells was calculated based on the absolute number of recovered donor CD4+Foxp3+ (b) or CD4+CD25Foxp3 (c) cells divided by the total number of respective donor cells injected × 100 (n = 5).
Figure 4
Figure 4
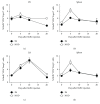
NOD CD4+Foxp3+ and CD4+Foxp3 cells survive similarly to B6 control cells in situ. Seven-week-old NOD or B6 mice were injected with BrdU i.p. every 12 hours for 3 days (days –3, -2, and -1). On days 0, 5, 10, and 20 postinjection, LN (a,c) and spleen (b, d) cells were collected and labeled with CD4, CD25, Foxp3, and BrdU antibodies. CD4+Foxp3+ (a, b) or CD4+Foxp3 (c, d) cells in the LN and spleen were gated and the percentages of BrdU+ cells were determined (n = 3).
Figure 5
Figure 5
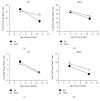
Transferred NOD and B6 CD4+ Tregs undergo comparable homeostatic proliferation in lymphopenic mice. Five hundred thousand purified CD4+CD25+ cells from NOD or B6 mice were labeled with CFSE and transferred into NOD.SCID or B6.SCID mice, respectively. (a) Four or (b) six days after transfer, LN and spleen cells were collected and labeled with CD4 and CD25 antibodies. CD4+ cells were gated and analyzed for CFSE dilution among donor cells. Percentages (a and b, upper and center panels) and absolute numbers (a and b, lower panels) of CFSE low (i.e., cells that have undergone proliferation) donor cells are shown. Each symbol represents data from an individual animal.
Figure 6
Figure 6
Differences in NOD vs B6 CD4+ Treg and non-Treg homeostatic proliferation do not account for the decrease in Treg percentages in the periphery of NOD mice. Four- or 11-week-old NOD or B6 mice were injected i.p. with BrdU every 12 hours for 3 days (days –3, -2, and –1). On day 0 (i.e., 12 hours after final BrdU injection), LN (a, c) and spleen (b, d) cells were collected and labeled with antibodies for CD4, Foxp3, and BrdU. CD4+Foxp3+ (a, b) or CD4+Foxp3 (c, d) cells were gated and analyzed for BrdU incorporation (n = 5).
Figure 7
Figure 7
Percentages and absolute numbers of CD4+Foxp3+ cells are not decreased in the thymus in NOD compared to B6 mice at either 4 or 9 weeks of age. Thymocytes were collected from NOD or B6 mice at (a, c) 4 or (b, d) 9 weeks of age and evaluated for the percentages (a, b) and absolute numbers (c, d) of CD4+Foxp3+ cells. Each symbol represents data from an individual animal. ∗ denotes a significant difference at p < 0.05.
Figure 8
Figure 8
Percentages of CD4+ recent thymus emigrants (RTE) that are Foxp3+ are lower in NOD compared to B6 mice at 9 weeks of age and may be due to the higher rate of thymic output of CD4+Foxp3 cells in NOD mice. Both thymic lobes of NOD and B6 mice were injected with 10 μl of either (a) PBS (upper left panel) or FITC (upper center panel) at 4, 7, or (a) 9 weeks of age. This typically resulted in random labeling of 20-40% of the thymocyte population. Mice were sacrificed 24 hours after injection, and lymphoid organs (LN and spleen) were collected. FITC+CD4+ cells (RTE) in secondary lymphoid organs were gated (a, lower center panel) and analyzed for the percentages of Foxp3+ (a, upper panel right, and b). (c, d) The daily (24 h) thymic export rates of CD4+Foxp3+ (c) or CD4+Foxp3 (d) cells in 9-week-old mice were determined using the formula described in Methods. ∗ denotes a significant difference at p < 0.01.

Similar articles

Cited by

References

    1. Alard P., Manirarora J. N., Parnell S. A., Hudkins J. L., Clark S. L., Kosiewicz M. M. Deficiency in NOD antigen-presenting cell function may be responsible for suboptimal CD4+CD25+ T-cell-mediated regulation and type 1 diabetes development in NOD mice. Diabetes. 2006;55(7):2098–2105. doi: 10.2337/db05-0810. - DOI - PubMed
    1. Berzins S. P., Venanzi E. S., Benoist C., Mathis D. T-cell compartments of prediabetic NOD mice. Diabetes. 2003;52(2):327–334. doi: 10.2337/diabetes.52.2.327. - DOI - PubMed
    1. Brusko T., Wasserfall C., McGrail K., et al. No alterations in the frequency of FoxP3+ regulatory T-cells in type 1 diabetes. Diabetes. 2007;56(3):604–612. doi: 10.2337/db06-1248. - DOI - PubMed
    1. Gregori S., Giarratana N., Smiroldo S., Adorini L. Dynamics of pathogenic and suppressor T cells in autoimmune diabetes development. The Journal of Immunology. 2003;171(8):4040–4047. doi: 10.4049/jimmunol.171.8.4040. - DOI - PubMed
    1. Mathis D., Benoist C. Back to central tolerance. Immunity. 2004;20(5):509–516. doi: 10.1016/S1074-7613(04)00111-6. - DOI - PubMed

MeSH terms