. 2019 May 31;6(7):ofz257.
doi: 10.1093/ofid/ofz257. eCollection 2019 Jul.

Plasma Proinflammatory Cytokines Are Markers of Disease Severity and Bacterial Burden in Pulmonary Tuberculosis

Affiliations

Plasma Proinflammatory Cytokines Are Markers of Disease Severity and Bacterial Burden in Pulmonary Tuberculosis

Nathella Pavan Kumar et al. Open Forum Infect Dis. .

Abstract

Background: Type 1, type 17, and other proinflammatory cytokines are important in host immunity to tuberculosis (TB) in animal models. However, their role in human immunity to TB is not completely understood.

Methods: To examine the association of proinflammatory cytokines with pulmonary TB (PTB), we examined the plasma levels of type 1 (interferon [IFN]γ and tumor necrosis factor [TNF]α), type 17 (interleukin [IL]-17A and IL-17F), and other proinflammatory (IL-6, IL-12, and IL-1β) cytokines in individuals with PTB, latent TB (LTB), or healthy controls (HC).

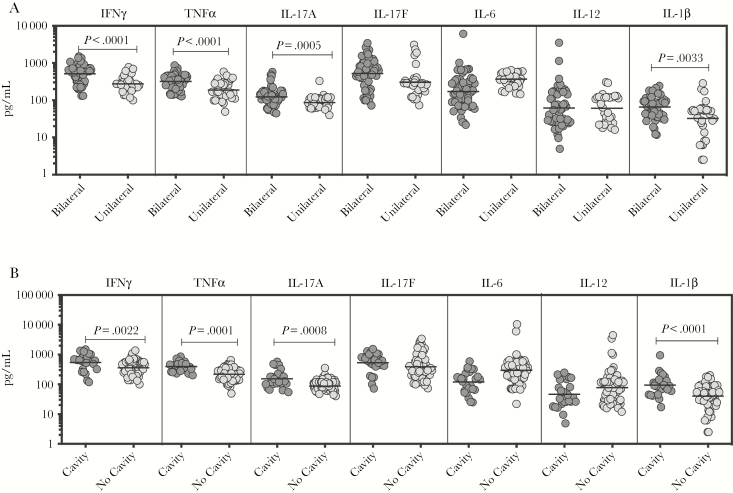
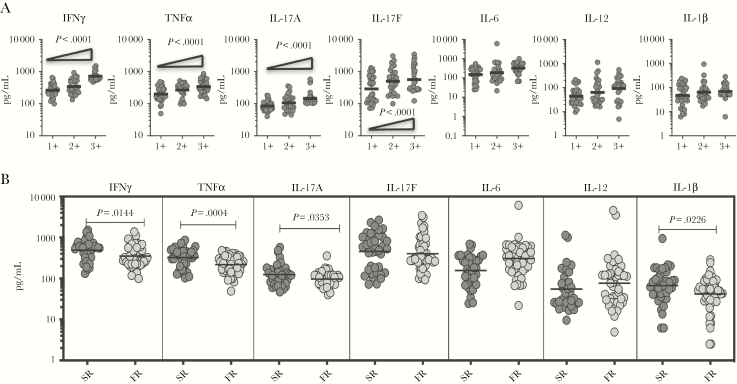
Results: Individuals with PTB exhibited significantly higher plasma levels of most of the above cytokines compared with LTB or HC individuals. Principal component analysis based on these cytokines could clearly distinguish PTB from both LTB or HC individuals. Pulmonary TB individuals with bilateral or cavitary disease exhibited significantly higher levels of IFNγ, TNFα, IL-17A, and IL-1β compared with those with unilateral or noncavitary disease. Pulmonary TB individuals also exhibited a significant positive relationship between IFNγ, TNFα, and IL-17A levels and bacterial burdens. In addition, PTB individuals with delayed culture conversion exhibited significantly higher levels of IFNγ, TNFα, IL-17A, and IL-1β at baseline. Finally, the plasma levels of all the cytokines examined were significantly reduced after successful chemotherapy.

Conclusions: Therefore, our data demonstrate that PTB is associated with heightened levels of plasma proinflammatory cytokines, which are reversed after chemotherapy. Our data also reveal that proinflammatory cytokines are markers of disease severity, bacterial burden, and delayed culture conversion in PTB.

Keywords: biomarkers; cytokines; tuberculosis.


Figures

Figure 1.
Figure 1.
Elevated plasma levels of type 1, type 17, and proinflammatory cytokines in pulmonary tuberculosis (PTB) individuals. (A) The plasma levels of type 1 and type 17 cytokines were measured in individuals with PTB (n = 88) and latent TB ([LTB] n = 74) and healthy controls ([HC] n = 74). The data are represented as scatter plots with each circle representing a single individual. P values were calculated using the Kruskal-Wallis test with Dunn’s post hoc comparison. (B) The plasma levels of proinflammatory cytokines were measured in PTB (n = 88), LTB (n = 74), and HC (n = 74) individuals. The data are represented as scatter plots with each circle representing a single individual. P values were calculated using the Kruskal-Wallis test with Dunn’s post hoc comparison. (C) Principle component analysis (PCA) plot computing normalized enzyme-linked immunosorbent assay data from baseline plasma levels of cytokines in combination of 2 different experimental groups: first, PTB (blue) vs LTB (red) - the PCA shows the 2 principal components of variation, accounting for 41.8% (x-axis) and 15.7% (y-axis); and second, PTB (blue) vs HC (red) - the PCA shows the 2 principal components of variation, accounting for 48.3% (x-axis) and 15.2% (y-axis). IFN, interferon; IL, interleukin, TNF, tumor necrosis factor.
Figure 2.
Figure 2.
Plasma type 1 and type 17 cytokines are associated with (1) extent of disease or (2) disease severity in pulmonary tuberculosis (PTB) individuals. (A) The plasma levels of type 1, type 17, and proinflammatory cytokines were measured in in PTB individuals with bilateral versus unilateral disease, reflecting the extent of disease. (B) The plasma levels of type 1, type 17, and proinflammatory cytokines were measured in PTB individuals with cavitary versus noncavitary disease, reflecting the disease severity. The data are represented as scatter plots with each circle representing a single individual. P values were calculated using the Mann-Whitney test with Holm’s correction for multiple comparisons. IFN, interferon; IL, interleukin, TNF, tumor necrosis factor.
Figure 3.
Figure 3.
Plasma type 1 and type 17 cytokines are associated with bacterial burdens in pulmonary tuberculosis (PTB) individuals. (A) The relationship between the plasma levels of type 1, type 17, and proinflammatory cytokines and smear grades as estimated by sputum smears was examined in PTB individuals. The data are represented as scatter plots with each circle representing a single individual. P values were calculated using the Linear trend posttest. (B) The plasma levels of type 1, type 17, and proinflammatory cytokines were measured in PTB individuals, who were slow responders (sputum positive during second month of anti-TB treatment [ATT], SR) versus fast responders (sputum negative during second month of ATT, FR). The data are represented as scatter plots with each circle representing a single individual. P values were calculated using the Mann-Whitney test with Holm’s correction for multiple comparisons. IFN, interferon; IL, interleukin, TNF, tumor necrosis factor.
Figure 4.
Figure 4.
Diminished plasma levels of type 1, type 17, and proinflammatory cytokines at the end of standard anti-tuberculosis (TB) therapy in pulmonary TB (PTB) individuals. The plasma levels of type 1, type 17, and proinflammatory cytokines PTB at baseline (pre-T) and at 6 months of anti-TB treatment (post-T). The data are presented as line graphs with each line representing a single individual. P values were calculated using the Wilcoxon signed-rank test. IFN, interferon; IL, interleukin, TNF, tumor necrosis factor.

Similar articles

Cited by

References

    1. Pai M, Behr MA, Dowdy D, et al. . Tuberculosis. Nat Rev Dis Primers 2016; 2:16076. - PubMed
    1. Cadena AM, Fortune SM, Flynn JL. Heterogeneity in tuberculosis. Nat Rev Immunol 2017; 17:691–702. - PMC - PubMed
    1. O’Garra A, Redford PS, McNab FW, et al. . The immune response in tuberculosis. Annu Rev Immunol 2013; 31:475–527. - PubMed
    1. Cooper AM. Cell-mediated immune responses in tuberculosis. Annu Rev Immunol 2009; 27:393–422. - PMC - PubMed
    1. Casanova JL, Abel L. Genetic dissection of immunity to mycobacteria: the human model. Annu Rev Immunol 2002; 20:581–620. - PubMed