. 2019 Jul 3;5(7):eaav8391.
doi: 10.1126/sciadv.aav8391. eCollection 2019 Jul.

A heritable subset of the core rumen microbiome dictates dairy cow productivity and emissions

Affiliations

A heritable subset of the core rumen microbiome dictates dairy cow productivity and emissions

R John Wallace et al. Sci Adv. .

Abstract

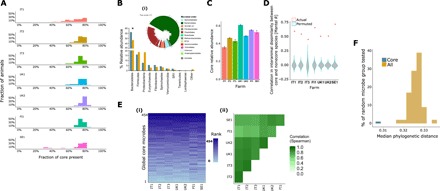
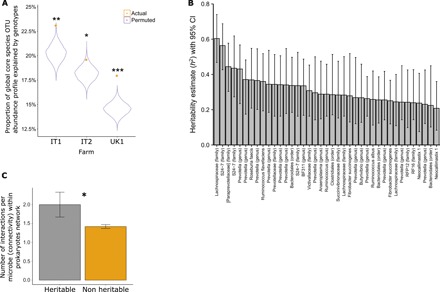
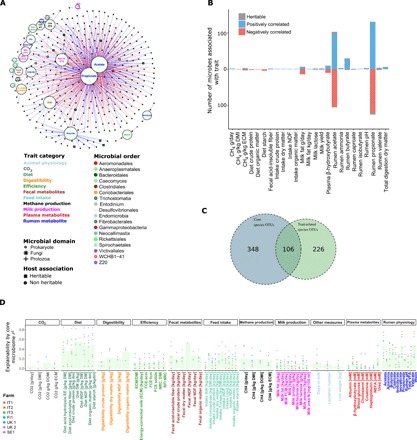
A 1000-cow study across four European countries was undertaken to understand to what extent ruminant microbiomes can be controlled by the host animal and to identify characteristics of the host rumen microbiome axis that determine productivity and methane emissions. A core rumen microbiome, phylogenetically linked and with a preserved hierarchical structure, was identified. A 39-member subset of the core formed hubs in co-occurrence networks linking microbiome structure to host genetics and phenotype (methane emissions, rumen and blood metabolites, and milk production efficiency). These phenotypes can be predicted from the core microbiome using machine learning algorithms. The heritable core microbes, therefore, present primary targets for rumen manipulation toward sustainable and environmentally friendly agriculture.


Figures

Fig. 1
Fig. 1. A phylogenetically cohesive core rumen microbiome was found across farms with highly conserved hierarchical structure and tight association to overall microbiome composition.
(A) Core microbes are highly represented within individual animals, as a high fraction of them (>50% of the core microbes) are present in >70% of the individuals. (B) The prokaryotic core (blue) was represented by 10 phyla of the 30 found in the overall microbiome (x axis; ochre), including 11 prokaryotic, 2 fungal, and 1 protozoal orders, detected in >50% of the individuals in each farm. *The core microbiome was significantly enriched in Bacteroidetes (enrichment analysis, Fisher exact test, after Benjamini-Hochberg correction, P < 0.0005). SR1, candidate division sulphur river 1. Core prokaryotes (i) consisted of 454 microbes, mainly from the orders Bacteroidales (tree; green) and Clostridiales (tree; maroon). Core heritable taxa are presented as gray bar plots on the tree. (C) The core microbiome composed of a large fraction of the overall microbiome, ranging between three- and two-thirds of the relative abundance, depending on the farm (x axis). Bar plots represent the mean, and error bars represent the SE of the core relative abundance. (D) Core microbiome composition is highly correlated to noncore microbes, as shown by comparing the interanimal dissimilarity (Bray-Curtis) matrix based on core microbes to that based on noncore microbes. Violin plots for each farm (x axis) show the correlation between the two dissimilarity matrices (core and noncore; Mantel R), where the violin (gray) describes the null model (permuted) Mantel R values, and red points depict the actual R. (E) The core microbiome exhibits a clear hierarchical structure, in terms of microbial abundance, which agrees between farms. (i) A highly consistent core microbiome abundance pattern (ranking) across farms (x axis) was revealed by an abundance-ranked color-coded heatmap, where species-level microbial OTUs are ordered by their mean relative abundance across all animals in the cohort (no further clustering or normalization was performed). Color coding reflects the rank abundance of a given OTU in a given individual. (ii) Heatmap showing the degree of correlation in relative abundance profiles between the farms. Color coding reflects the degree of correlation in relative abundance profiles (Spearman r; all P < 0.001). (F) Phylogenetic distances between the core microbes were smaller, showing that they are closer phylogenetically, but also distinct, compared to the overall microbiome, as it was shown by mean pairwise phylogenetic distance (x axis) calculation between core (blue) and 1000 randomly selected noncore microbes (ochre) from the rumen (y axis; P < 0.001).
Fig. 2
Fig. 2. Host genetics explains core microbiome composition with heritable microbes serving as hubs within the microbial interaction networks.
The core microbiome is associated with animal genetics as (A) the variance in the core microbiome (y axis) was significantly explained by host genetics. CCA was performed between the matrix of the first 30 microbial (OTU table) principal component scores and host genotype principal component scores based on a common SNP. The analysis was accomplished for the largest Holstein farms in this study (x axis). (B) Heritability analysis based on the genetic relatedness matrix (GRM) showed 39 microbes (x axis) significantly correlating with the animal genotype. Heritability estimate—h2 (y axis; bar plots show mean estimate per microbe), and P values were calculated using genetics complex trait analysis (GCTA) software, followed by a multiple testing correction with Benjamini-Hochberg method. Confidence intervals (CIs; 95%) were estimated on the basis of heritability estimates and the GRM with Fast Confidence IntErvals using Stochastic Approximation (FIESTA) software. (C) Heritable microbes are central to the microbial interaction network, as revealed by the higher mean connectivity (y axis) of these microbes compared to the nonheritable ones. The interaction network was built using Sparse InversE Covariance estimation for Ecological Association and Statistical Inference (SpiecEasi). Results are presented as mean number of microbial interactions with SE. Indicated P values, *P < 0.05, **P < 0.005, ***P < 0.0005.
Fig. 3
Fig. 3. Core rumen microbiome composition is linked to host traits and could significantly predict those traits.
(A) Association analysis between microbes and host traits revealed 339 microbes associated with at least one trait. For a microbe to be associated with a given trait, it had to significantly and unidirectionally correlate with a trait within each of at least four farms (after Benjamini-Hochberg multiple testing correction) with no farm showing a significant correlation in the opposing direction. (B) Most of the trait-associated microbes are associated with rumen propionate and acetate. (C) Enrichment analysis, using Fisher exact test, showed that the core microbes are much more present (enriched) within trait-associated microbes compared to the noncore microbiome (P < 2.2 × 10⁻¹⁶). (D) Explained variation (r2) of different host traits as function of core microbiome composition. r2 estimates were derived from a machine learning approach where a trait value was predicted for a given animal using the Ridge regression that was constructed from other animals in the farm (leave-one-out k-fold regression). Thereafter, prediction r2 value was calculated between the vectors of observed and predicted trait values. Indicated host traits were significantly explained (via prediction) by core microbe (OTU) abundance profiles. Dots stand for individual farms’ prediction r2, while bar heights represent mean of individual farms’ r2. DMI, dry matter intake; ECM, energy-corrected milk; NDF, neutral-detergent fiber; DM, dry matter; BHB, β-hydroxybutyrate.

References

    1. H. Steinfeld, P. Gerber, T. Wassenaar, V. Caste, M. Rosales, C. de Haan, Livestock’s Long Shadow (FAO, 2006).
    1. Myer P. R., Smith T. P., Wells J. E., Kuehn L. A., Freetly H. C. I., Rumen microbiome from steers differing in feed efficiency. PLOS ONE 10, e0129174 (2015). - PMC - PubMed
    1. Shabat S. K., Sasson G., Doron-Faigenboim A., Durman T., Yaacoby S., Berg Miller M. E., White B. A., Shterzer N., Mizrahi I., Specific microbiome-dependent mechanisms underlie the energy harvest efficiency of ruminants. ISME J. 10, 2958–2972 (2016). - PMC - PubMed
    1. A. G. Williams, G. S. Coleman, The Rumen Microbial Ecosystem (Chapman & Hall, 1997).
    1. I. Mizrahi, The Prokaryotes (Springer Berlin Heidelberg, 2013).

Publication types

LinkOut - more resources