. 2019 Jul 3;5(7):eaaw5096.
doi: 10.1126/sciadv.aaw5096. eCollection 2019 Jul.

Imaging CAR T cell therapy with PSMA-targeted positron emission tomography

Affiliations

Imaging CAR T cell therapy with PSMA-targeted positron emission tomography

Il Minn et al. Sci Adv. .

Abstract

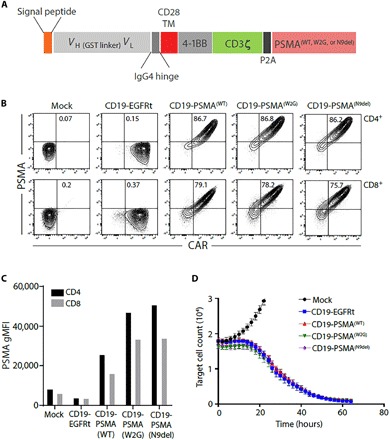
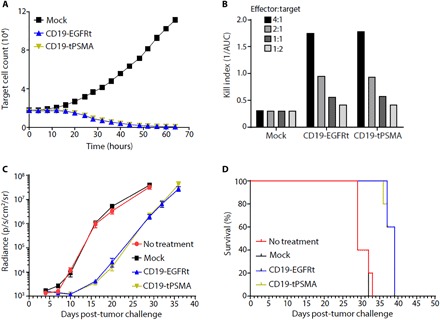
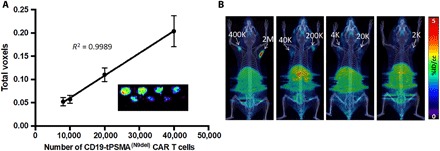
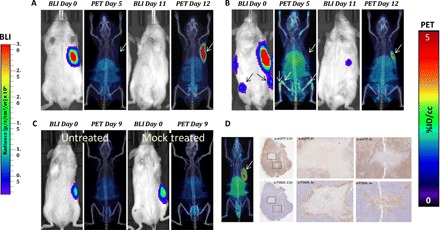
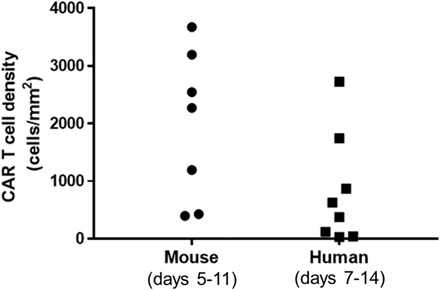
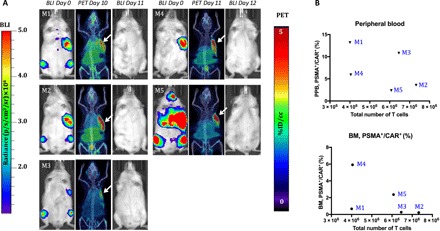
Chimeric antigen receptor (CAR) T cell therapy for hematologic malignancies is fraught with several unknowns, including number of functional T cells that engage target tumor, durability and subsequent expansion and contraction of that engagement, and whether toxicity can be managed. Non-invasive, serial imaging of CAR T cell therapy using a reporter transgene can address those issues quantitatively. We have transduced anti-CD19 CAR T cells with the prostate-specific membrane antigen (PSMA) because it is a human protein with restricted normal tissue expression and has an expanding array of positron emission tomography (PET) and therapeutic radioligands. We demonstrate that CD19-tPSMA(N9del) CAR T cells can be tracked with [18F]DCFPyL PET in a Nalm6 model of acute lymphoblastic leukemia. Divergence between the number of CD19-tPSMA(N9del) CAR T cells in peripheral blood and bone marrow and those in tumor was evident. These findings underscore the need for non-invasive repeatable monitoring of CAR T cell disposition clinically.


Figures

Fig. 1
Fig. 1. Engineered expression of PSMA variants on CD19 CAR T cells.
(A) CAR construct illustration demonstrating the CD19-targeting domain, costimulatory domain, and the location of the PSMA expression tag. Three different molecular constructs of PSMA were produced: WT, W2G, and N9del. VH, heavy chain variable domain; VL, light chain variable domain; GST, glutathione S-transferase; IgG4, immunoglobulin G4. (B) CD19-EGFRt or CD19-PSMA CAR T cells were generated, and flow cytometry was performed to identify CAR+ and PSMA+ CD4 or CD8 T cells. Gating was based on the mock transduction control. (C) Surface expression of PSMA was assessed by flow cytometry. Geometric mean fluorescent intensity (gMFI) is reported after gating on PSMA+ cells. (D) Mock, CD19-EGFRt, or CD19-PSMA CAR T cells were incubated with K562-CD19-NLR target cells at a ratio of 4:1. Target cells were analyzed every 2 hours using an IncuCyte live cell imaging system. TM, transmembrane; NLR, NucLight Red.
Fig. 2
Fig. 2. CD19 CAR T cells expressing tPSMA maintain function in vitro and in vivo.
(A) Mock or CD19-tPSMA CAR T cells were incubated with K562-CD19-NLR target cells at a ratio of 4:1. Target cells were analyzed every 2 hours using an IncuCyte live cell imaging system. (B) A kill index [1/area under the curve (AUC)] was calculated at the indicated effector:target ratio. (C and D) Nalm6-GFP-fLuc tumor cells were injected intravenously into female NOD scid (nonobese diabetic severe combined immunodeficient) gamma (NSG) mice (n = 8 per group) on day 0, and 1 × 10⁶ mock or CAR T cells were injected on day 4. Whole-body bioluminescence imaging (BLI) was performed to determine tumor burden, with data displayed as average radiance for each group (C), and survival events were recorded (D).
Fig. 3
Fig. 3. PET detects CD19-tPSMA CAR T cells with high sensitivity in vitro and in vivo.
(A) Standard curve demonstrating a linear relationship between the PET signal and the number of CD19-tPSMA(N9Del) CAR T cells. Inset: In vitro phantom from which the standard curve was derived. The in vitro phantom used varying numbers of CD19-tPSMA(N9del) CAR T cells incubated with 37 MBq of [18F]DCFPyL, a high affinity, positron-emitting ligand targeting PSMA, in a 384-well plate. Plates were scanned using the SuperArgus small-animal PET/CT device at 1 hour after beginning the incubation. There were three rows and eight columns of wells presented in a checkerboard pattern: (top row) 40,000, 20,000, 10,000, and 8000 cells; (middle row) 6000, 4000, 2000, and 1000 cells; and (bottom row) 800, 600, 400, and 200 cells. Detection limit was at or near 2000 cells. Images from one of eight separate plates are shown. Error bars, SD; n = 8. (B) Representative images of NSG mice injected with the indicated number (K = 1000; M = 1 × 10⁶) of CD19-tPSMA(N9del) CAR T cells in 50 μl (50% Matrigel) in the shoulders (white arrows); n = 5. Mice were imaged on the SuperArgus small-animal PET/CT at 1 hour after injection of 14.8 MBq of [18F]DCFPyL. PET data are expressed in percentage of injected dose per cubic centimeter of tissue imaged (%ID/cc). To improve the display contrast of the in vivo images, relatively high renal radiotracer uptake was masked using a thresholding method.
Fig. 4
Fig. 4. PSMA PET/CT enables visualization of CD19-tPSMA(N9del) CAR T cell infiltration into local and metastatic tumors.
Tumors were derived from Nalm6-eGFP-fLuc cells. (A and B) Mice were infused with 2 × 10⁶ CD19-tPSMA(N9del) CAR T cells; n = 5. (C) Untreated (left mouse) and treated (right mouse) with infusion of 2 × 10⁶ mock T cells. Mice were imaged on the SuperArgus small-animal PET/CT at 1 hour after injection of 14.8 MBq of [18F]DCFPyL and were evaluated at various times (in days) after infusion of the CAR T cells, as indicated. Images alternate between fLuc-tagged bioluminescence (BLI, radiance) for visualization of tumor cells and PET/CT for T cells, with each mouse undergoing both imaging studies; n = 2. (D) Tumor was dissected and stained with anti-PSMA antibody for CD19-tPSMA(N9del) CAR T cells and anti–enhanced green fluorescent protein (eGFP) antibody for tumor cells. CAR T cells infiltrated into the center of the tumor (magnification boxes). Regions where CD19-tPSMA(N9del) CAR T cells infiltrated stained negative with anti-eGFP antibody, indicating tumor cell death. This is a representative example of n = 8. PET data are expressed in percentage of injected dose per cubic centimeter of tissue imaged (%ID/cc). To improve the display contrast of the in vivo images, the relatively high renal radiotracer uptake was masked using a thresholding method. Arrows demonstrate tumor, where indicated. Images are scaled to the same maximum value within each modality.
Fig. 5
Fig. 5. CD19-tPSMA(N9del) CAR T cell numbers in mouse and human.
Values were obtained from tumor biopsies, with the human samples derived from the TRANSCEND NHL-001 trial. TRANSCEND uses the same CAR construct but an EGFRt rather than tPSMA tag. Note that CD19-tPSMA(N9del) CAR T cell numbers in mouse versus human biopsy samples are on the same order of magnitude.
Fig. 6
Fig. 6. The number of CD19-tPSMA(N9del) cells in the peripheral blood and the bone marrow does not correlate with the total number of the CD19-tPSMA(N9del) cells localized to the tumors.
(A) PET/CT and BLI images of five mice. Days are marked from the day of infusion of CD19-tPSMA(N9del) CAR T cells. Mice were imaged on the SuperArgus small-animal PET/CT at 1 hour after injection of 14.8 MBq of [18F]DCFPyL and were scanned at various times after injection, as indicated. Images alternate between fLuc-tagged bioluminescence (BLI, radiance) for visualization of tumor cells and PET/CT for CAR T cells, with each mouse undergoing both imaging studies. PET data are expressed in percentage of injected dose per cubic centimeter of tissue imaged (%ID/cc), with arrows designating accumulation of CAR T cells. To improve the display contrast of the in vivo images, the relatively high renal radiotracer uptake was masked using a thresholding method. Images are scaled to the same maximum value within each modality. (B) Quantified numbers of the CD19-tPSMA(N9del) cells in the region of interest drawn to cover the entire tumor area were plotted with the percentage number of PSMA+/CAR+ cell populations in the peripheral blood (PPB) and the bone marrow (BM). Each data point (M) represents each mouse; n = 5.

Comment in

References

    1. Kochenderfer J. N., Wilson W. H., Janik J. E., Dudley M. E., Stetler-Stevenson M., Feldman S. A., Maric I., Raffeld M., Nathan D.-A., Lanier B. J., Morgan R. A., Rosenberg S. A., Eradication of B-lineage cells and regression of lymphoma in a patient treated with autologous T cells genetically engineered to recognize CD19. Blood 116, 4099–4102 (2010). - PMC - PubMed
    1. Porter D. L., Levine B. L., Kalos M., Bagg A., June C. H., Chimeric antigen receptor-modified T cells in chronic lymphoid leukemia. N. Engl. J. Med. 365, 725–733 (2011). - PMC - PubMed
    1. Brentjens R. J., Davila M. L., Riviere I., Park J., Wang X., Cowell L. G., Bartido S., Stefanski J., Taylor C., Olszewska M., Borquez-Ojeda O., Qu J., Wasielewska T., He Q., Bernal Y., Rijo I. V., Hedvat C., Kobos R., Curran K., Steinherz P., Jurcic J., Rosenblat T., Maslak P., Frattini M., Sadelain M., CD19-targeted T cells rapidly induce molecular remissions in adults with chemotherapy-refractory acute lymphoblastic leukemia. Sci. Transl. Med. 5, 177ra38 (2013). - PMC - PubMed
    1. Grupp S. A., Kalos M., Barrett D., Aplenc R., Porter D. L., Rheingold S. R., Teachey D. T., Chew A., Hauck B., Wright J. F., Milone M. C., Levine B. L., June C. H., Chimeric antigen receptor-modified T cells for acute lymphoid leukemia. N. Engl. J. Med. 368, 1509–1518 (2013). - PMC - PubMed
    1. Milone M. C., Bhoj V. G., The Pharmacology of T cell therapies. Mol. Ther. Methods Clin. Dev. 8, 210–221 (2018). - PMC - PubMed

Publication types

MeSH terms