. 2019 Jul 3;5(7):eaax0672.
doi: 10.1126/sciadv.aax0672. eCollection 2019 Jul.

Osteoblastic lysosome plays a central role in mineralization

Affiliations

Osteoblastic lysosome plays a central role in mineralization

Tomoaki Iwayama et al. Sci Adv. .

Abstract

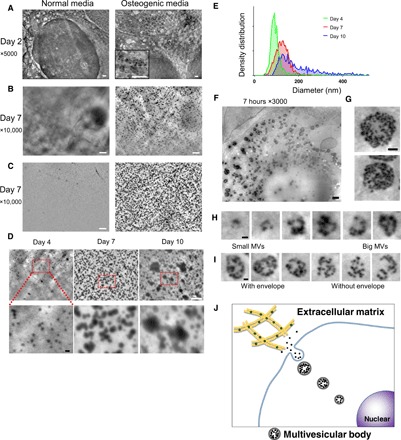
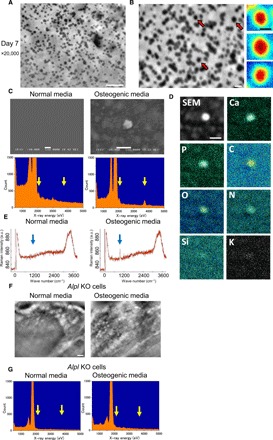
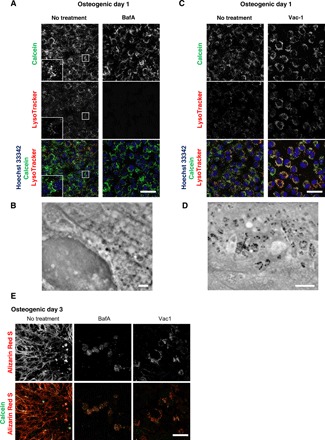
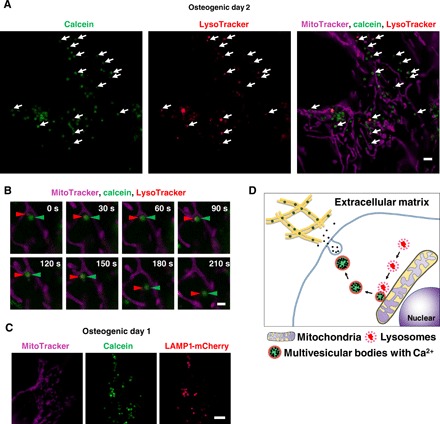
Mineralization is the most fundamental process in vertebrates. It is predominantly mediated by osteoblasts, which secrete mineral precursors, most likely through matrix vesicles (MVs). These vesicular structures are calcium and phosphate rich and contain organic material such as acidic proteins. However, it remains largely unknown how intracellular MVs are transported and secreted. Here, we use scanning electron-assisted dielectric microscopy and super-resolution microscopy for assessing live osteoblasts in mineralizing conditions at a nanolevel resolution. We found that the calcium-containing vesicles were multivesicular bodies containing MVs. They were transported via lysosome and secreted by exocytosis. Thus, we present proof that the lysosome transports amorphous calcium phosphate within mineralizing osteoblasts.


Figures

Fig. 1
Fig. 1. Nanoscale observation of live osteoblasts in culture media, using the SE-ADM system.
(A) Representative high-resolution SE-ADM images of osteoblasts cultured with or without osteogenic media for 2 days. Black particles were evident only when cultured in osteogenic media (right, square in the bottom). (B) Representative high-resolution SE-ADM images of osteoblasts cultured with or without osteogenic media for 7 days. There are many black particles when cultured in osteogenic media (right). (C) Representative high-resolution SE-ADM images of the SiN film after cell removal. In normal media, no particles are observed (left). The image of the film after removal of cells cultured in osteogenic media shows many clear black particles dispersed in the whole area (right). (D) Comparison of particle images during 4 to 10 days of culture in osteogenic media. The particle sizes gradually increased. (E) Distribution of particle size measured during 4 to 10 days of culture in osteogenic media. Approximately 900 to 1100 particles per time point were measured and plotted as a histogram. (F) Representative high-resolution SE-ADM images of osteoblasts cultured with osteogenic media for 7 hours. (G) MVBs have clear gray envelopes. (H) Cut images of various MVB sizes, including particles. (I) Comparison of MVBs with or without a gray envelope. (J) Schematic view of intracellular formation and transport of MVB in mineralizing osteoblasts. Scale bars, 1 μm in (A) to (C) and (F); 500 nm in (G); 200 nm in (D, bottom), (H), and (I).
Fig. 2
Fig. 2. Characterization of mineral containing vesicles.
(A and B) High-resolution particle images before (A) and after (B) removal of cells cultured in osteogenic media for 7 days. Pseudocolor maps of enlarged particle images indicated by red arrows are shown on the right side of (B). Particles show very smooth structures without crystals. (C) Scanning electron microscopy (SEM) images and EDX spectrometric analysis of particles on a SiN film. SEM image on the left side exhibits the SiN film after removal of cells cultured in normal media, which shows no particles, and EDX spectrometric data show no peaks of phosphorus and calcium. In contrast, the SEM image and EDX spectrometric data on the right side show particles and sharp peaks of phosphorus and calcium after culture in osteogenic media. (D) Analysis of particle elements using EDX spectrometric maps. Particles contained phosphorus, calcium, carbon, and nitrogen. (E) Raman spectra obtained from osteoblasts cultured with or without osteogenic media for 23 days. Sharp peak of 960 cm−1 was evident only in osteogenic media (right side). a.u., arbitrary units. (F) Comparison of SE-ADM images of Alpl knockout (KO) osteoblasts in normal and osteogenic media. Particles completely disappeared in osteogenic media. (G) EDX spectrum of particles from Alpl KO osteoblasts on a SiN film. Left-side EDX spectrometric data exhibit the SiN film after removal of cells cultured in normal media, which show no peaks of phosphorus and calcium. Moreover, particles in osteogenic media of right-side data show no peaks in phosphorus and calcium. Scale bars, 1 μm in (A), (C, top), (D), and (F); 200 nm in (B); 100 nm in (B, right).
Fig. 3
Fig. 3. Lysosomal inhibitors block mineralization.
(A and C) Confocal live imaging of 50 nM BafA-or 10 μM Vac-1–treated osteoblasts. Cells were cultured in osteogenic media containing BafA or Vac-1 and stained with Hoechst 33342 and LysoTracker Insets show higher magnification and boxed area of each channel. (B and D) SD-ADM images of BafA- or Vac-1–treated osteoblasts. Cells were cultured in osteogenic media containing BafA or Vac-1. (E) Alizain Red S staining performed without fixation. Cells were cultured in osteogenic media containing BafA or Vac-1 and stained with Alizain Red S. Representative confocal images. Scale bars, 50 μm in (A), (C), and (E); 2 μm (B) and (D).
Fig. 4
Fig. 4. Super-resolution live imaging of calcium containing vesicle transports via lysosomes.
(A) Snapshot of time-lapse SRM images of calcein-labeled osteoblasts. Cells were cultured with calcein and stained with Lysotracker and MitoTracker. White arrows indicate colocalization of lysosomes and calcein-positive vesicles. (B) Close-up of time-lapse SRM images of calcein-labeled osteoblasts. Red arrowheads indicate lysosome, and green arrowheads indicate calcein. Once lysosomes fused to calcein-positive vesicles adjacent to mitochondria, they started to move toward extracellular space. (C) Representative SRM image of LAMP1-mCherry–expressing cells. Cells were transfected with LAMP1-mCherry plasmid, cultured with calcein, and stained with MitoTracker. Calcein-positive vesicles matched to LAMP1-mCherry–positive lysosomes. (D) Schematic view of lysosomal involvement in transportation of calcium in mineralizing osteoblasts. Scale bars, 2 μm in (A), 1 μm in (B), and 10 μm in (C).

References

    1. Weiner S., Addadi L., Crystallization pathways in biomineralization. Annu. Rev. Mat. Res. 41, 21–40 (2011).
    1. Reznikov N., Steele J. A. M., Fratzl P., Stevens M. M., A materials science vision of extracellular matrix mineralization. Nat. Rev. Mater. 1, 16041 (2016).
    1. Anderson H. C., Electron microscopic studies of induced cartilage development and calcification. J. Cell Biol. 35, 81–101 (1967). - PMC - PubMed
    1. Bonucci E., Fine structure of early cartilage calcification. J. Ultrastruct. Res. 20, 33–50 (1967). - PubMed
    1. Omelon S., Ariganello M., Bonucci E., Grynpas M., Nanci A., A review of phosphate mineral nucleation in biology and geobiology. Calcif. Tissue Int. 93, 382–396 (2013). - PMC - PubMed

Publication types

LinkOut - more resources