. 2019 Jul 3;5(7):eaax2887.
doi: 10.1126/sciadv.aax2887. eCollection 2019 Jul.

CATACOMB: An endogenous inducible gene that antagonizes H3K27 methylation activity of Polycomb repressive complex 2 via an H3K27M-like mechanism

Affiliations

CATACOMB: An endogenous inducible gene that antagonizes H3K27 methylation activity of Polycomb repressive complex 2 via an H3K27M-like mechanism

Andrea Piunti et al. Sci Adv. .

Abstract

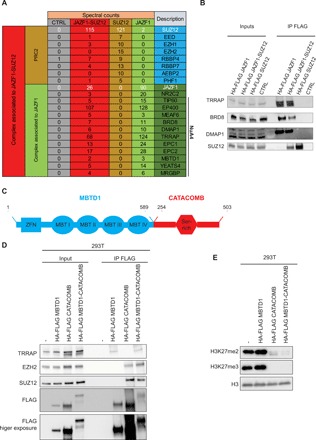
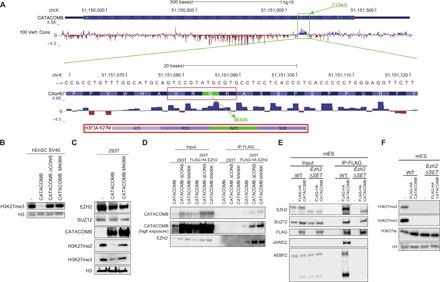
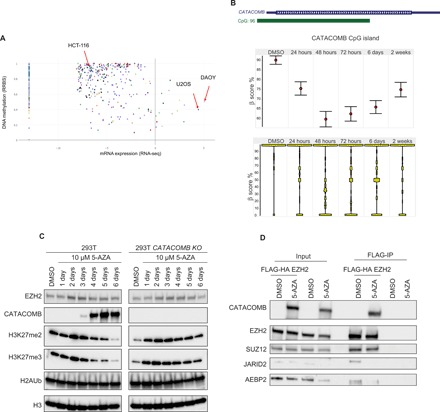
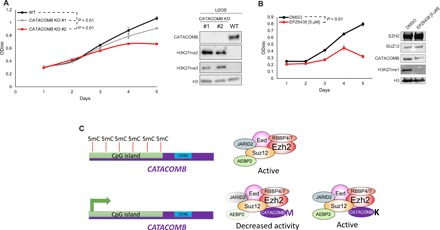
Using biochemical characterization of fusion proteins associated with endometrial stromal sarcoma, we identified JAZF1 as a new subunit of the NuA4 acetyltransferase complex and CXORF67 as a subunit of the Polycomb Repressive Complex 2 (PRC2). Since CXORF67's interaction with PRC2 leads to decreased PRC2-dependent H3K27me2/3 deposition, we propose a new name for this gene: CATACOMB (catalytic antagonist of Polycomb; official gene name: EZHIP ). We map CATACOMB's inhibitory function to a short highly conserved region and identify a single methionine residue essential for diminution of H3K27me2/3 levels. Remarkably, the amino acid sequence surrounding this critical methionine resembles the oncogenic histone H3 Lys27-to-methionine (H3K27M) mutation found in high-grade pediatric gliomas. As CATACOMB expression is regulated through DNA methylation/demethylation, we propose CATACOMB as the potential interlocutor between DNA methylation and PRC2 activity. We raise the possibility that similar regulatory mechanisms could exist for other methyltransferase complexes such as Trithorax/COMPASS.


Figures

Fig. 1
Fig. 1. JAZF1 and CATACOMB are a NuA4 and a PRC2 subunit, respectively.
(A) Schematic representation of mass spectrometry data obtained from FLAG IPs from hEnSC wild type (WT) (CTRL), expressing the HA-FLAG versions of the JAZF1-SUZ12 fusion protein, SUZ12, or JAZF1. Numbers represent spectral counts. The far-right columns list the protein identification symbols. JAZF1 and SUZ12 (or JAZF1-SUZ12 in the fusion-expressing cells) are shown in white type face, as are the numbers for their spectral counts obtained in each experiment. The previously identified subunits for NuA4 are indicated. (B) FLAG-IP in HCT-116 cells that are either WT or express HA-FLAG versions of the JAZF1-SUZ12 fusion protein, full-length SUZ12, or full-length JAZF1. Ten percent of the input and 50% of the IP material were loaded for Western blot analysis. Antibodies used for Western blotting are indicated in the panel. (C) Schematic representation of the MBTD1-CATACOMB putative fusion protein including the domain previously reported. Numbers in black represent the amino acid residues. The MBTD1 portion is in blue, and the CATACOMB portion is in red. (D) FLAG-IP in 293T cells WT (−), expressing HA-FLAG versions of the MBTD1-CATACOMB putative fusion protein, full-length MBTD1, or full-length CATACOMB. Ten percent of the input and 50% of the IP material were loaded for Western blot analysis. Antibodies used for Western blotting are indicated in the panel. (E) Western blotting of chromatin extracts from cells described in (D). Antibodies used for Western blotting are indicated in the panel. Histone H3 (H3) served as a loading control.
Fig. 2
Fig. 2. A conserved region in CATACOMB is responsible for H3K27me2/3 global reduction.
(A) Schematic representation of the CATACOMB gene locus with PhyloP-generated scores in hg19 genome assembly. Negative scores are represented by red tracks for predicted acceleration, and positive scores are represented by blue tracks, for predicted conservation in 100 vertebrates (Vert.) (species list can be found in the University of California Santa Cruz genome browser). Top: The green box indicates the highly conserved region named CONS. Bottom: A zoom-in of the CONS region at DNA and amino acid levels. The red box indicates the four amino acid residues, including M406, that resemble the sequence surrounding the H3K27M mutant histone, which is shown below for comparison. (B) Western blotting of total cell extracts from SV40 immortalized hEnSC WT (−) expressing CATACOMB, CATACOMB without the CONS domain (ΔCONS), and CATACOMB containing a methionine-to-lysine mutation in position 406 (M406K). Antibodies used for Western blotting are indicated in the panel. H3 served as a loading control. (C) Western blotting of total cell extract from 293T cells (−) or 293T cells expressing CATACOMB or the CATACOMB M406K mutant. Antibodies used for Western blotting are indicated in the panel. H3 served as a loading control. (D) FLAG-IP in 293T cells that are WT or express FLAG-HA EZH2. In both cells lines, we expressed untagged CATACOMB, CATACOMBΔ CONS, or CATACOMB M406K. Ten percent of the input and 50% of the IP material were loaded for Western blot analysis. Antibodies used for Western blotting are indicated in the panel. (E) FLAG-IP in mESCs that are either WT or Ezh2ΔSET. In both cells lines, we expressed FLAG-HA CATACOMB. Cells with no FLAG-HA CATACOMB expression were used as negative control (−). Five percent of the input and 30% of the IP material were loaded for Western blot analysis. Antibodies used for Western blotting are indicated in the panel. (F) Western blotting of chromatin extracts from cells described in (E). Antibodies used for Western blotting are indicated in the panel. H3 served as a loading control.
Fig. 3
Fig. 3. CATACOMB expression and interaction with PRC2 complex are induced by DNA demethylation.
(A) CCLE-generated scatterplot to quantify CATACOMB expression and CATACOMB locus methylation levels using 826 different cell lines, each represented by a dot. The x axis represents mRNA expression levels (cells with values below 0 have no or negligible expression), and the y axis represents DNA methylation levels (0 to 1 values range from unmethylated to fully methylated). (B) Top: Schematic representation of the CATACOMB locus with the associated CpG island from the hg19 genome assembly. Middle: Star Wars plots of CG methylation status of the CATACOMB-associated CpG island during a time course with 10 μM 5-AZA treatment in 293T cells. Dimethyl sulfoxide (DMSO) (vehicle control) and the time points of treatment are indicated above. The red circles indicate the mean levels of CG methylation for each time point. Error bars represent SEs. Bottom: Same as in (B) showing total distribution of CG methylation at each time point. (C) Western blotting of total cell extracts from a time course treatment in 293T and 293T CATACOMB KO cells after a single administration of 10 μM 5-AZA. Antibodies used for Western blotting are indicated in the panel. H3 served as a loading control. (D). FLAG-IP in 293T cells that are WT or express FLAG-HA EZH2. Both cell lines were treated with either 10 μM 5-AZA or DMSO (vehicle control) for a week. In both cells lines, we expressed FLAG-HA CATACOMB. Ten percent of the input and 50% of the IP material were loaded for Western blot analysis. Antibodies used for Western blotting are indicated in the panel.
Fig. 4
Fig. 4. CATACOMB and PRC2 catalytic activity are required for U2OS proliferation.
(A) Left: Growth curve comparison between U2OS WT parental cells and U2OS CATACOMB KO clones. Absorbance of crystal violet in 10% acetic acid was used to represent the cell number and plotted as optical density (OD) (λ = 590). n = 3. Error bars represent SDs. Right: Western blotting of total cell extracts from cells described in the left part of the panel. Antibodies used for Western blotting are indicated in the panel. H3 served as a loading control. P values were calculated using the areas under the curves. (B) Left: Growth curve comparison between U2OS cells treated with 5 μM EPZ6438 (EZH2 inhibitor) or DMSO (vehicle control). Cells were pretreated for 6 days, every other day for 6 days, and kept on the same regimen during the 5 days that the proliferation was assessed. Absorbance of crystal violet in 10% acetic acid was used to represent the cell number and plotted as OD (λ = 590). n = 3. Error bars represent SDs. Right: Western blotting of total cell extracts from cells shown in the left panel. Antibodies used for Western blotting are indicated in the panel. H3 served as a loading control. (C) Working model proposed by our study. CATACOMB is kept silenced by DNA methylation; once demethylation occurs, the gene is activated, the protein product binds to the PRC2, and through the conserved M406 residue decreases PRC2 activity. Single methionine-to-lysine mutation (M406K) abolishes CATACOMB inhibitory activity toward PRC2 without disrupting the binding between CATACOMB and PRC2.

References

    1. Piunti A., Pasini D., Epigenetic factors in cancer development: Polycomb group proteins. Future Oncol. 7, 57–75 (2011). - PubMed
    1. Piunti A., Shilatifard A., Epigenetic balance of gene expression by Polycomb and COMPASS families. Science 352, aad9780 (2016). - PubMed
    1. Koontz J. I., Soreng A. L., Nucci M., Kuo F. C., Pauwels P., van den Berghe H., Cin P. D., Fletcher J. A., Sklar J., Frequent fusion of the JAZF1 and JJAZ1 genes in endometrial stromal tumors. Proc. Natl. Acad. Sci. U.S.A. 98, 6348–6353 (2001). - PMC - PubMed
    1. Schuettengruber B., Chourrout D., Vervoort M., Leblanc B., Cavalli G., Genome regulation by polycomb and trithorax proteins. Cell 128, 735–745 (2007). - PubMed
    1. Hrzenjak A., JAZF1/SUZ12 gene fusion in endometrial stromal sarcomas. Orphanet J. Rare Dis. 11, 15 (2016). - PMC - PubMed

Publication types

MeSH terms