A Randomized, Placebo-Controlled, Pilot Clinical Trial of Dipyridamole to Decrease Human Immunodeficiency Virus-Associated Chronic Inflammation
- PMID: 31282542
- PMCID: PMC7184919
- DOI: 10.1093/infdis/jiz344
A Randomized, Placebo-Controlled, Pilot Clinical Trial of Dipyridamole to Decrease Human Immunodeficiency Virus-Associated Chronic Inflammation
Abstract
Background: Adenosine is a potent immunoregulatory nucleoside produced during inflammatory states to limit tissue damage. We hypothesized that dipyridamole, which inhibits cellular adenosine uptake, could raise the extracellular adenosine concentration and dampen chronic inflammation associated with human immunodeficiency virus (HIV) type 1.
Methods: Virally suppressed participants receiving antiretroviral therapy were randomized 1:1 for 12 weeks of dipyridamole (100 mg 4 times a day) versus placebo capsules. All participants took open-label dipyridamole during weeks 12-24. Study end points included changes in markers of systemic inflammation (soluble CD163 and CD14, and interleukin 6) and levels of T-cell immune activation (HLA-DR+CD38+).
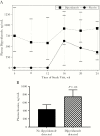
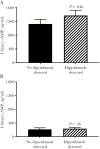
Results: Of 40 participants who were randomized, 17 dipyridamole and 18 placebo recipients had baseline and week 12 data available for analyses. There were no significant changes in soluble markers, apart from a trend toward decreased levels of soluble CD163 levels (P = .09). There was a modest decrease in CD8+ T-cell activation (-17.53% change for dipyridamole vs +13.31% for placebo; P = .03), but the significance was lost in the pooled analyses (P = .058). Dipyridamole also reduced CD4+ T-cell activation (-11.11% change; P = .006) in the pooled analyses. In post hoc analysis, detectable plasma dipyridamole levels were associated with higher levels of inosine, an adenosine surrogate, and of cyclic adenosine monophosphate.
Conclusion: Dipyridamole increased extracellular adenosine levels and decreased T-cell activation significantly among persons with HIV-1 infection receiving virally suppressive therapy.
Keywords: HIV; adenosine; dipyridamole; inflammation.
© The Author(s) 2019. Published by Oxford University Press for the Infectious Diseases Society of America. All rights reserved. For permissions, e-mail: journals.permissions@oup.com.
Figures


Comment in
-
Immune Activation and Inflammation in People With Human Immunodeficiency Virus: Challenging Targets.J Infect Dis. 2020 Apr 27;221(10):1567-1570. doi: 10.1093/infdis/jiz351. J Infect Dis. 2020. PMID: 31282534 Free PMC article. No abstract available.
References
Publication types
MeSH terms
Substances
Grants and funding
LinkOut - more resources
Full Text Sources
Medical
Research Materials

