

Analysis of Electrochemical Properties of S-Adenosyl-l-methionine and Implications for Its Role in Radical SAM Enzymes
- PMID: 31283208
- PMCID: PMC7059804
- DOI: 10.1021/jacs.9b00933
Analysis of Electrochemical Properties of S-Adenosyl-l-methionine and Implications for Its Role in Radical SAM Enzymes
Abstract
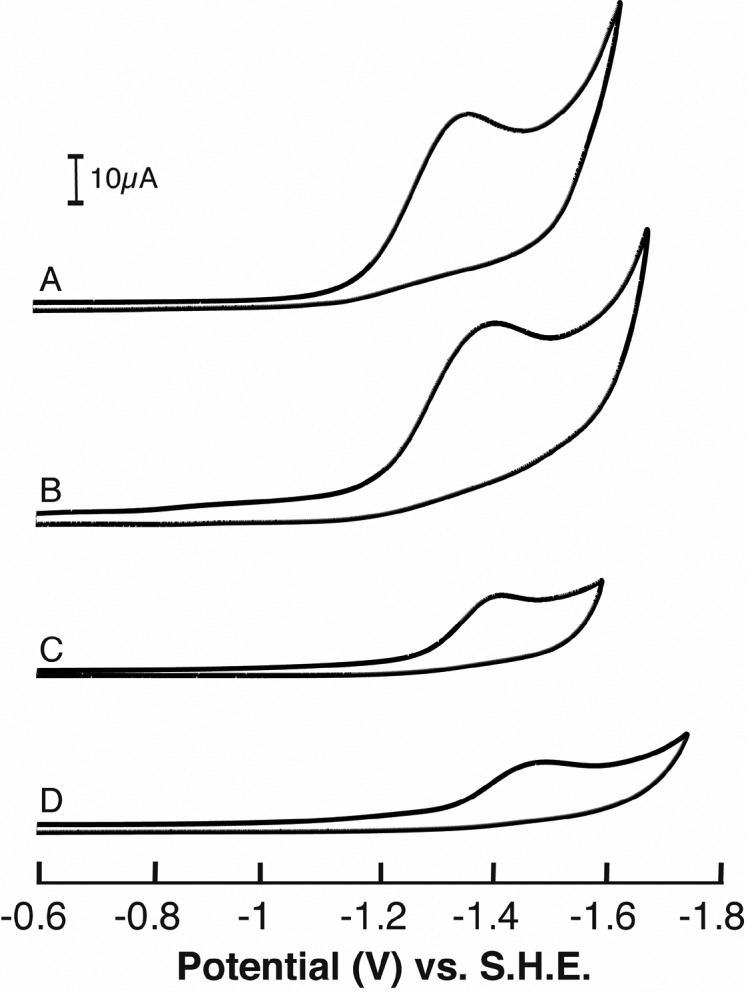
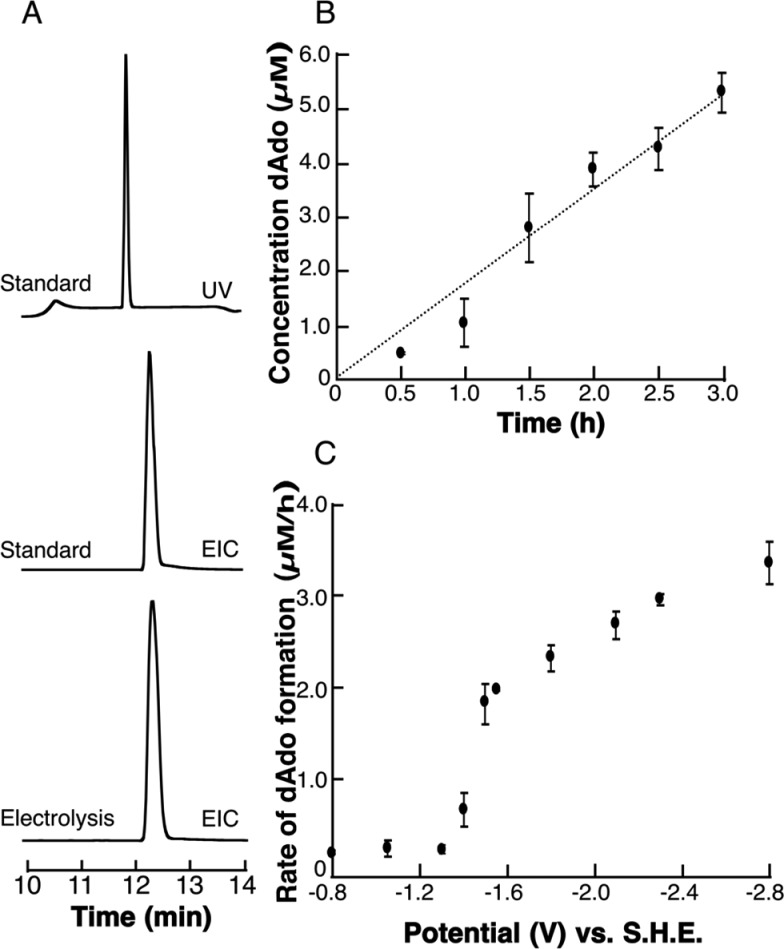
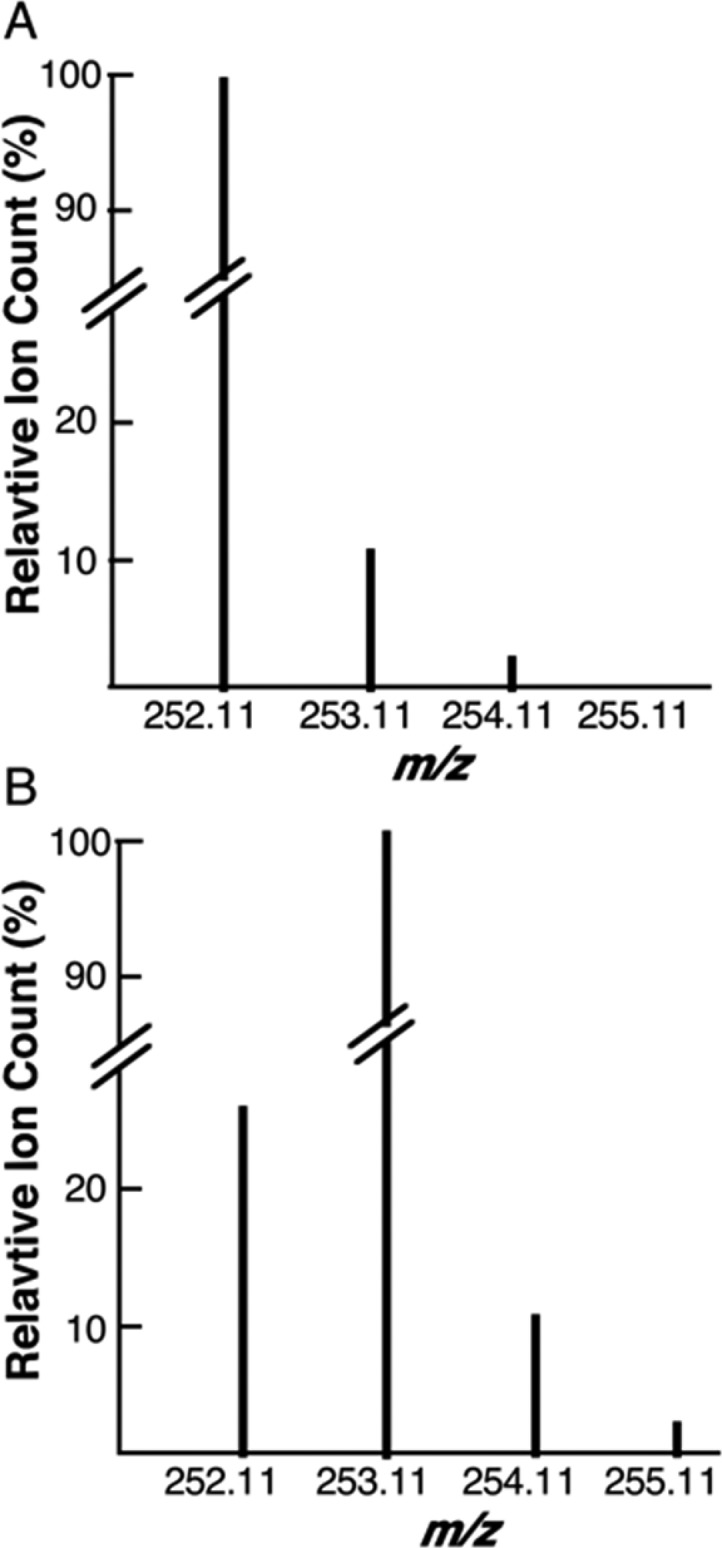
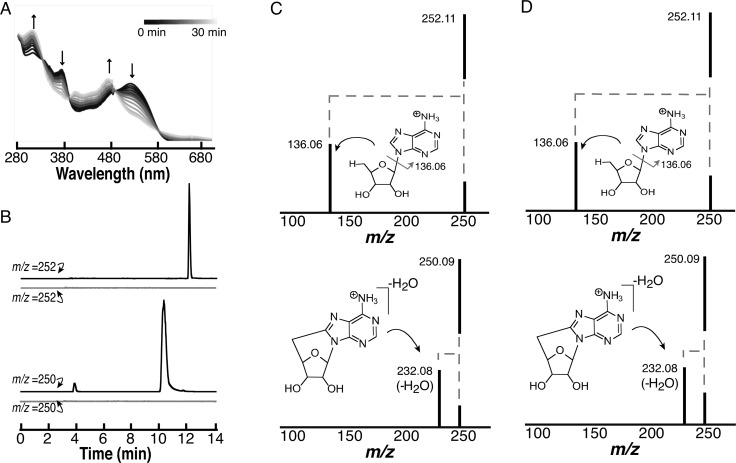
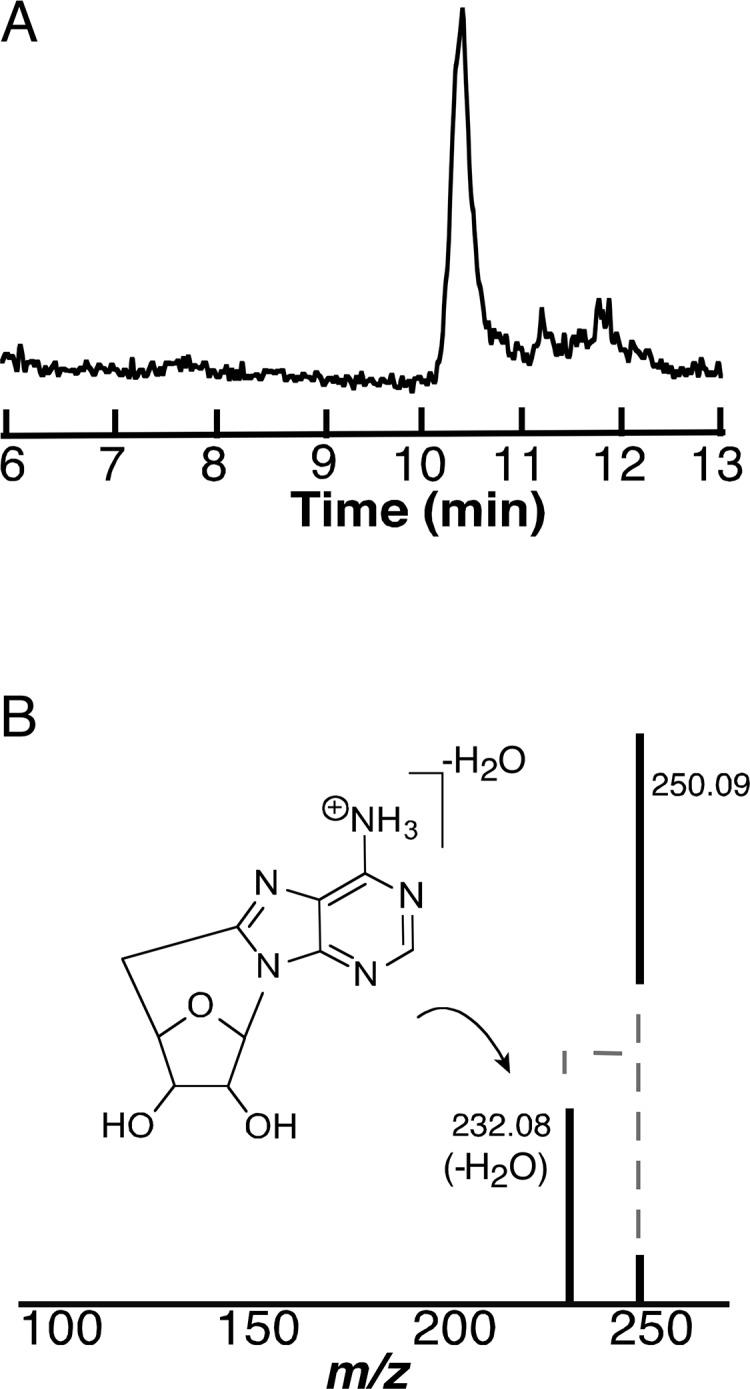
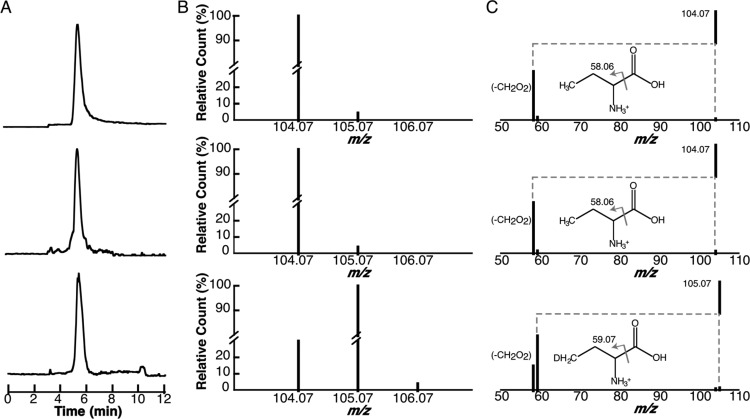
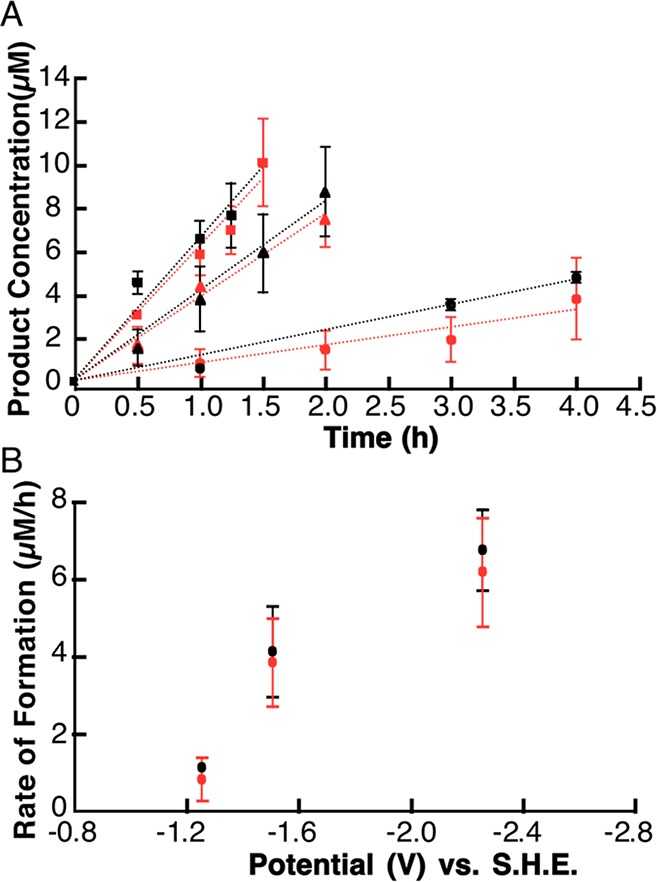
S-Adenosyl-l-methionine (SAM) is the central cofactor in the radical SAM enzyme superfamily, responsible for a vast number of transformations in primary and secondary metabolism. In nearly all of these reactions, the reductive cleavage of SAM is proposed to produce a reactive species, 5'-deoxyadenosyl radical, which initiates catalysis. While the mechanistic details in many cases are well-understood, the reductive cleavage of SAM remains elusive. In this manuscript, we have measured the solution peak potential of SAM to be ∼-1.4 V (v SHE) and show that under controlled potential conditions, it undergoes irreversible fragmentation to the 5'-deoxyadenosyl radical. While the radical intermediate is not directly observed, its presence as an initial intermediate is inferred by the formation of 8,5'-cycloadenosine and by H atom incorporation into 5'-deoxyadenosine from solvent exchangeable site. Similarly, 2-aminobutyrate is also observed under electrolysis conditions. The implications of these results in the context of the reductive cleavage of SAM by radical SAM enzymes are discussed.
Conflict of interest statement
The authors declare no competing financial interest.
Figures
Similar articles
-
Mechanism of Radical Initiation in the Radical S-Adenosyl-l-methionine Superfamily.Acc Chem Res. 2018 Nov 20;51(11):2611-2619. doi: 10.1021/acs.accounts.8b00356. Epub 2018 Oct 15. Acc Chem Res. 2018. PMID: 30346729 Free PMC article. Review.
-
Radical SAM activation of the B12-independent glycerol dehydratase results in formation of 5'-deoxy-5'-(methylthio)adenosine and not 5'-deoxyadenosine.Biochemistry. 2011 Feb 1;50(4):440-2. doi: 10.1021/bi101255e. Epub 2011 Jan 5. Biochemistry. 2011. PMID: 21182298
-
7-Carboxy-7-deazaguanine Synthase: A Radical S-Adenosyl-l-methionine Enzyme with Polar Tendencies.J Am Chem Soc. 2017 Feb 8;139(5):1912-1920. doi: 10.1021/jacs.6b11381. Epub 2017 Jan 25. J Am Chem Soc. 2017. PMID: 28045519 Free PMC article.
-
Auxiliary iron-sulfur cofactors in radical SAM enzymes.Biochim Biophys Acta. 2015 Jun;1853(6):1316-34. doi: 10.1016/j.bbamcr.2015.01.002. Epub 2015 Jan 15. Biochim Biophys Acta. 2015. PMID: 25597998 Review.
-
Radical SAM enzymes involved in the biosynthesis of purine-based natural products.Biochim Biophys Acta. 2012 Nov;1824(11):1245-53. doi: 10.1016/j.bbapap.2012.07.014. Epub 2012 Aug 3. Biochim Biophys Acta. 2012. PMID: 22902275 Free PMC article. Review.
Cited by
-
Active-Site Controlled, Jahn-Teller Enabled Regioselectivity in Reductive S-C Bond Cleavage of S-Adenosylmethionine in Radical SAM Enzymes.J Am Chem Soc. 2021 Jan 13;143(1):335-348. doi: 10.1021/jacs.0c10925. Epub 2020 Dec 29. J Am Chem Soc. 2021. PMID: 33372786 Free PMC article.
-
Journey on the Radical SAM Road as an Accidental Pilgrim.ACS Bio Med Chem Au. 2022 Jun 15;2(3):187-195. doi: 10.1021/acsbiomedchemau.1c00059. Epub 2022 Feb 28. ACS Bio Med Chem Au. 2022. PMID: 35726327 Free PMC article. Review.
-
Initiation, Propagation, and Termination in the Chemistry of Radical SAM Enzymes.Biochemistry. 2024 Dec 17;63(24):3161-3183. doi: 10.1021/acs.biochem.4c00518. Epub 2024 Dec 3. Biochemistry. 2024. PMID: 39626071 Free PMC article. Review.
-
Engineering of Methionine Adenosyltransferase Reveals Key Roles of Electrostatic Interactions in Enhanced Catalytic Activity.Appl Biochem Biotechnol. 2024 Jun;196(6):3246-3259. doi: 10.1007/s12010-023-04676-7. Epub 2023 Aug 29. Appl Biochem Biotechnol. 2024. PMID: 37642924
-
Insights into electrochemiluminescence dynamics by synchronizing real-time electrical, luminescence, and mass spectrometric measurements.Chem Sci. 2022 May 5;13(21):6244-6253. doi: 10.1039/d2sc01317g. eCollection 2022 Jun 1. Chem Sci. 2022. PMID: 35733885 Free PMC article.
References
-
- Moss M.; Frey P. A. J. Biol. Chem. 1987, 262, 14859. - PubMed
MeSH terms
Substances
Grants and funding
LinkOut - more resources
Full Text Sources
