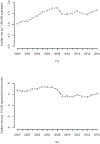
Trends and patterns in fatal US motorcycle crashes, 2000-2016
- PMID: 31283363
- PMCID: PMC6706857
- DOI: 10.1080/15389588.2019.1628224
Trends and patterns in fatal US motorcycle crashes, 2000-2016
Abstract
Objective: To investigate trends of motorcyclist fatalities and identify at-risk populations by motorcyclist demographics and crash characteristics. Methods: We used the Fatality Analysis Reporting System (FARS) database (2000-2016) to track fatality rate trends, which were quantified by using Poisson mixed-effects regression models comparing 2000-2001 and 2007-2008, as well as 2009-2010 and 2015-2016. Results: The overall fatality rate per 100,000 population increased from 2000 to 2016, defined by two trend lines-before and after the economic recession in 2008-2009. The overall fatality rate ratio between 2000-2001 and 2007-2008 was 1.60 [95% Confidence Interval (CI): 1.51-1.70], and between 2009-2010 and 2015-2016 was 1.09 (95% CI: 1.02-1.18). Fatality rates increased among all age groups, particularly for motorcyclists aged 60 and older. Those aged 18-29 had the highest fatality rates overall. Age-and-sex standardized state fatality rates were consistently highest in Wyoming, South Dakota, and South Carolina and lowest in Massachusetts, New York and New Jersey. Conclusion: Motorcycle fatality rates increased overall and across all age groups between 2000 and 2016. Fatalities for the oldest riders showed the steadiest increasing trends. Results highlight the continued public health burden of motorcyclist fatalities and, by extension, the importance of improving motorcycle safety.
Keywords: Motorcycle; age; fatality; trends.
Figures


Similar articles
-
Macroeconomic fluctuations and motorcycle fatalities in the U.S.Soc Sci Med. 2014 Mar;104:187-93. doi: 10.1016/j.socscimed.2013.12.019. Epub 2013 Dec 27. Soc Sci Med. 2014. PMID: 24581077
-
Factors associated with motorcycle traffic crash fatalities among active duty U.S. Army personnel.Traffic Inj Prev. 2019;20(2):174-181. doi: 10.1080/15389588.2018.1532082. Epub 2019 Apr 4. Traffic Inj Prev. 2019. PMID: 30946596
-
Modeling the effect of operator and passenger characteristics on the fatality risk of motorcycle crashes.J Inj Violence Res. 2016 Jan;8(1):35-42. doi: 10.5249/jivr.v8i1.650. Epub 2015 Sep 26. J Inj Violence Res. 2016. PMID: 26420217 Free PMC article.
-
Trends in motorcycle fatalities associated with alcohol-impaired driving--United States, 1983-2003.MMWR Morb Mortal Wkly Rep. 2004 Dec 3;53(47):1103-6. MMWR Morb Mortal Wkly Rep. 2004. PMID: 15573026
-
The burden of unhelmeted motorcycle injury: A nationwide scoring-based analysis of helmet safety legislation.Injury. 2023 Mar;54(3):848-856. doi: 10.1016/j.injury.2023.01.013. Epub 2023 Jan 3. Injury. 2023. PMID: 36646531
Cited by
-
Collision Course: A Decade of Traumatic Brain Injury Trends and the Impact of Urban Safety Initiatives in Eastern Massachusetts.J Clin Med. 2025 Aug 18;14(16):5825. doi: 10.3390/jcm14165825. J Clin Med. 2025. PMID: 40869651 Free PMC article.
-
Comparing distance and time as driving exposure measures to evaluate fatal crash risk ratios.Accid Anal Prev. 2020 Jul;142:105576. doi: 10.1016/j.aap.2020.105576. Epub 2020 May 14. Accid Anal Prev. 2020. PMID: 32417357 Free PMC article.
References
-
- Centers for Disease Control and Prevention (CDC). Bridged-race population estimates - data files and documentation [tables] 2018. Available at https://www.cdc.gov/nchs/nvss/bridged_race/data_documentation.htm. Accessed March 1, 2018.
-
- Centers for Disease Control and Prevention (CDC). 10 leading causes of injury deaths by age group highlighting unintentional injury deaths, United States-2016 [table] 2016. Available at https://www.cdc.gov/injury/images/lc-charts/leading_causes_of_death_high.... Accessed September 18, 2018.
-
- Federal Highway Administration (FHWA). Highway Statistics Series Publications, 2000–2016. State motor-vehicle registrations. (Table MV-1 for each respective year) 2001–2017. Available at https://www.fhwa.dot.gov/policyinformation/statistics.cfm. Accessed July 2, 2018.
-
- Fitzpatrick D, O’Neill D. Older motorcyclists in Ireland. Ir Med J 2017;110(6):585. - PubMed
Publication types
MeSH terms
Grants and funding
LinkOut - more resources
Full Text Sources
Other Literature Sources
