Review
. 2019 Jul-Aug;39(4):1205-1229.
doi: 10.1148/rg.2019180173.

MRI of Tumors and Tumor Mimics in the Female Pelvis: Anatomic Pelvic Space-based Approach

Affiliations
Review

MRI of Tumors and Tumor Mimics in the Female Pelvis: Anatomic Pelvic Space-based Approach

Stephanie Nougaret et al. Radiographics. 2019 Jul-Aug.

Abstract

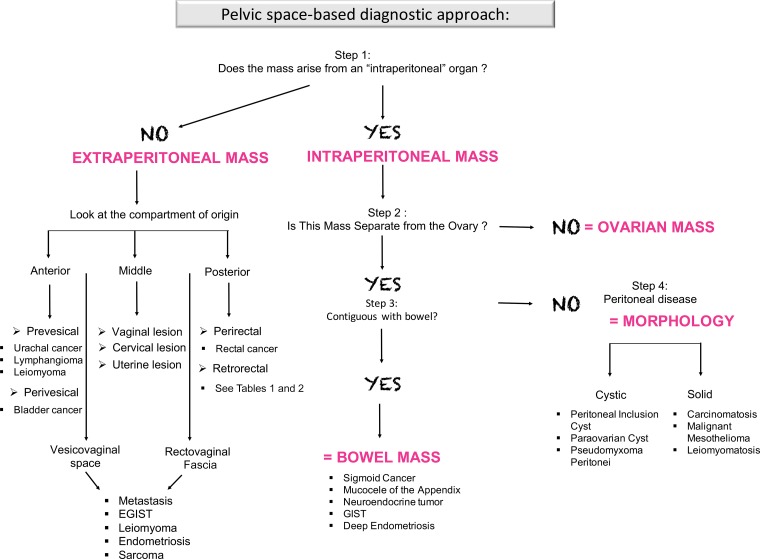
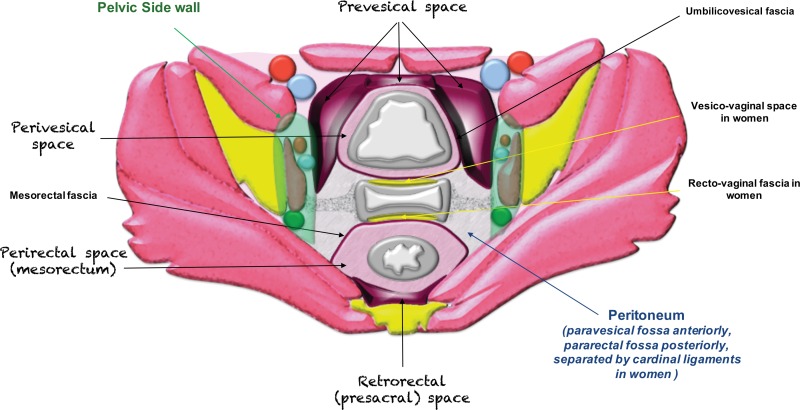
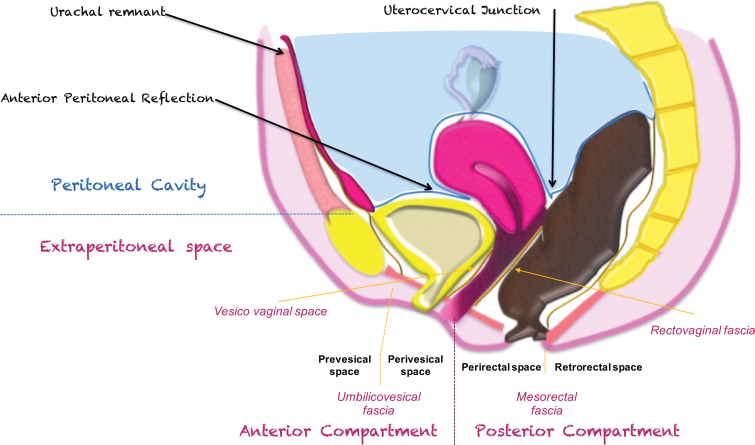
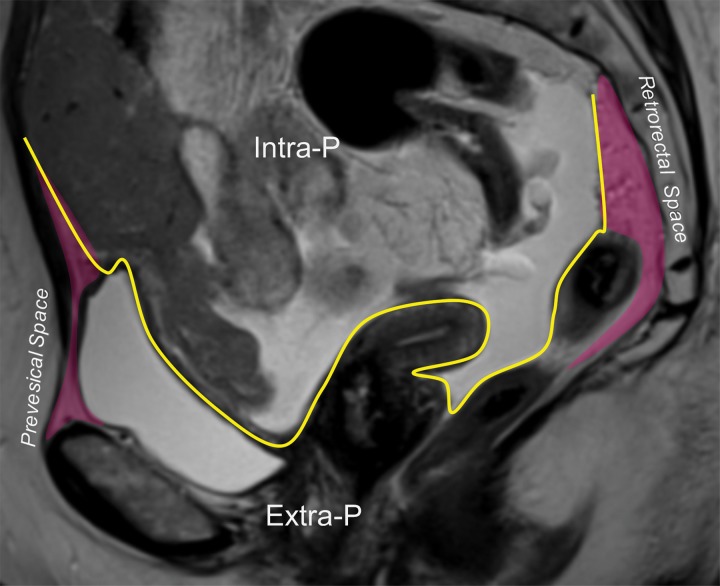
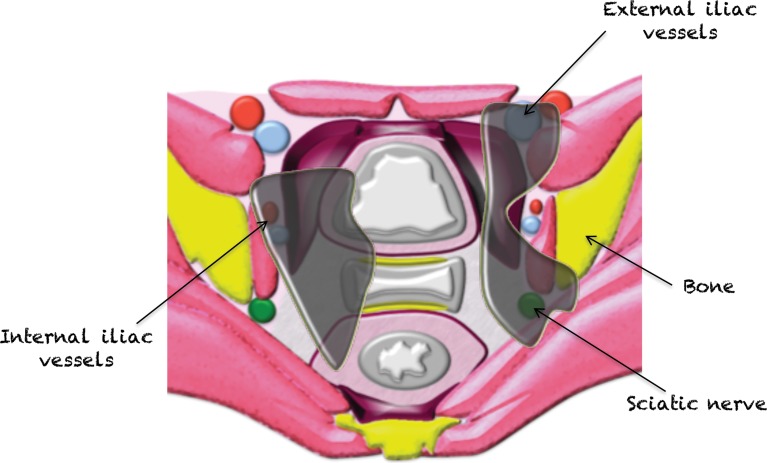
Pelvic masses can present a diagnostic challenge owing to the difficulty in assessing their origin and the overlap in imaging features. The majority of pelvic tumors arise from gastrointestinal or genitourinary organs, with less common sites of origin including the connective tissues, nerves, and lymphovascular structures. Lesion evaluation usually starts with clinical assessment followed by imaging, or the lesion may be an incidental finding at imaging performed for other clinical indications. Since accurate diagnosis is essential for optimal management, imaging is useful for suggesting the correct diagnosis or narrowing the differential possibilities and distinguishing tumors from their mimics. Some masses may require histologic confirmation of the diagnosis with biopsy and/or up-front surgical resection. In this case, imaging is essential for presurgical planning to assess mass size and location, evaluate the relationship to adjacent pelvic structures, and narrow differential possibilities. Pelvic US is often the first imaging modality performed in women with pelvic symptoms. While US is often useful to detect a pelvic mass, it has significant limitations in assessing masses located deep in the pelvis or near gas-filled organs. CT also has limited value in the pelvis owing to its inferior soft-tissue contrast. MRI is frequently the optimal imaging modality, as it offers both multiplanar capability and excellent soft-tissue contrast. This article highlights the normal anatomy of the pelvic spaces in the female pelvis and focuses on MRI features of common tumors and tumor mimics that arise in these spaces. It provides an interpretative algorithm for approaching an unknown pelvic lesion at MRI. It also discusses surgical management, emphasizing the value of MRI as a road map to surgery and highlighting anatomic locations where surgical resection may present a challenge. ©RSNA, 2019.


Figures

Figure 1.
Figure 1.
Flowchart shows a step-by-step approach to lesion characterization in the female pelvis. First, it is important to determine if a mass is peritoneal or extraperitoneal in location. If the mass arises from one of the intraperitoneal organs or peritoneal cavity, evaluation of the ovaries (in women), the bowel, and tumor morphology is useful to narrow the differential possibilities. If the mass is extraperitoneal in location, it is useful to determine the pelvic space where the mass is situated. EGIST = extragastrointestinal stromal tumor, GIST = gastrointestinal stromal tumor.
Figure 2.
Figure 2.
Drawing of an axial plane through the female pelvis shows the extraperitoneal spaces.
Figure 3a.
Figure 3a.
(a) Drawing of a midsagittal plane through the female pelvis shows the peritoneal reflection that divides the pelvis into the peritoneal and extraperitoneal compartments. (b) Sagittal T2-weighted MR image shows the anterior peritoneal reflection (yellow line). The presence of ascites makes it easy to identify the anterior peritoneal reflection. Extra-P = extraperitoneal compartment, Intra-P = intraperitoneal compartment.
Figure 3b.
Figure 3b.
(a) Drawing of a midsagittal plane through the female pelvis shows the peritoneal reflection that divides the pelvis into the peritoneal and extraperitoneal compartments. (b) Sagittal T2-weighted MR image shows the anterior peritoneal reflection (yellow line). The presence of ascites makes it easy to identify the anterior peritoneal reflection. Extra-P = extraperitoneal compartment, Intra-P = intraperitoneal compartment.
Figure 4a.
Figure 4a.
Extraperitoneal pelvic masses. R =rectum, U = uterus. (a) Axial T2-weighted image shows a multicystic retrorectal lesion that displaces the rectum anteriorly (white arrow) and effaces the right iliococcygeal muscle (pink arrow), consistent with an extraperitoneal mass (tailgut cyst). (b) Axial contrast-enhanced MR image shows a chordoma in the retrorectal space, causing anterior and central displacement of the uterus (white arrow) and anterior displacement of the left internal iliac vessels (pink arrow). (c, d) Imaging features of pelvic masses that arise in the extraperitoneal space. (c) Drawing shows anterior and central displacement of the rectum by an extraperitoneal mass (white arrow) with mass effect on the pelvic muscles (pink arrow). (d) Drawing shows central displacement of the uterus (white arrow) and anterior displacement of the right iliac vessels (pink arrow).
Figure 4b.
Figure 4b.
Extraperitoneal pelvic masses. R =rectum, U = uterus. (a) Axial T2-weighted image shows a multicystic retrorectal lesion that displaces the rectum anteriorly (white arrow) and effaces the right iliococcygeal muscle (pink arrow), consistent with an extraperitoneal mass (tailgut cyst). (b) Axial contrast-enhanced MR image shows a chordoma in the retrorectal space, causing anterior and central displacement of the uterus (white arrow) and anterior displacement of the left internal iliac vessels (pink arrow). (c, d) Imaging features of pelvic masses that arise in the extraperitoneal space. (c) Drawing shows anterior and central displacement of the rectum by an extraperitoneal mass (white arrow) with mass effect on the pelvic muscles (pink arrow). (d) Drawing shows central displacement of the uterus (white arrow) and anterior displacement of the right iliac vessels (pink arrow).
Figure 4c.
Figure 4c.
Extraperitoneal pelvic masses. R =rectum, U = uterus. (a) Axial T2-weighted image shows a multicystic retrorectal lesion that displaces the rectum anteriorly (white arrow) and effaces the right iliococcygeal muscle (pink arrow), consistent with an extraperitoneal mass (tailgut cyst). (b) Axial contrast-enhanced MR image shows a chordoma in the retrorectal space, causing anterior and central displacement of the uterus (white arrow) and anterior displacement of the left internal iliac vessels (pink arrow). (c, d) Imaging features of pelvic masses that arise in the extraperitoneal space. (c) Drawing shows anterior and central displacement of the rectum by an extraperitoneal mass (white arrow) with mass effect on the pelvic muscles (pink arrow). (d) Drawing shows central displacement of the uterus (white arrow) and anterior displacement of the right iliac vessels (pink arrow).
Figure 4d.
Figure 4d.
Extraperitoneal pelvic masses. R =rectum, U = uterus. (a) Axial T2-weighted image shows a multicystic retrorectal lesion that displaces the rectum anteriorly (white arrow) and effaces the right iliococcygeal muscle (pink arrow), consistent with an extraperitoneal mass (tailgut cyst). (b) Axial contrast-enhanced MR image shows a chordoma in the retrorectal space, causing anterior and central displacement of the uterus (white arrow) and anterior displacement of the left internal iliac vessels (pink arrow). (c, d) Imaging features of pelvic masses that arise in the extraperitoneal space. (c) Drawing shows anterior and central displacement of the rectum by an extraperitoneal mass (white arrow) with mass effect on the pelvic muscles (pink arrow). (d) Drawing shows central displacement of the uterus (white arrow) and anterior displacement of the right iliac vessels (pink arrow).
Figure 5a.
Figure 5a.
Masses arising from intraperitoneal organs or within the peritoneal cavity. R =rectum, U = uterus. (a) Axial T2-weighted image shows posterolateral displacement of the uterus (pink arrow) and lateral deviation of the external iliac vessels (white arrow) by a left ovarian mass. (b) Axial T2-weighted image shows an ovarian fibrothecoma in the rectouterine pouch displacing the uterus anteriorly (pink arrow) and rectum posteriorly (white arrow). (c, d) Imaging features of pelvic masses that arise from intraperitoneal organs. (c) Drawing shows posterior displacement of the uterus (pink arrow) by an intraperitoneal mass and lateral deviation of the external iliac vessels (white arrow). (d) Drawing shows a rectouterine mass displacing the uterus anteriorly (pink arrow) and rectum posteriorly (white arrow).
Figure 5b.
Figure 5b.
Masses arising from intraperitoneal organs or within the peritoneal cavity. R =rectum, U = uterus. (a) Axial T2-weighted image shows posterolateral displacement of the uterus (pink arrow) and lateral deviation of the external iliac vessels (white arrow) by a left ovarian mass. (b) Axial T2-weighted image shows an ovarian fibrothecoma in the rectouterine pouch displacing the uterus anteriorly (pink arrow) and rectum posteriorly (white arrow). (c, d) Imaging features of pelvic masses that arise from intraperitoneal organs. (c) Drawing shows posterior displacement of the uterus (pink arrow) by an intraperitoneal mass and lateral deviation of the external iliac vessels (white arrow). (d) Drawing shows a rectouterine mass displacing the uterus anteriorly (pink arrow) and rectum posteriorly (white arrow).
Figure 5c.
Figure 5c.
Masses arising from intraperitoneal organs or within the peritoneal cavity. R =rectum, U = uterus. (a) Axial T2-weighted image shows posterolateral displacement of the uterus (pink arrow) and lateral deviation of the external iliac vessels (white arrow) by a left ovarian mass. (b) Axial T2-weighted image shows an ovarian fibrothecoma in the rectouterine pouch displacing the uterus anteriorly (pink arrow) and rectum posteriorly (white arrow). (c, d) Imaging features of pelvic masses that arise from intraperitoneal organs. (c) Drawing shows posterior displacement of the uterus (pink arrow) by an intraperitoneal mass and lateral deviation of the external iliac vessels (white arrow). (d) Drawing shows a rectouterine mass displacing the uterus anteriorly (pink arrow) and rectum posteriorly (white arrow).
Figure 5d.
Figure 5d.
Masses arising from intraperitoneal organs or within the peritoneal cavity. R =rectum, U = uterus. (a) Axial T2-weighted image shows posterolateral displacement of the uterus (pink arrow) and lateral deviation of the external iliac vessels (white arrow) by a left ovarian mass. (b) Axial T2-weighted image shows an ovarian fibrothecoma in the rectouterine pouch displacing the uterus anteriorly (pink arrow) and rectum posteriorly (white arrow). (c, d) Imaging features of pelvic masses that arise from intraperitoneal organs. (c) Drawing shows posterior displacement of the uterus (pink arrow) by an intraperitoneal mass and lateral deviation of the external iliac vessels (white arrow). (d) Drawing shows a rectouterine mass displacing the uterus anteriorly (pink arrow) and rectum posteriorly (white arrow).
Figure 6.
Figure 6.
Main suspensory ligaments of gynecologic organs including the ovaries. The broad ligament is a sheet of peritoneum that folds over and covers the surface of the uterus, fallopian tubes, and ovaries. The ovarian ligament is a fibrous band that lies within the broad ligament and connects each ovary to the uterus. The suspensory ligament is a peritoneal fold that contains ovarian vessels and nerves and extends outward from the ovary to the lateral abdominal wall. The beak sign—sharp angles between the ovary and a mass—is suggestive of ovarian origin. If a lesion is extraovarian, a normal ovary is usually seen adjacent to the mass. Peritoneal inclusion cysts surround the ovary, while paraovarian cysts are located next to but separate from the ovary.
Figure 7a.
Figure 7a.
(a) Coronal T2-weighted image in a 15-year-old girl shows multiple ovarian follicles (arrows). (b) Coronal T2-weighted image in a 35-year-old woman shows some ovarian follicles (arrows). (c) Axial T2-weighted image in a 62-year-old woman shows postmenopausal ovaries with homogeneous decreased SI (arrows).
Figure 7b.
Figure 7b.
(a) Coronal T2-weighted image in a 15-year-old girl shows multiple ovarian follicles (arrows). (b) Coronal T2-weighted image in a 35-year-old woman shows some ovarian follicles (arrows). (c) Axial T2-weighted image in a 62-year-old woman shows postmenopausal ovaries with homogeneous decreased SI (arrows).
Figure 7c.
Figure 7c.
(a) Coronal T2-weighted image in a 15-year-old girl shows multiple ovarian follicles (arrows). (b) Coronal T2-weighted image in a 35-year-old woman shows some ovarian follicles (arrows). (c) Axial T2-weighted image in a 62-year-old woman shows postmenopausal ovaries with homogeneous decreased SI (arrows).
Figure 8.
Figure 8.
Coronal T2-weighted fat-suppressed image shows a high SI tubular cystic lesion (arrow) in the right lower quadrant, consistent with a mucocele of the appendix. C = cecum.
Figure 9a.
Figure 9a.
GIST. (a) Sagittal T2-weighted image shows a mass with intermediate SI (white arrow). Note that the mass is located above the anterior peritoneal reflection (black arrow). (b) Axial T2-weighted image shows that the mass arises from the ileum (arrow). (c) Axial contrast-enhanced fat-suppressed T1-weighted image shows poor enhancement of the mass (white arrow) and communication of the mass with the ileum (black arrow). Results of pathologic analysis were consistent with a GIST arising from the distal ileum.
Figure 9b.
Figure 9b.
GIST. (a) Sagittal T2-weighted image shows a mass with intermediate SI (white arrow). Note that the mass is located above the anterior peritoneal reflection (black arrow). (b) Axial T2-weighted image shows that the mass arises from the ileum (arrow). (c) Axial contrast-enhanced fat-suppressed T1-weighted image shows poor enhancement of the mass (white arrow) and communication of the mass with the ileum (black arrow). Results of pathologic analysis were consistent with a GIST arising from the distal ileum.
Figure 9c.
Figure 9c.
GIST. (a) Sagittal T2-weighted image shows a mass with intermediate SI (white arrow). Note that the mass is located above the anterior peritoneal reflection (black arrow). (b) Axial T2-weighted image shows that the mass arises from the ileum (arrow). (c) Axial contrast-enhanced fat-suppressed T1-weighted image shows poor enhancement of the mass (white arrow) and communication of the mass with the ileum (black arrow). Results of pathologic analysis were consistent with a GIST arising from the distal ileum.
Figure 10a.
Figure 10a.
Peritoneal inclusion cyst. (a) Coronal T2-weighted image shows a large hyperintense lesion (*) surrounding the ovary (arrow). The ovary is entrapped by peritoneal adhesions and suspended centrally, producing a characteristic “spider in a web” appearance. (b) Contrast-enhanced T1-weighted image shows smooth mild enhancement, which represents adhesions. Solid enhancing nodules are absent. Note the normal enhancement of the ovary (arrow). * = cyst.
Figure 10b.
Figure 10b.
Peritoneal inclusion cyst. (a) Coronal T2-weighted image shows a large hyperintense lesion (*) surrounding the ovary (arrow). The ovary is entrapped by peritoneal adhesions and suspended centrally, producing a characteristic “spider in a web” appearance. (b) Contrast-enhanced T1-weighted image shows smooth mild enhancement, which represents adhesions. Solid enhancing nodules are absent. Note the normal enhancement of the ovary (arrow). * = cyst.
Figure 11.
Figure 11.
Axial T2-weighted image shows a left paraovarian cyst (white arrow). Note the normal left ovary (black arrow) adjacent to the mass.
Figure 12.
Figure 12.
Midsagittal plane through the female pelvis shows the prevesical space, outlined anteriorly by the transversalis fascia and posteriorly and laterally by the umbilicovesical fascia.
Figure 13.
Figure 13.
Sagittal T2-weighted image shows a midline cystic mass (*) with solid components extending through the bladder dome (black arrow) and into the prevesical space (white arrows), consistent with a urachal adenocarcinoma.
Figure 14.
Figure 14.
Sagittal (left) and axial (right) T2-weighted images show the mesorectum (perirectal space), mesorectal fascia, and retrorectal space.
Figure 15.
Figure 15.
Algorithmic approach to retrorectal masses. Conventional T1-weighted imaging (T1) allows retrorectal masses to be subdivided into two types: T1 hyperintense masses and T1 hypointense masses. T1 hyperintense masses require further assessment with fat-saturated (FS) T1-weighted imaging to distinguish fat from blood. T1 hypointense masses require further evaluation with T2-weighted imaging (T2). T1 hypointense masses can be subdivided into T2 cystic masses and T2 solid masses.
Figure 16.
Figure 16.
Sagittal T2-weighted image shows a cystic mass in the retrorectal space (black arrow) that communicates with the thecal sac (white arrow), consistent with a meningocele.
Figure 17.
Figure 17.
Axial T2-weighted image shows a multicystic lesion with a honeycomb pattern (white arrow), consistent with a tailgut cyst. Note the extraperitoneal location of the lesion, displacing the rectum anteriorly (black arrow).
Figure 18.
Figure 18.
Axial T2-weighted image shows a well-defined moderately hypointense mass (white arrow) located eccentric to the nerve (black arrow), representing a schwannoma.
Figure 19.
Figure 19.
Axial T2-weighted image shows an intermediate-SI retrorectal mass (black arrow) that represents a neurofibroma. Note the fascicular sign with multiple low-SI strands (white arrow), which represent the fascicular bundles within the nerves.
Figure 20a.
Figure 20a.
(a) Sagittal T2-weighted image shows a large retrorectal mass with low-to-intermediate SI due to fibrous tissue (black arrow) and areas of high SI consistent with cystic areas (pink arrow). (b) Axial CT image shows intense enhancement (arrow). Results of pathologic analysis were consistent with solitary fibrous tumor.
Figure 20b.
Figure 20b.
(a) Sagittal T2-weighted image shows a large retrorectal mass with low-to-intermediate SI due to fibrous tissue (black arrow) and areas of high SI consistent with cystic areas (pink arrow). (b) Axial CT image shows intense enhancement (arrow). Results of pathologic analysis were consistent with solitary fibrous tumor.
Figure 21a.
Figure 21a.
(a) Midsagittal plane through the female pelvis shows the vesicovaginal fascia. (b, c) Sagittal (b) and axial (c) T2-weighted images show an intermediate-SI lesion (arrow) in the vesicovaginal fascia. Note the mass effect on the urethra anteriorly and vagina posteriorly. At biopsy, the lesion represented vaginal sarcoma.
Figure 21b.
Figure 21b.
(a) Midsagittal plane through the female pelvis shows the vesicovaginal fascia. (b, c) Sagittal (b) and axial (c) T2-weighted images show an intermediate-SI lesion (arrow) in the vesicovaginal fascia. Note the mass effect on the urethra anteriorly and vagina posteriorly. At biopsy, the lesion represented vaginal sarcoma.
Figure 21c.
Figure 21c.
(a) Midsagittal plane through the female pelvis shows the vesicovaginal fascia. (b, c) Sagittal (b) and axial (c) T2-weighted images show an intermediate-SI lesion (arrow) in the vesicovaginal fascia. Note the mass effect on the urethra anteriorly and vagina posteriorly. At biopsy, the lesion represented vaginal sarcoma.
Figure 22a.
Figure 22a.
(a) Midsagittal plane through the female pelvis shows the rectovaginal fascia. (b, c) Sagittal (b) and axial (c) T2-weighted images show a large mass in the rectovaginal fascia (arrow in b), which communicates with the rectum (arrows in c). At biopsy, the mass was consistent with a GIST.
Figure 22b.
Figure 22b.
(a) Midsagittal plane through the female pelvis shows the rectovaginal fascia. (b, c) Sagittal (b) and axial (c) T2-weighted images show a large mass in the rectovaginal fascia (arrow in b), which communicates with the rectum (arrows in c). At biopsy, the mass was consistent with a GIST.
Figure 22c.
Figure 22c.
(a) Midsagittal plane through the female pelvis shows the rectovaginal fascia. (b, c) Sagittal (b) and axial (c) T2-weighted images show a large mass in the rectovaginal fascia (arrow in b), which communicates with the rectum (arrows in c). At biopsy, the mass was consistent with a GIST.
Figure 23.
Figure 23.
Coronal T2-weighted image shows a hemicircumferential left rectal tumor (*) extending into the puborectalis muscle. Note the intermediate SI of the tumor (arrow) disrupting the low SI of the left puborectalis muscle.
Figure 24a.
Figure 24a.
(a) Axial plane through the female pelvis shows key features important for resection. Involvement of the internal iliac vessels or pelvic organs is not a contraindication to resection. Involvement of the external iliac vessels, bones, or proximal nerves (lumbosacral plexus and sciatic nerve) is a relative contraindication to resection. (b) Axial T2-weighted image shows a recurrence of endometrial cancer with muscular abutment but no invasion (black arrow) and anterior abutment of the external iliac vessels without encasement (white arrow). (c) Contrast-enhanced T1-weighted image shows a recurrence of cervical cancer with encasement of the external iliac vessels (arrow).
Figure 24b.
Figure 24b.
(a) Axial plane through the female pelvis shows key features important for resection. Involvement of the internal iliac vessels or pelvic organs is not a contraindication to resection. Involvement of the external iliac vessels, bones, or proximal nerves (lumbosacral plexus and sciatic nerve) is a relative contraindication to resection. (b) Axial T2-weighted image shows a recurrence of endometrial cancer with muscular abutment but no invasion (black arrow) and anterior abutment of the external iliac vessels without encasement (white arrow). (c) Contrast-enhanced T1-weighted image shows a recurrence of cervical cancer with encasement of the external iliac vessels (arrow).
Figure 24c.
Figure 24c.
(a) Axial plane through the female pelvis shows key features important for resection. Involvement of the internal iliac vessels or pelvic organs is not a contraindication to resection. Involvement of the external iliac vessels, bones, or proximal nerves (lumbosacral plexus and sciatic nerve) is a relative contraindication to resection. (b) Axial T2-weighted image shows a recurrence of endometrial cancer with muscular abutment but no invasion (black arrow) and anterior abutment of the external iliac vessels without encasement (white arrow). (c) Contrast-enhanced T1-weighted image shows a recurrence of cervical cancer with encasement of the external iliac vessels (arrow).

References

    1. Meyers M, Charnsangvej C, Oliphant M. Meyers’ dynamic radiology of the abdomen. New York, NY: Springer, 2011.
    1. Pannu HK, Oliphant M. The subperitoneal space and peritoneal cavity: basic concepts. Abdom Imaging 2015;40(7):2710–2722. - PMC - PubMed
    1. Gollub MJ, Maas M, Weiser M, et al. . Recognition of the anterior peritoneal reflection at rectal MRI. AJR Am J Roentgenol 2013;200(1):97–101. - PubMed
    1. Janvier A, Rousset P, Cazejust J, Bouché O, Soyer P, Hoeffel C. MR imaging of pelvic extraperitoneal masses: a diagnostic approach. Diagn Interv Imaging 2016;97(2):159–170. - PubMed
    1. Bazot M, Deligne L, Boudghène F, Buy JN, Lassau JP, Bigot JM. Correlation between computed tomography and gross anatomy of the suspensory ligament of the ovary. Surg Radiol Anat 1999;21(5):341–346. - PubMed

MeSH terms