. 2019 Jul 7;11(13):4323-4337.
doi: 10.18632/aging.102039.

HMGB1 and Caveolin-1 related to RPE cell senescence in age-related macular degeneration

Affiliations

HMGB1 and Caveolin-1 related to RPE cell senescence in age-related macular degeneration

Shuo Sun et al. Aging (Albany NY). .

Abstract

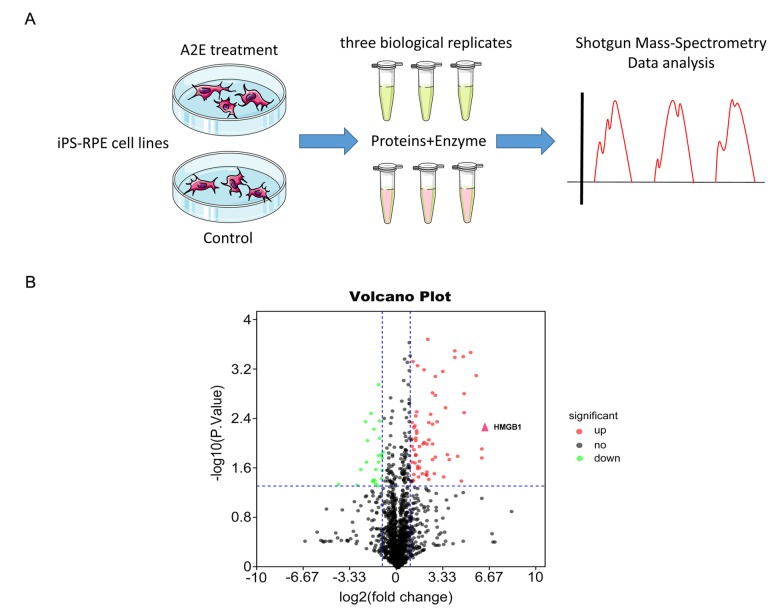
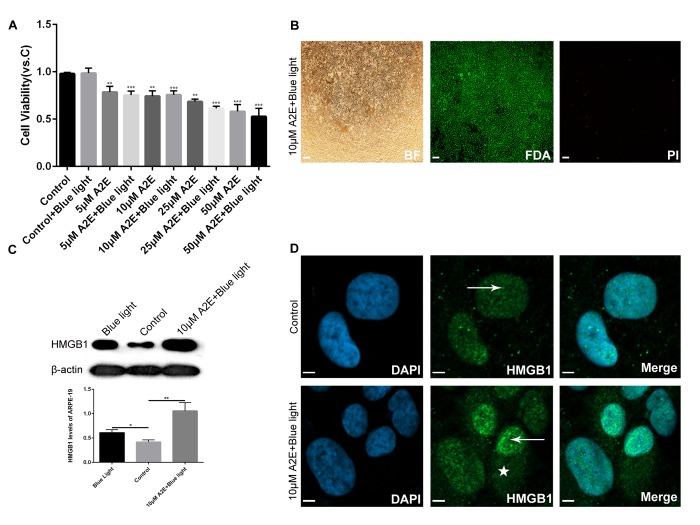
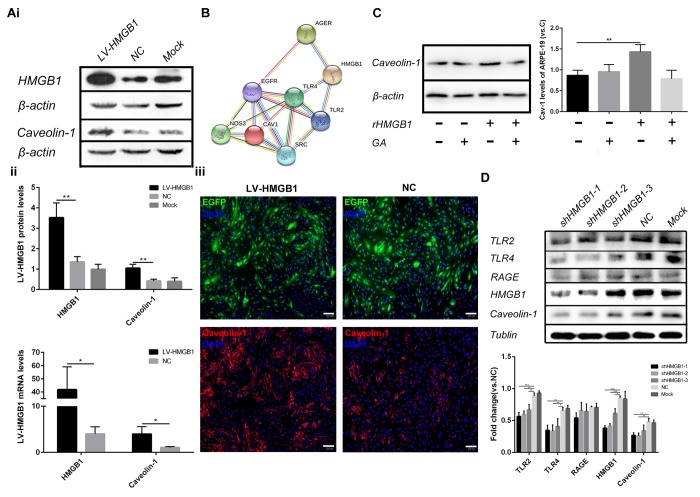
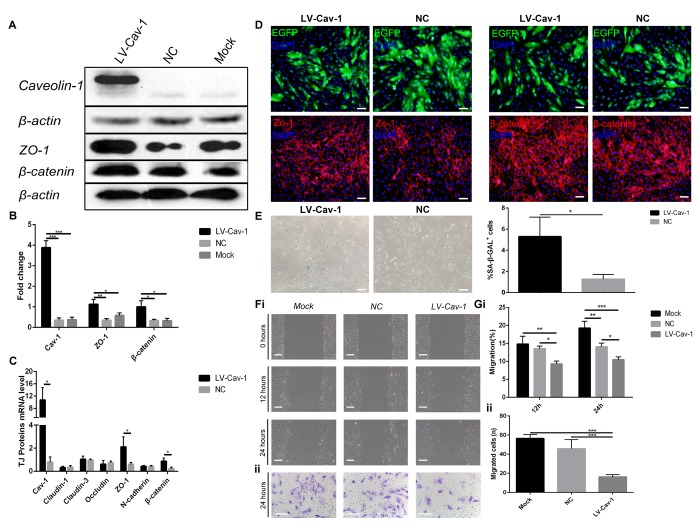
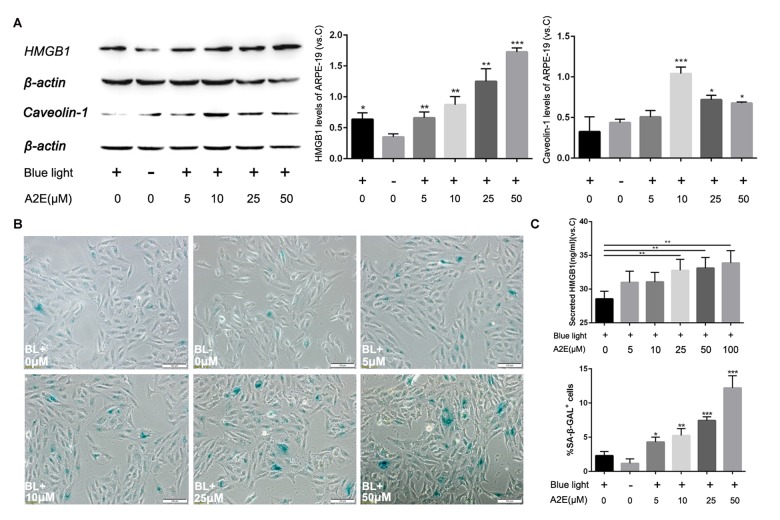
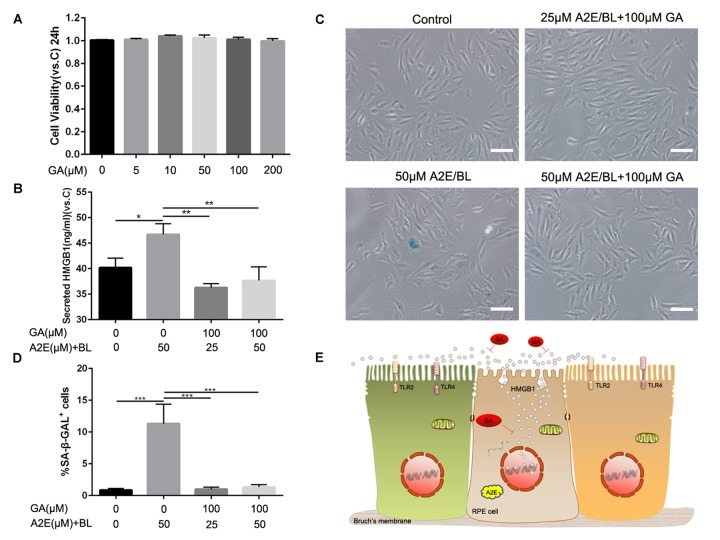
Accumulation of lipofuscin in the retinal pigment epithelium (RPE) is considered a major cause of RPE dysfunction and senescence in age-related macular degeneration (AMD), and N-retinylidene-N-retinylethanolamine (A2E) is the main fluorophore identified in lipofuscin from aged human eyes. Here, human-induced pluripotent stem cell (iPSC)-RPE was generated from healthy individuals to reveal proteomic changes associated with A2E-related RPE cell senescence. A novel RPE cell senescence-related protein, high-mobility group box 1 (HMGB1), was identified based on proteomic mass spectrometry measurements on iPSC-RPE with A2E treatment. Furthermore, HMGB1 upregulated Caveolin-1, which also was related RPE cell senescence. To investigate whether changes in HMGB1 and Caveolin-1 expression under A2E exposure contribute to RPE cell senescence, human ARPE-19 cells were stimulated with A2E; expression of HMGB1, Caveolin-1, tight junction proteins and senescent phenotypes were verified. HMGB1 inhibition alleviated A2E induced cell senescence. Migration of RPE cells was evaluated. Notably, A2E less than or equal to 10μM induced both HMGB1 and Caveolin-1 protein upregulation and HMGB1 translocation, while Caveolin-1 expression was downregulated when there was more than 10μM A2E. Our data indicate that A2E-induced upregulation of HMGB1、Caveolin-1 and HMGB1 release may relate to RPE cell senescence and play a role in the pathogenesis of AMD.

Keywords: A2E; AMD; Caveolin-1; HMGB1; RPE cell senescence.


Conflict of interest statement

CONFLICTS OF INTEREST: All the authors declare that they have no competing interests.

Figures

Figure 1
Figure 1
Proteomic mass spectrometry-based measurement of differential expression of HMGB1. (A) The flow chart of shotgun mass spectrometry. (B) Volcano plot illustrating significant differential abundant proteins based on quantitative analysis. The -log10 (P value) was plotted against log2(fold change A2E treatment/Control). Proteins were significantly upregulated (red dots) or downregulated (green dots) between the A2E treatment and control. The red arrowhead indicates HMGB1.
Figure 2
Figure 2
Experimental validation that blue light exposure of A2E-treated ARPE-19 cells induces HMGB1 upregulation and translocation. (A) An MTT assay was performed on RPE cells treated with different concentrations of A2E with or without blue light photosensitization. Data are presented as means ± SD; * indicates a p value < 0.05, ** indicates a p value < 0.01, *** indicates a p value < 0.001, compared to the control, n=3. (B) FDA/PI staining of RPE cells after in vitro culture for 48 h with 10 μM A2E + blue light (10 min). Most living RPE cells were stained green by fluorescein diacetate (FDA); a few dead cells were stained red bypropidium iodide (PI). (C) Western blot analyses showed that HMGB1 protein expression was higher in 10μM A2E + blue light-treated cells compared to the control and also higher in the blue light treatment, as quantified by densitometry; the results are expressed as a ratio with β-actin. Data are presented as means ± SD; * indicates a p value < 0.05, ** indicates a p value < 0.01, n=3. (D) HMGB1 localization in RPE cells was assessed by confocal microscopy after 10μM A2E + blue light treatment. HMGB1 moved from the nucleus (arrow) to the cytoplasm (star) after 10μM A2E + blue light treatment. Nuclei are labelled with DAPI (blue); HMGB1 is stained green.
Figure 3
Figure 3
HMGB1 upregulation and release increase the expression of Caveolin-1. (A) (i) Western blot analyses showed that overexpression of HMGB1 upregulated Caveolin-1; β-actin was used as the loading control; Western blot results were quantified by densitometry, and the results are expressed as a ratio with β-actin. (ii) qPCR analyses showed that overexpression of HMGB1 upregulated Caveolin-1. Data are presented as means ± SD; * indicates a p value < 0.05, ** indicates a p value < 0.01, n=3. (iii) Expression of EGFP and Caveolin-1 was assessed by immunofluorescence in HMGB1-overexpressing RPE cells and negative-control RPE cells. (B) Protein interaction between HMGB1 and Caveolin-1 was revealed by the STRING version 9.1 program. (C) Relative Caveolin-1expression in RPE cell incubated with normal medium, 1μg/ml rHMGB1, 100μM GA, or 1μg/ml rHMGB1+100μM GA, Data are presented as means ± SD; * indicates a p value < 0.05, ** indicates a p value < 0.01, n=3. (D) Western blot analyses showed that knock-down of HMGB1 downregulated Caveolin-1; Tublin was used as the loading control, western blot results were quantified by densitometry, and the results are expressed as a ratio with Tublin. Data are presented as means ± SD; * indicates a p value < 0.05, ** indicates a p value < 0.01, n=3.
Figure 4
Figure 4
Overexpression of Caveolin-1 induced ARPE-19 cell senescence and inhibited migration and invasion. (A) Western blot analyses showed that overexpression of Caveolin-1 upregulated Zo-1 and β-catenin; β-actin was used as the loading control. (B) Western blot results were quantified by densitometry, and the results are expressed as a ratio with β-actin. Data are presented as means ± SD; * indicates a p value < 0.05, ** indicates a p value < 0.01, *** indicates a p value < 0.001, n=3. (C) qPCR analyses showed that overexpression of Caveolin-1 upregulated Zo-1 and β-catenin. Data are presented as means ± SD; * indicates a p value < 0.05, n=3. (D) Expression of EGFP, Zo-1 and β-catenin was assessed by immunofluorescence in Caveolin-1-overexpressing RPE cells and negative-control RPE cells. (E) Representative microscopic images of β-galactosidase staining in RPE cells showed overexpression of Caveolin-1 in RPE cells compared with that in negative-control RPE cells. Quantification of percentage of cells with positive SA-β-gal staining.Data are presented as means ± SD; * indicates a p value < 0.05, ** indicates a p value < 0.01, n=3. (F) (i) Wound-healing assays in Caveolin-1-overexpressing RPE cells. (ii). Transwell invasion assays in Caveolin-1-overexpressing RPE cells. (G) (i) The rate of cell migration in different groups was measured at different time points. Note that cell migration was decreased in Caveolin-1-overexpressing RPE cells. (ii) The mean number of invaded cells was assessed in 5 fields. Note that cell invasion was decreased in Caveolin-1-overexpressing RPE cells. Data are presented as means ± SD; * indicates a p value < 0.05, ** indicates a p value < 0.01, *** indicates a p value < 0.001, n=3.
Figure 5
Figure 5
Blue light exposure of A2E-treated ARPE-19 cells increased HMGB1 and Caveolin-1 expression. (A) Western blot assay for HMGB1 and Caveolin-1 in RPE cells treated with a concentration gradient of A2E with or without blue light, quantified by densitometry, and the results are expressed as a ratio with β-actin. Data are presented as means ± SD; * indicates a p value < 0.05, ** indicates a p value < 0.01, n=3. (B) Representative microscopic images of β-galactosidase staining in RPE cells with various concentrations of A2E. Quantification of percentage of cells with positive SA-β-gal staining.Data are presented as means ± SD; * indicates a p value < 0.05, ** indicates a p value < 0.01, n=3. (C) The release of HMGB1 induced by A2E treatment were detected by ELISA assays.
Figure 6
Figure 6
Glycyrrhizic acid alleviated A2E induced cell senescence. (A) An MTT assay was performed on RPE cells treated with different concentrations of GA. Data are presented as means ± SD; * indicates a p value < 0.05, ** indicates a p value < 0.01, n=3. (B)The release of HMGB1 induced by different concentrations of A2E+BL with or without 100μM GA were detected by ELISA assays. Data are presented as means ± SD; * indicates a p value < 0.05, ** indicates a p value < 0.01, n=3. (C) Representative microscopic images of β-galactosidase staining in RPE cells induced by different concentrations of A2E+BL with or without 100μM GA. (D) Quantification of percentage of cells with positive SA-β-gal staining. Data are presented as means ± SD; * indicates a p value < 0.05, ** indicates a p value < 0.01, n=3. (E) Proposed schematic model for strategies for HMGB1 inhibition in response to A2E treatment.

Similar articles

Cited by

References

    1. Evans JB, Syed BA. New hope for dry AMD? Nat Rev Drug Discov. 2013; 12:501–02. 10.1038/nrd4038 - DOI - PubMed
    1. Ferris FL 3rd, Wilkinson CP, Bird A, Chakravarthy U, Chew E, Csaky K, Sadda SR, and Beckman Initiative for Macular Research Classification Committee. Clinical classification of age-related macular degeneration. Ophthalmology. 2013; 120:844–51. 10.1016/j.ophtha.2012.10.036 - DOI - PMC - PubMed
    1. Jager RD, Mieler WF, Miller JW. Age-related macular degeneration. N Engl J Med. 2008; 358:2606–17. 10.1056/NEJMra0801537 - DOI - PubMed
    1. Bowes Rickman C, Farsiu S, Toth CA, Klingeborn M. Dry age-related macular degeneration: mechanisms, therapeutic targets, and imaging. Invest Ophthalmol Vis Sci. 2013; 54:ORSF68-80. 10.1167/iovs.13-12757 - DOI - PMC - PubMed
    1. Hanus J, Anderson C, Wang S. RPE necroptosis in response to oxidative stress and in AMD. Ageing Res Rev. 2015; 24:286–98. 10.1016/j.arr.2015.09.002 - DOI - PMC - PubMed

Publication types