Intra-Abdominal Fat Adipocyte Hypertrophy through a Progressive Alteration of Lipolysis and Lipogenesis in Metabolic Syndrome Rats
- PMID: 31284400
- PMCID: PMC6683042
- DOI: 10.3390/nu11071529
Intra-Abdominal Fat Adipocyte Hypertrophy through a Progressive Alteration of Lipolysis and Lipogenesis in Metabolic Syndrome Rats
Abstract
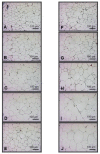
This study evaluates the progressive participation of enzymes involved in lipolysis and lipogenesis, leading to adipocyte hypertrophy in a metabolic syndrome (MS) rat model caused by chronic consumption of 30% sucrose in drinking water. A total of 70 male Wistar rats were divided into two groups: C and MS. Each of these groups were then subdivided into five groups which were sacrificed as paired groups every month from the beginning of the treatment until 5 months. The intra-abdominal fat was dissected, and the adipocytes were extracted. Lipoprotein lipase (LPL), hormone-sensitive lipase (HSL), protein kinases A (PKA), and perilipin A expressions were determined. The LPL and HSL activities were evaluated by spectrophotometry. Histological staining was performed in adipose tissue. Significant increases were observed in blood pressure, HOMA-IR, leptin, triglycerides, insulin, intra-abdominal fat, and number of fat cells per field (p = 0.001) and in advanced glycosylation products, adipocyte area, LPL, HSL activities and/or expression (p ≤ 0.01) in the MS groups progressively from the third month onward. Lipogenesis and lipolysis were increased by LPL activity and HSL activity and/or expression. This was associated with hyperinsulinemia and release of non-esterified fatty acids causing a positive feedback loop that contributes to the development of adipocyte hypertrophy.
Keywords: adipocyte; hormone-sensitive lipase; hypertrophy; lipoprotein lipase; metabolic syndrome; perilipin A.
Conflict of interest statement
The authors declare no conflict of interest.
Figures


References
-
- Lorenzo C., Williams K., Hunt K.J., Haffner S.M. The National Cholesterol Education Program Adult Treatment Panel III, International Diabetes Federation, and World Health Organization definitions of the metabolic. syndrome as predictors of incident cardiovascular disease and diabetes. Diabetes Care. 2007;30:8–13. doi: 10.2337/dc06-1414. - DOI - PubMed
MeSH terms
Substances
LinkOut - more resources
Full Text Sources
Medical

