Comparative Study
. 2019 Jul 5;11(7):614.
doi: 10.3390/v11070614.

Starvation-Induced Differential Virotherapy Using an Oncolytic Measles Vaccine Virus

Affiliations
Comparative Study

Starvation-Induced Differential Virotherapy Using an Oncolytic Measles Vaccine Virus

Gabriel Scheubeck et al. Viruses. .

Abstract

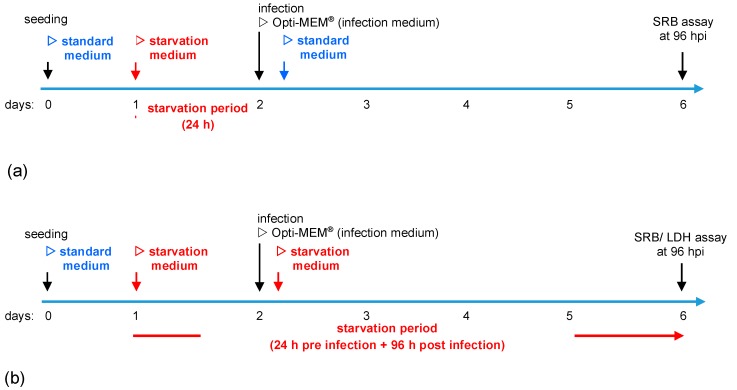
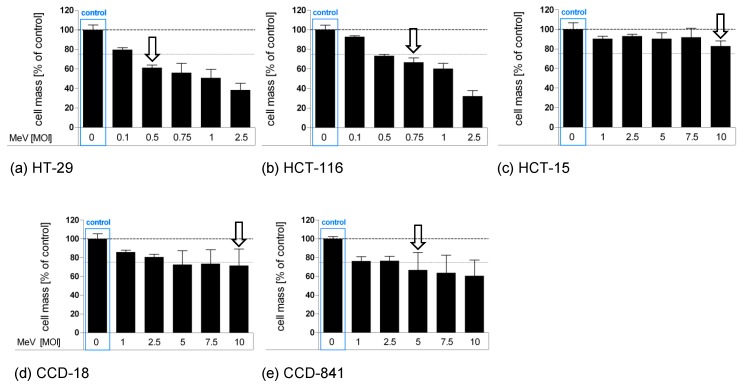
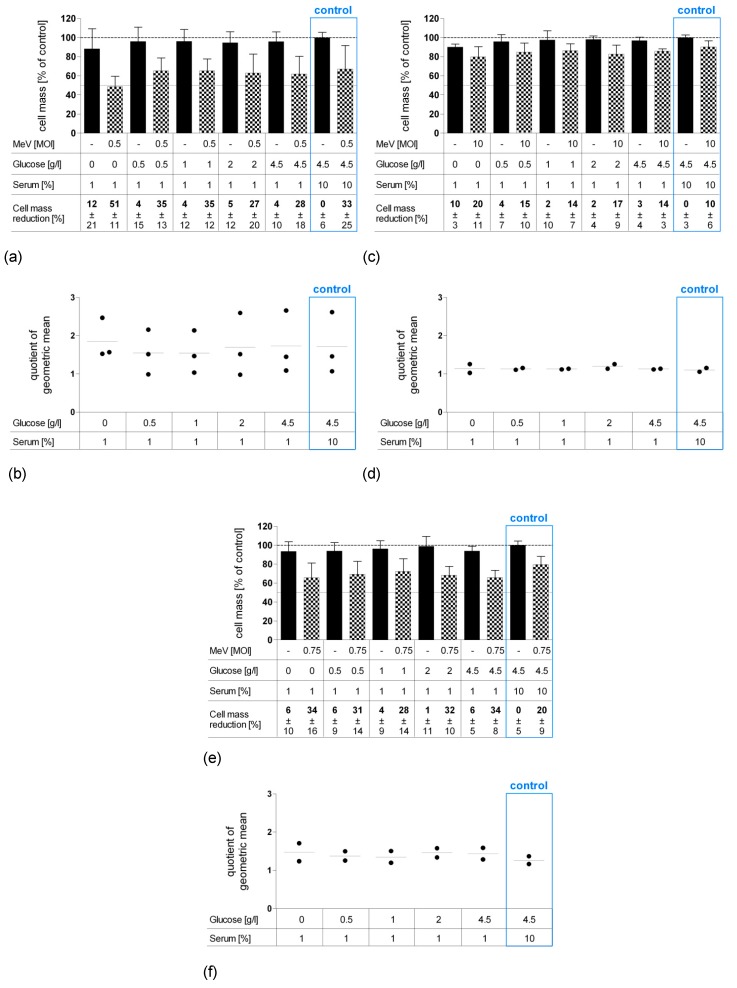
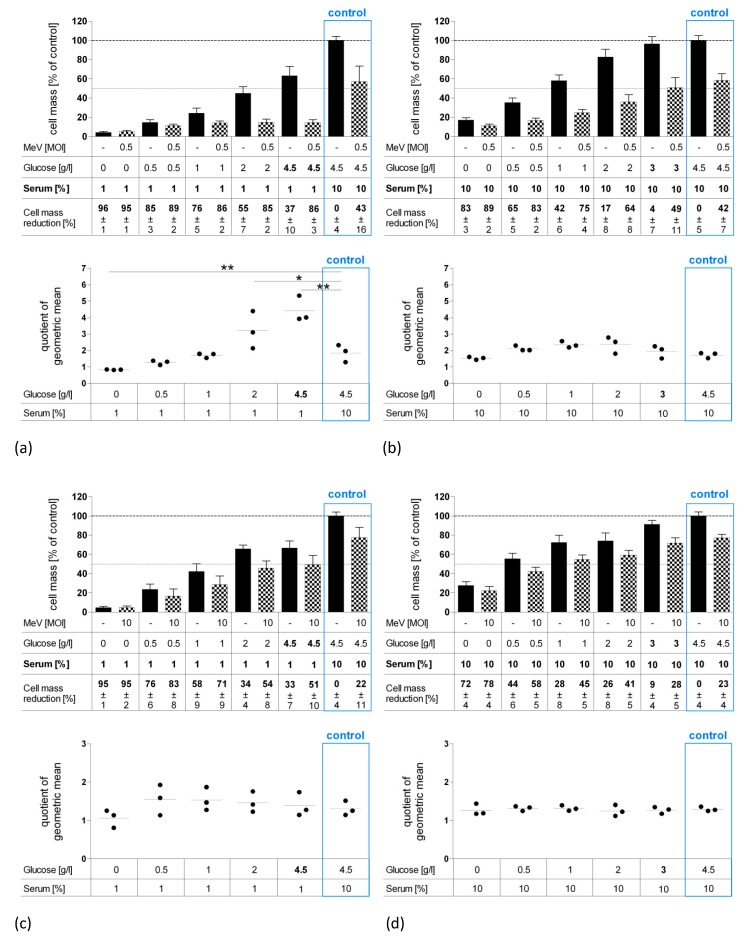
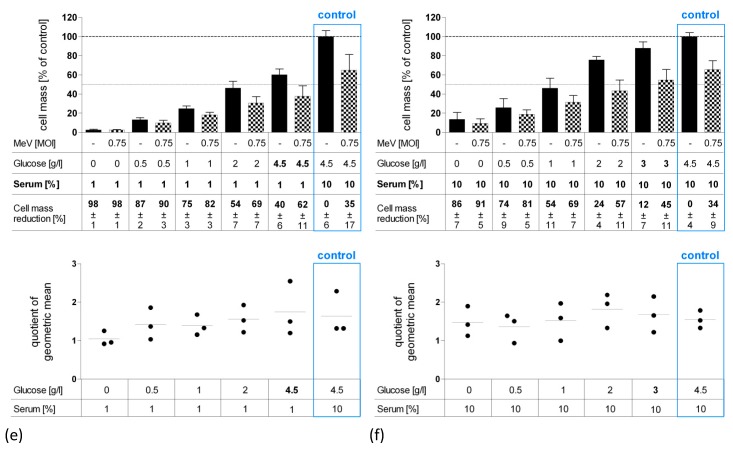
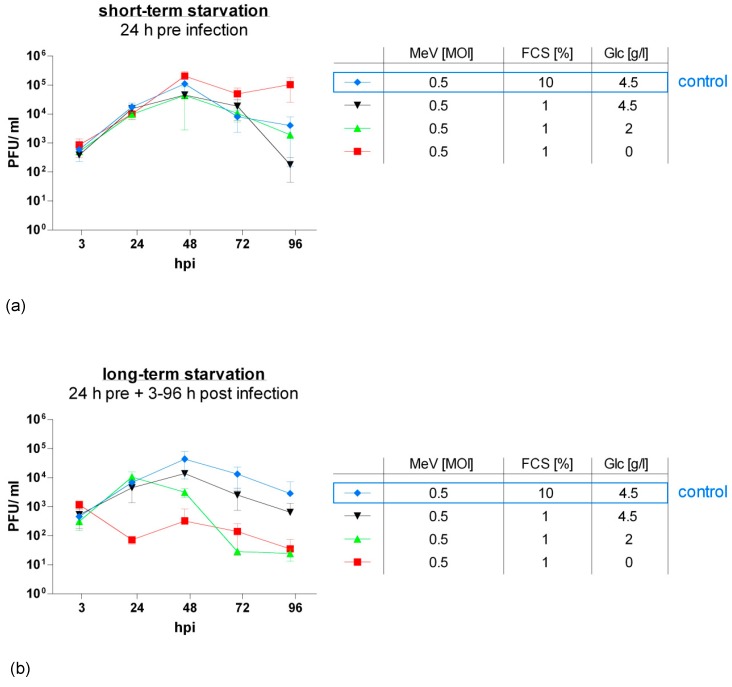
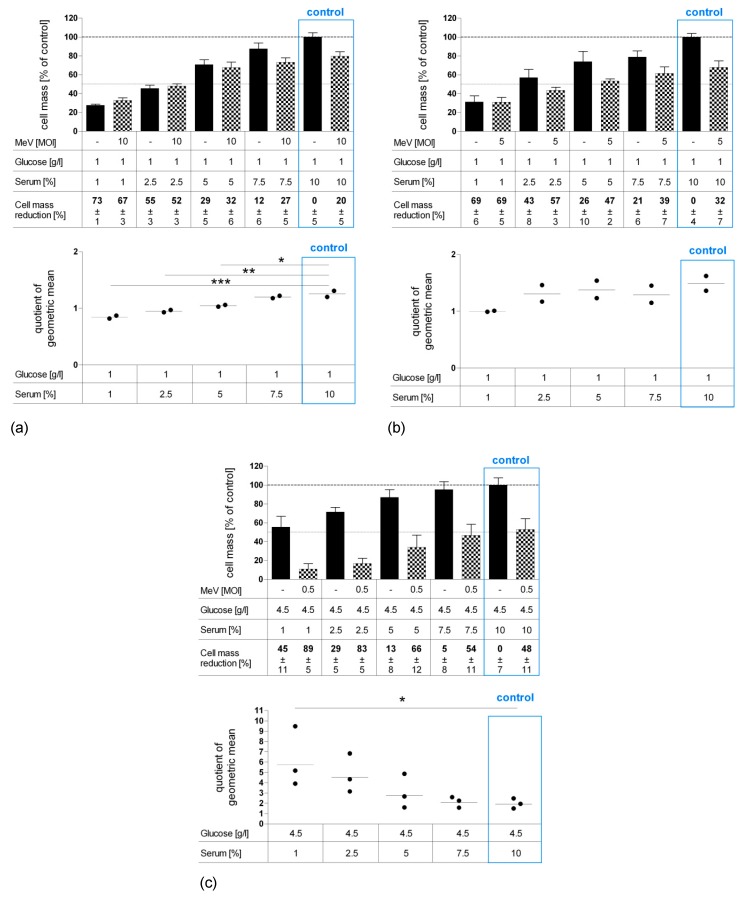
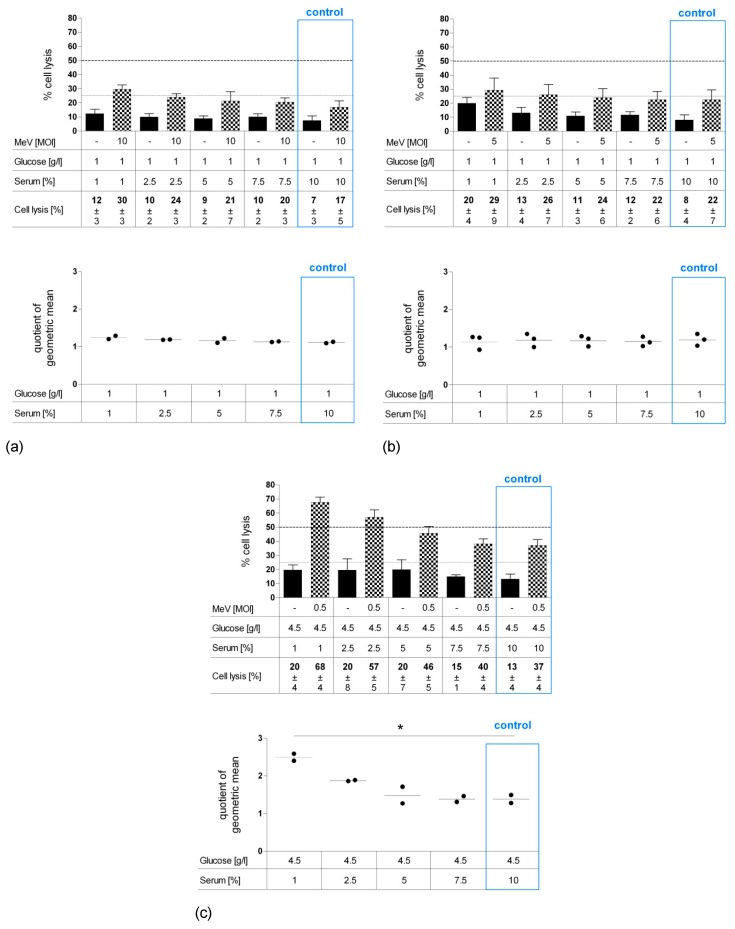
Starvation sensitizes tumor cells to chemotherapy while protecting normal cells at the same time, a phenomenon defined as differential stress resistance. In this study, we analyzed if starvation would also increase the oncolytic potential of an oncolytic measles vaccine virus (MeV-GFP) while protecting normal cells against off-target lysis. Human colorectal carcinoma (CRC) cell lines as well as human normal colon cell lines were subjected to various starvation regimes and infected with MeV-GFP. The applied fasting regimes were either short-term (24 h pre-infection) or long-term (24 h pre- plus 96 h post-infection). Cell-killing features of (i) virotherapy, (ii) starvation, as well as (iii) the combination of both were analyzed by cell viability assays and virus growth curves. Remarkably, while long-term low-serum, standard glucose starvation potentiated the efficacy of MeV-mediated cell killing in CRC cells, it was found to be decreased in normal colon cells. Interestingly, viral replication of MeV-GFP in CRC cells was decreased in long-term-starved cells and increased after short-term low-glucose, low-serum starvation. In conclusion, starvation-based virotherapy has the potential to differentially enhance MeV-mediated oncolysis in the context of CRC cancer patients while protecting normal colon cells from unwanted off-target effects.

Keywords: fasting; measles vaccine virus; oncolysis; starvation; virotherapy.


Conflict of interest statement

The authors declare no conflict of interest.

Figures

Figure 1
Figure 1
Illustration of starvation conditions. (a) Short-term starvation: Cells were seeded in standard medium. On day 1, medium was changed to starvation medium (i.e., starvation medium with variations in contents of glucose and fetal calf serum (FCS)). On day 2, infection with MeV was performed in infection medium (Opti-MEM®). At 3 h post-infection (hpi), infection medium was replaced with standard medium. At 96 hpi, the remaining tumor cell masses were determined by the sulforhodamine B (SRB) assay. (b) Long-term starvation: Cells were seeded in standard medium on day 0. Medium was changed to starvation medium on day 1. The 3 hpi, infection medium was replaced with the respective starvation medium. At 96 hpi, the remaining tumor cell masses were determined by SRB or lactate dehydrogenase (LDH) assay.
Figure 2
Figure 2
Susceptibilities of human colon carcinoma and normal human colon cells to MeV-mediated oncolysis. Human colon carcinoma cell lines HT-29 (a), HCT-116 (b), and HCT-15 (c) and normal colon cell lines CCD-18 Co (d) and CCD-841 CoN (e) were cultured in standard medium and infected 48 h after seeding in Opti-MEM® (infection medium) with ascending multiplicities of infection (MOIs as indicated above) of MeV, or remained uninfected (control). At 96 h post-infection (hpi), the remaining tumor cell masses were determined by SRB viability assay. White arrows indicate selected MOIs which were used in further experiments to investigate a combined starvation plus virus-induced tumor cell toxicity. Means and standard error of the means (SEM) of two independent experiments are shown.
Figure 3
Figure 3
Effect of short-term pre-infection starvation (24 h) on MeV-mediated oncolysis in HT-29 (a,b), HCT-15 (c,d) and HCT-116 (e,f) cells. Short-term starvation and MeV infection of neoplastic HT-29, HCT-15, and HCT-116 cells (human colon carcinoma) were performed according to Figure 1a. At 96 hpi, the remaining tumor cell masses were determined by SRB assay. (a,c,e) Black bars represent MOCK-infected tumor cells (addition of Opti-MEM only, no infectious virus particles); checkered bars display tumor cells infected with MeV. Means and SEM of three or two independent experiments are shown; control: tumor cell cultures and infections performed under standard medium conditions (no starvation). (b,d,f) The impact of starvation on the virus-mediated oncolysis efficacy was evaluated by comparing the ratios of uninfected (MOCK) and virus-infected groups (VIRUS) between starving and standard medium conditions (control). Statistical analysis was performed using the Dunnett’s multiple comparison test. Each dot represents one run of the experiment; horizontal lines represent means of quotient of geometric mean (QoGM).
Figure 4
Figure 4
Effect of long-term starvation (120 h) on MeV-mediated oncolysis in HT-29 (a,b), HCT-15 (c,d) and HCT-116 (e,f) cells. Long-term starvation of HT-29, HCT-15 and HCT-116 cells was performed according to Figure 1b. On day 1, medium was changed to low-glucose, low-serum medium (a,c,e) or low-glucose, standard serum medium (b,d,f). At 96 hpi, remaining tumor cell masses were determined by SRB assay. Differences were considered significant when P-values were <0.05 (*) or <0.01 (**). Differences in glucose and serum concentrations are pointed out in bold face.
Figure 4
Figure 4
Effect of long-term starvation (120 h) on MeV-mediated oncolysis in HT-29 (a,b), HCT-15 (c,d) and HCT-116 (e,f) cells. Long-term starvation of HT-29, HCT-15 and HCT-116 cells was performed according to Figure 1b. On day 1, medium was changed to low-glucose, low-serum medium (a,c,e) or low-glucose, standard serum medium (b,d,f). At 96 hpi, remaining tumor cell masses were determined by SRB assay. Differences were considered significant when P-values were <0.05 (*) or <0.01 (**). Differences in glucose and serum concentrations are pointed out in bold face.
Figure 5
Figure 5
Viral replication under short-term (a) or long-term low-serum (b) starvation in HT-29 cells. After seeding on day 0, HT-29 cells underwent starvation either for 24 h pre-infection ((a): short-term starvation; Figure 1a) or for both 24 h pre- and 3–96 h post-infection ((b): long-term starvation; Figure 1b). Infection with MeV (MOI 0.5) was performed on day 2. Supernatants and tumor cell lysates were harvested at 3, 24, 48, 72, and 96 hpi. Titrations were performed on Vero cells and calculated as total amount of plaque-forming units (PFU)/mL (comprising PFU in supernatants plus cell lysates); control: tumor cell cultures and infections performed under standard medium conditions (no starvation). Means and SD of three independent experiments are shown.
Figure 6
Figure 6
Effect of long-term standard glucose, low-serum starvation on MeV-mediated oncolysis in normal human colon fibroblast cell line CCD-18 Co (a) and epithelial cell line CCD-841 CoN (b) compared to neoplastic cell line HT-29 (c) as determined by SRB assay. Long-term starvation and MeV infection of HT-29, CCD-18, and CCD-841 cells were performed according to Figure 1b. Starvation medium contained standard glucose, but low serum. Note, standard medium in normal colon cells contained only 1 g Glc/L, whereas standard medium in neoplastic cell lines contained 4.5 g Glc/L. For non-malignant cell lines, much higher MOIs were used (MOI 10 and 5) compared to the malignant cell line (MOI 0.5). At 96 hpi, the remaining tumor cell masses were determined by SRB assay. Differences were considered significant when P-values were <0.05 (*), <0.01 (**), and <0.0001 (***).
Figure 7
Figure 7
Effect of long-term standard glucose, low-serum starvation on MeV-mediated oncolysis in normal human colon fibroblast cell line CCD-18 Co (a) and epithelial cell line CCD-841 CoN (b) compared to HT-29 cells (c) determined by LDH assay. Cell culture, starvation and infection were carried out as in Figure 6. At 96 hpi, an LDH assay was performed to determine cell lysis. Differences were considered significant when P-values were <0.05 (*).

References

    1. Lee C., Safdie F.M., Raffaghello L., Wei M., Madia F., Parrella E., Hwang D., Cohen P., Bianchi G., Longo V.D. Reduced levels of IGF-I mediate differential protection of normal and cancer cells in response to fasting and improve chemotherapeutic index. Cancer Res. 2010;70:1564–1572. doi: 10.1158/0008-5472.CAN-09-3228. - DOI - PMC - PubMed
    1. Hanahan D., Weinberg R.A. The hallmarks of cancer. Cell. 2000;100:57–70. doi: 10.1016/S0092-8674(00)81683-9. - DOI - PubMed
    1. Pollak M.N., Schernhammer E.S., Hankinson S.E. Insulin-like growth factors and neoplasia. Nat. Rev. Cancer. 2004;4:505–518. doi: 10.1038/nrc1387. - DOI - PubMed
    1. Lee C., Longo V.D. Fasting vs dietary restriction in cellular protection and cancer treatment: From model organisms to patients. Oncogene. 2011;30:3305–3316. doi: 10.1038/onc.2011.91. - DOI - PubMed
    1. Lee C., Raffaghello L., Brandhorst S., Safdie F.M., Bianchi G., Martin-Montalvo A., Pistoia V., Wei M., Hwang S., Merlino A., et al. Fasting Cycles Retard Growth of Tumors and Sensitize a Range of Cancer Cell Types to Chemotherapy. Sci. Transl. Med. 2012;4:124ra27. doi: 10.1126/scitranslmed.3003293. - DOI - PMC - PubMed

Publication types

LinkOut - more resources