

Privacy-Preserving Generative Deep Neural Networks Support Clinical Data Sharing
- PMID: 31284738
- PMCID: PMC7041894
- DOI: 10.1161/CIRCOUTCOMES.118.005122
Privacy-Preserving Generative Deep Neural Networks Support Clinical Data Sharing
Abstract
Background: Data sharing accelerates scientific progress but sharing individual-level data while preserving patient privacy presents a barrier.
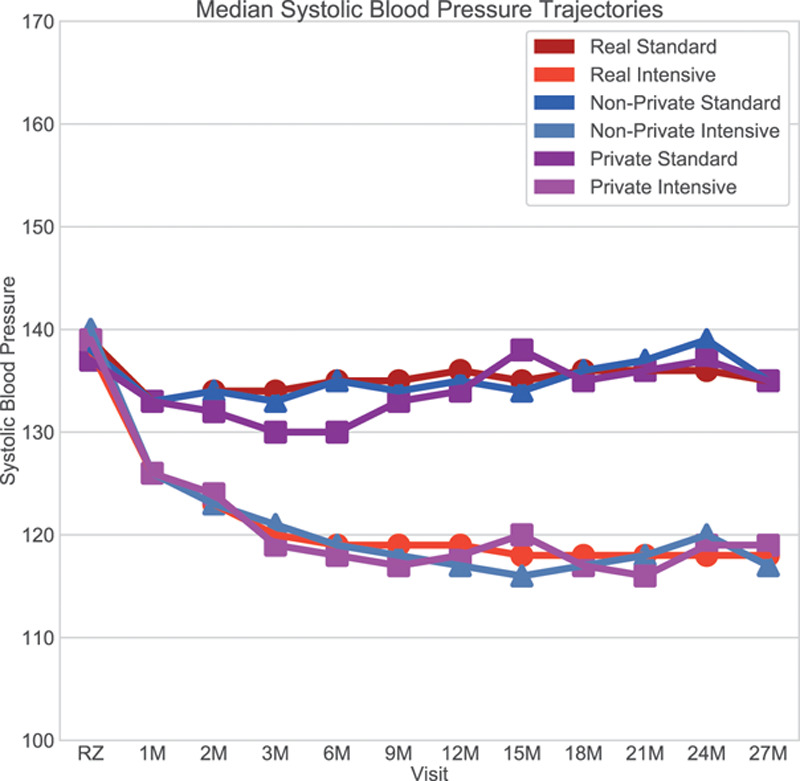
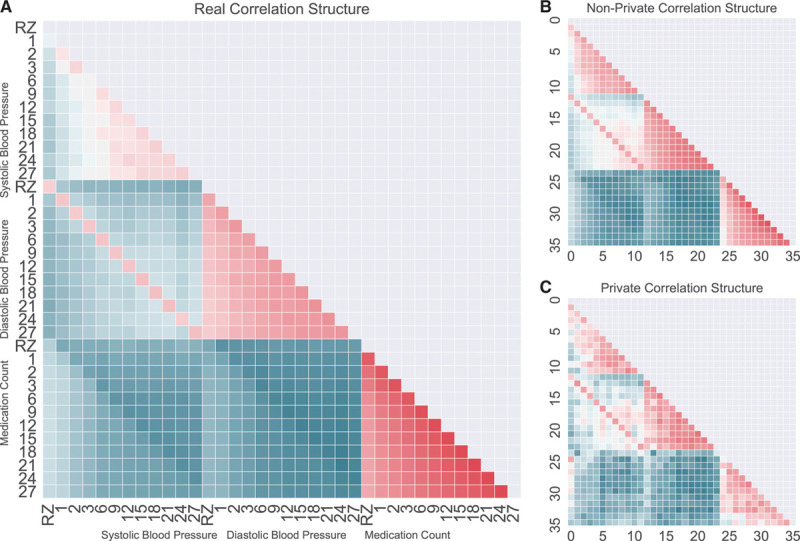
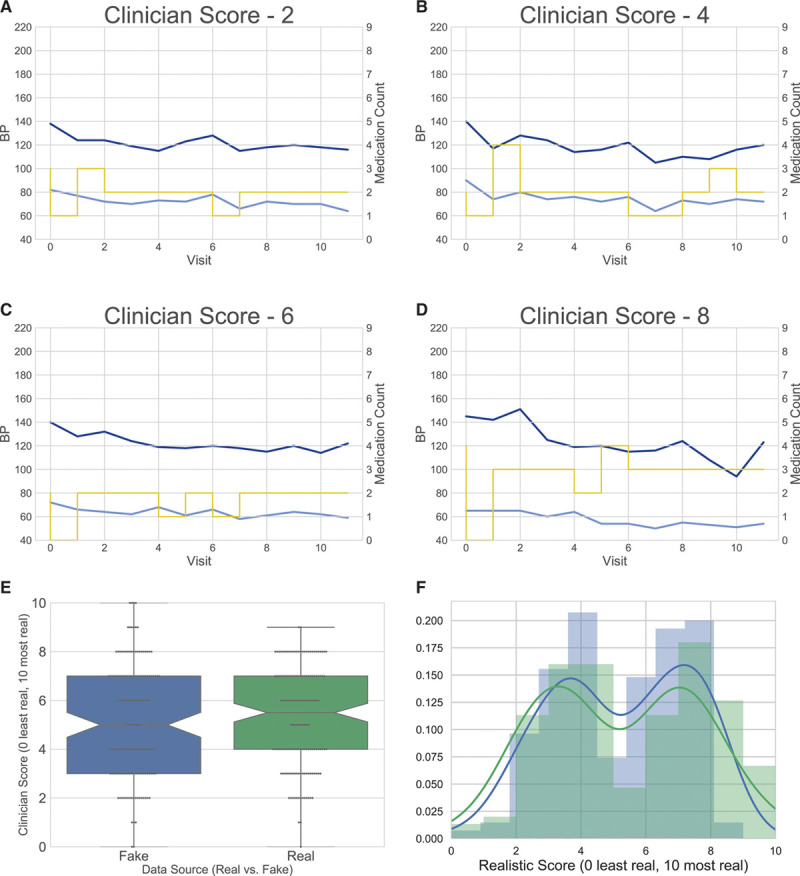
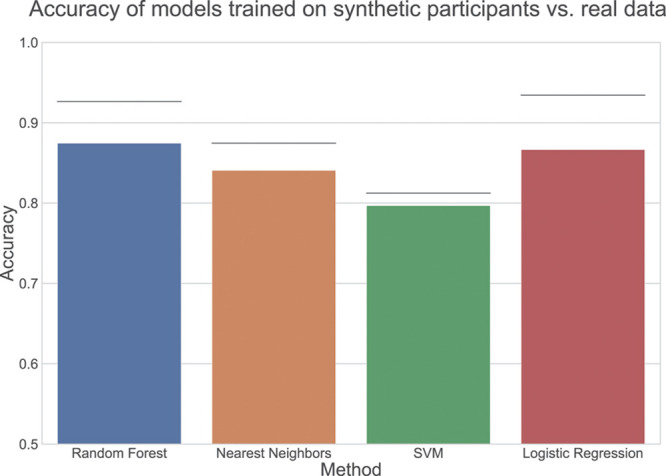
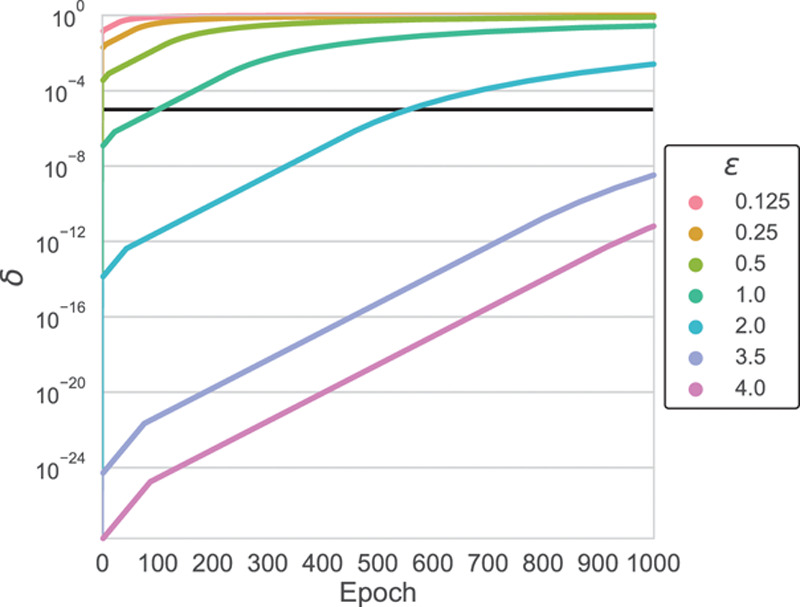
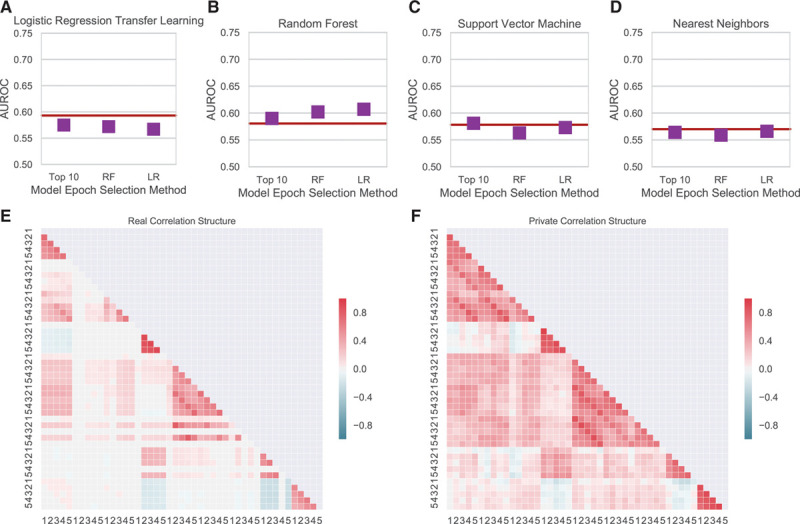
Methods and results: Using pairs of deep neural networks, we generated simulated, synthetic participants that closely resemble participants of the SPRINT trial (Systolic Blood Pressure Trial). We showed that such paired networks can be trained with differential privacy, a formal privacy framework that limits the likelihood that queries of the synthetic participants' data could identify a real a participant in the trial. Machine learning predictors built on the synthetic population generalize to the original data set. This finding suggests that the synthetic data can be shared with others, enabling them to perform hypothesis-generating analyses as though they had the original trial data.
Conclusions: Deep neural networks that generate synthetic participants facilitate secondary analyses and reproducible investigation of clinical data sets by enhancing data sharing while preserving participant privacy.
Keywords: blood pressure; deep learning; machine learning; privacy; propensity score.
Figures
References
-
- Wang R, Lagakos SW, Ware JH, Hunter DJ, Drazen JM. Statistics in medicine–reporting of subgroup analyses in clinical trials. N Engl J Med. 2007;357:2189–2194. doi: 10.1056/NEJMsr077003. - PubMed
-
- Home The SPRINT Data Analysis Challenge. The SPRINT Data Analysis Challenge n.d. https://challenge.nejm.org/pages/home. Accessed December 1, 2018.
-
- Wright JT, Jr, Williamson JD, Whelton PK, Snyder JK, Sink KM, Rocco MV, Reboussin DM, Rahman M, Oparil S, Lewis CE, Kimmel PL, Johnson KC, Goff DC, Jr, Fine LJ, Cutler JA, Cushman WC, Cheung AK, Ambrosius WT SPRINT Research Group. A randomized trial of intensive versus standard blood-pressure control. N Engl J Med. 2015;373:2103–2116. doi: 10.1056/NEJMoa1511939. - PMC - PubMed
-
- Basu S, Sussman JB, Rigdon J, Steimle L, Denton B, Hayward R. Development and Validation of a Clinical Decision Score to Maximize Benefit and Minimize Harm from Intensive Blood Pressure Treatment 2017. https://challenge.nejm.org/posts/5815. Accessed April 19, 2019.
-
- Dagan N, Tsadok MA, Hoshen M, Arkiv A, Karpati T, Gofer I, Leibowitz M, Gilutz H, Podjarny E, Bachmat E, Balicer R. To Treat Intensively or Not – Individualized Decision Making Support Tool 2017. https://challenge.nejm.org/posts/5826. Accessed April 19, 2019.
Publication types
MeSH terms
Substances
Associated data
Grants and funding
LinkOut - more resources
Full Text Sources
Other Literature Sources
