. 2019 Aug 2;125(4):431-448.
doi: 10.1161/CIRCRESAHA.119.314817. Epub 2019 Jul 9.

Monitoring Cell-Type-Specific Gene Expression Using Ribosome Profiling In Vivo During Cardiac Hemodynamic Stress

Affiliations

Monitoring Cell-Type-Specific Gene Expression Using Ribosome Profiling In Vivo During Cardiac Hemodynamic Stress

Shirin Doroudgar et al. Circ Res. .

Abstract

Rationale: Gene expression profiles have been mainly determined by analysis of transcript abundance. However, these analyses cannot capture posttranscriptional gene expression control at the level of translation, which is a key step in the regulation of gene expression, as evidenced by the fact that transcript levels often poorly correlate with protein levels. Furthermore, genome-wide transcript profiling of distinct cell types is challenging due to the fact that lysates from tissues always represent a mixture of cells.

Objectives: This study aimed to develop a new experimental method that overcomes both limitations and to apply this method to perform a genome-wide analysis of gene expression on the translational level in response to pressure overload.

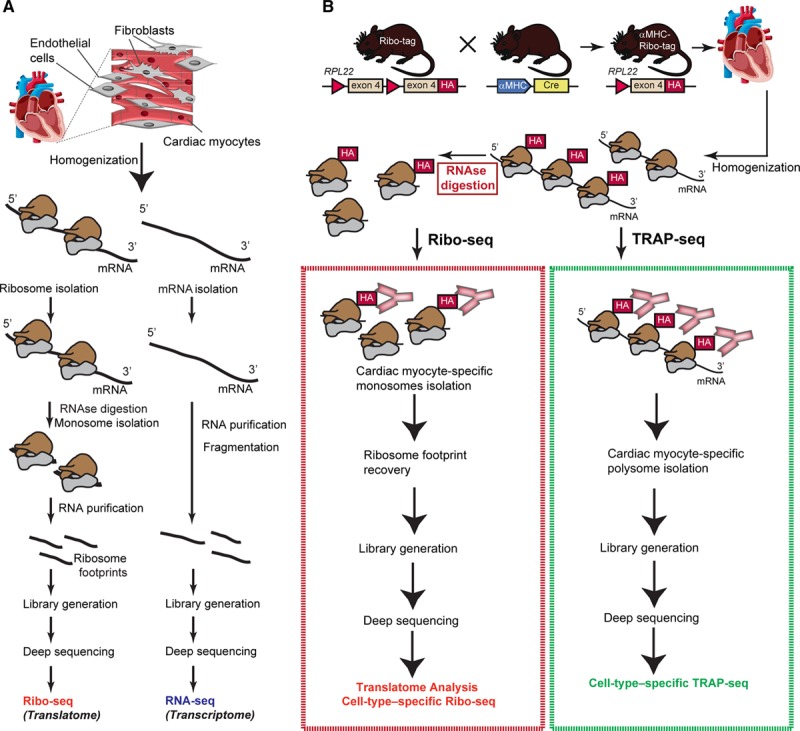
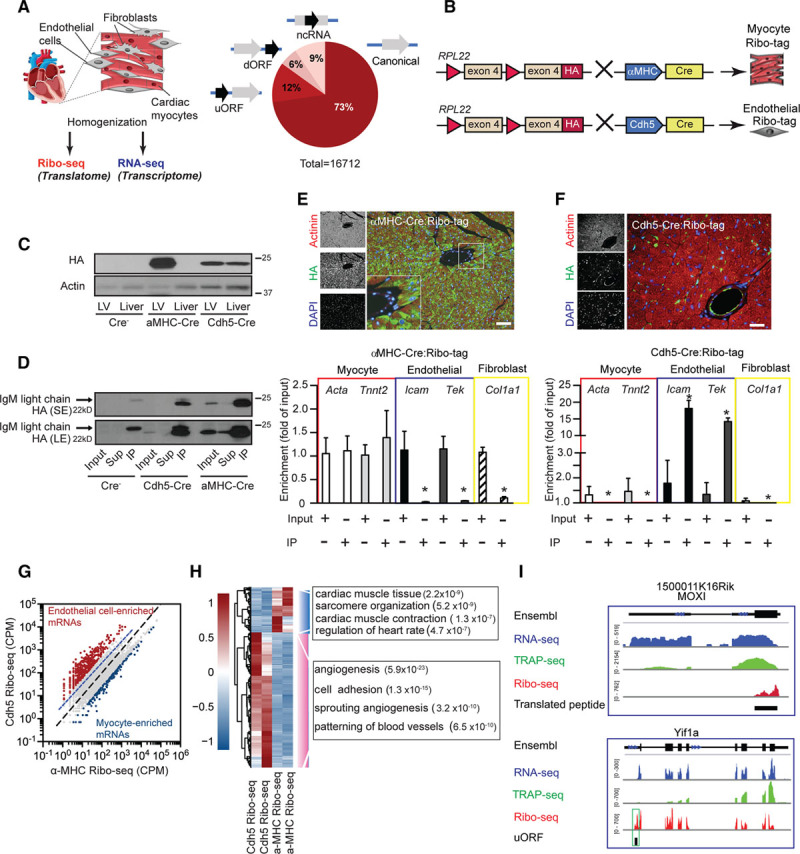
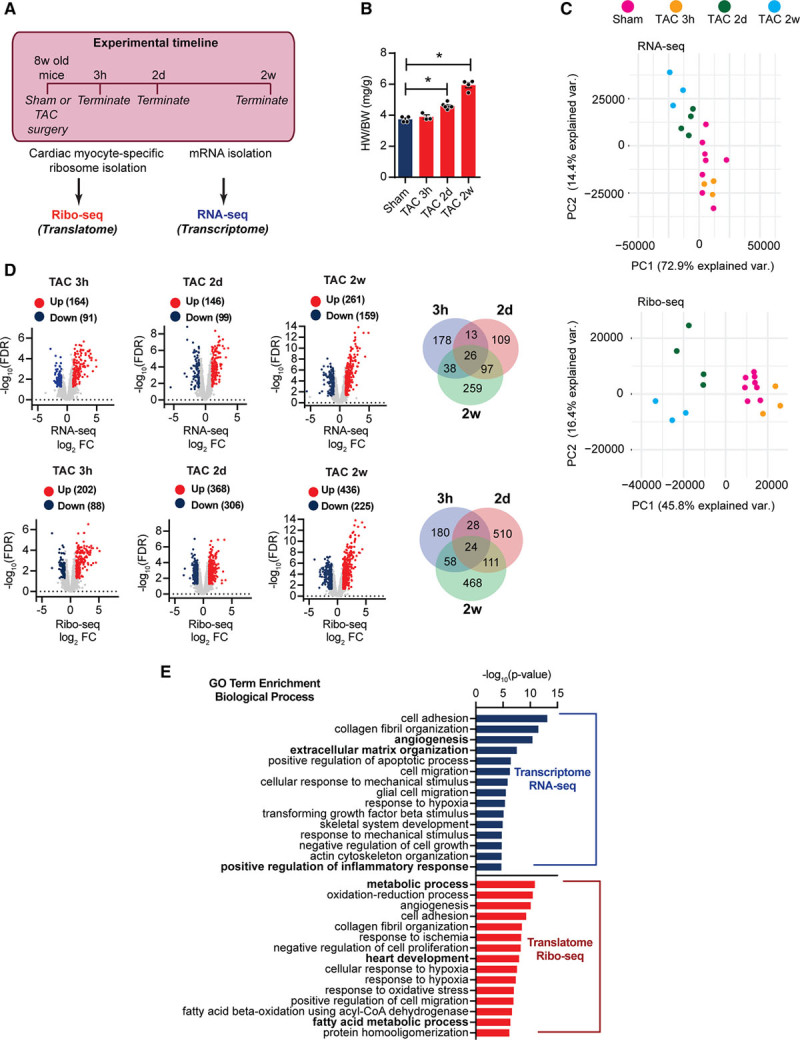
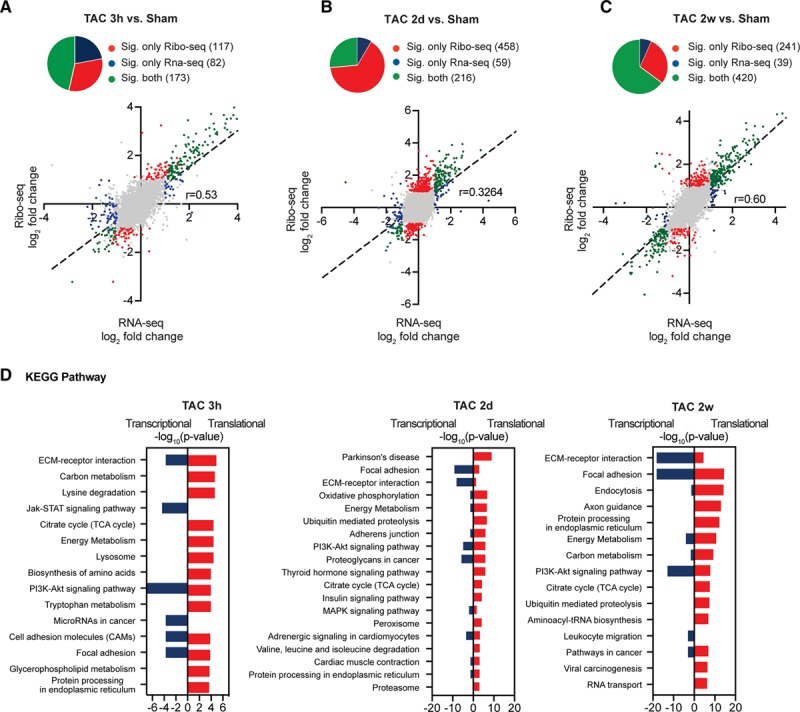
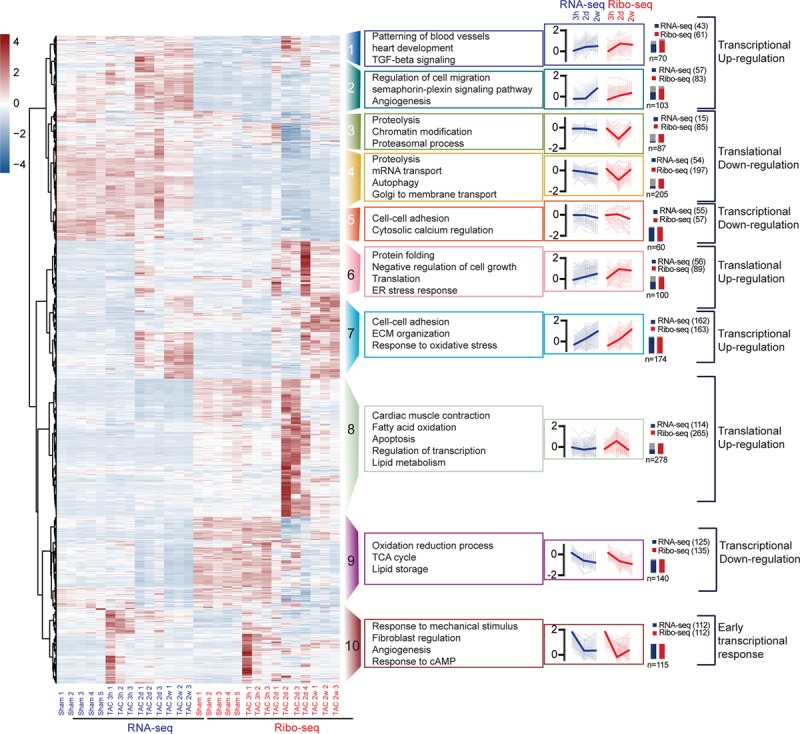
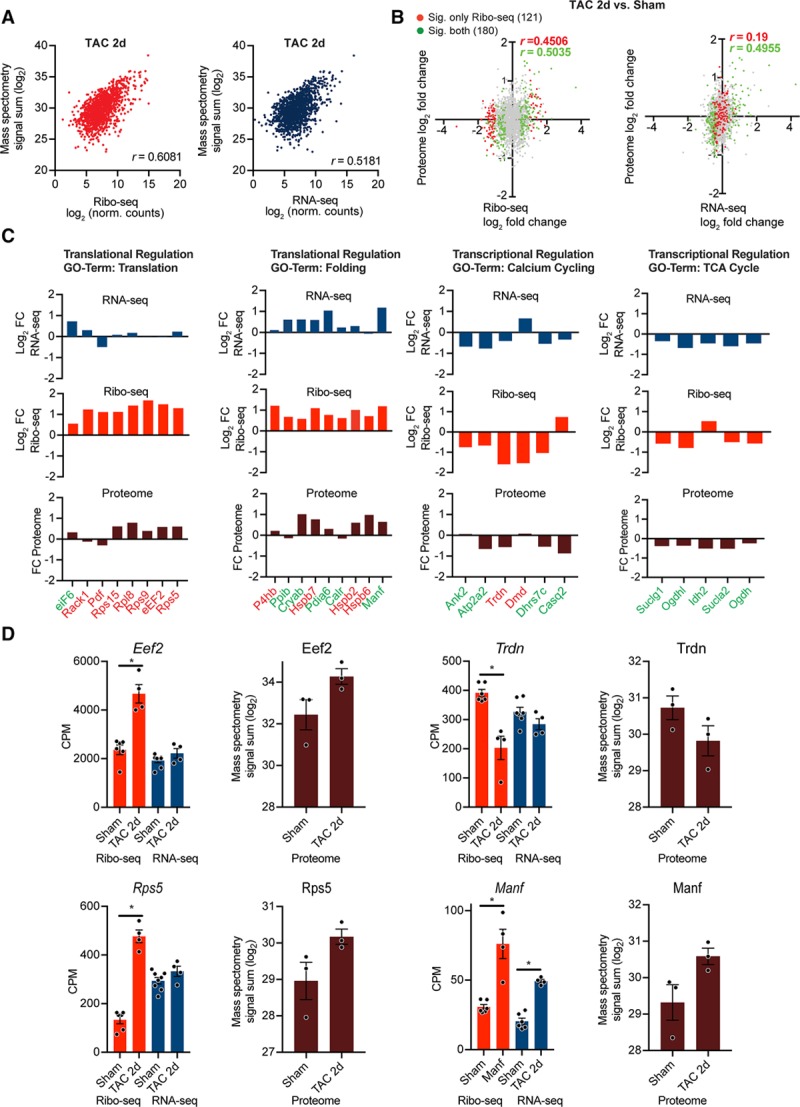
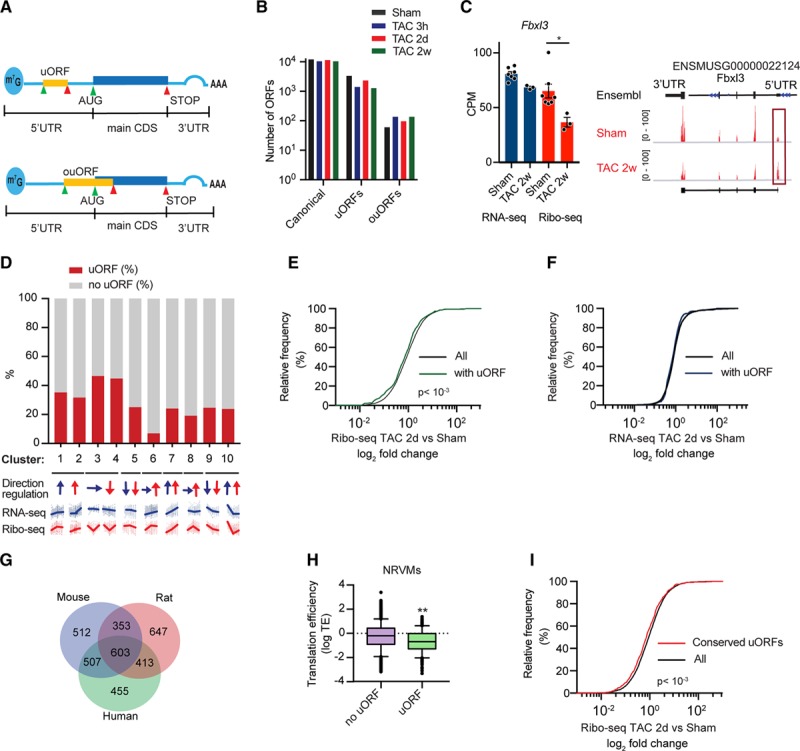
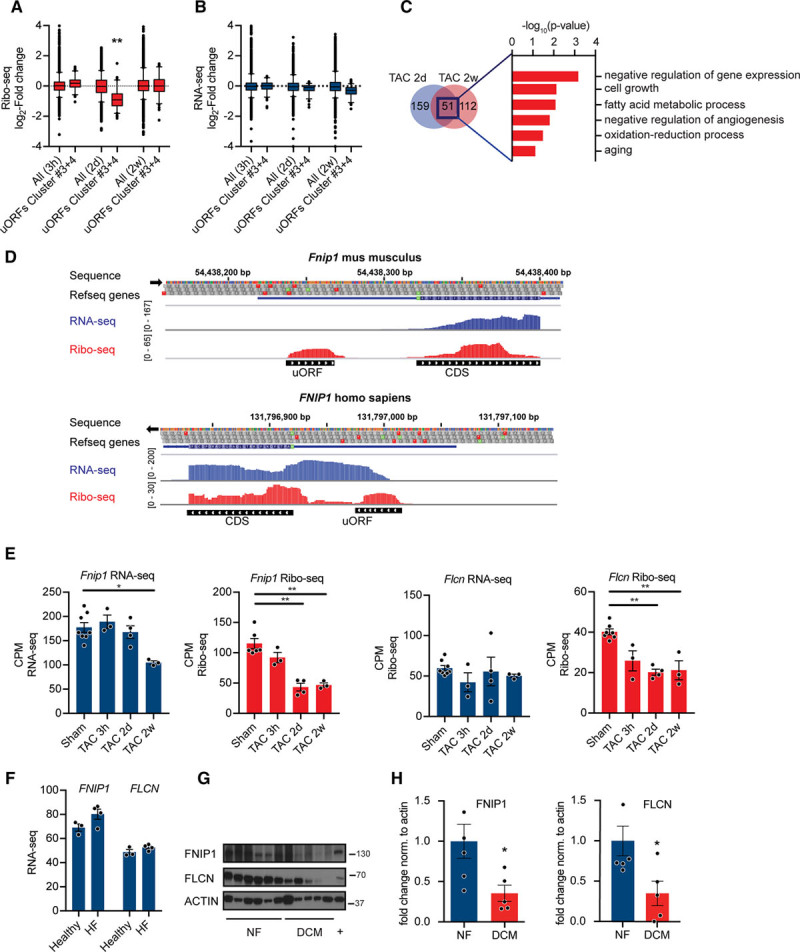
Methods and results: By combining ribosome profiling (Ribo-seq) with a ribosome-tagging approach (Ribo-tag), it was possible to determine the translated transcriptome in specific cell types from the heart. After pressure overload, we monitored the cardiac myocyte translatome by purifying tagged cardiac myocyte ribosomes from cardiac lysates and subjecting the ribosome-protected mRNA fragments to deep sequencing. We identified subsets of mRNAs that are regulated at the translational level and found that translational control determines early changes in gene expression in response to cardiac stress in cardiac myocytes. Translationally controlled transcripts are associated with specific biological processes related to translation, protein quality control, and metabolism. Mechanistically, Ribo-seq allowed for the identification of upstream open reading frames in transcripts, which we predict to be important regulators of translation.

Conclusions: This method has the potential to (1) provide a new tool for studying cell-specific gene expression at the level of translation in tissues, (2) reveal new therapeutic targets to prevent cellular remodeling, and (3) trigger follow-up studies that address both, the molecular mechanisms involved in the posttranscriptional control of gene expression in cardiac cells, and the protective functions of proteins expressed in response to cellular stress.

Keywords: gene expression; hypertrophy, left ventricular; metabolism; protein biosynthesis; protein folding; proteostasis; ribosomes.


Figures

Figure 1.
Figure 1.
Ribosome profiling in the mouse heart. A, Overview of Ribo-seq and RNA-seq. In Ribo-seq, a small fragment inside the ribosome is protected against RNAse digestion and used for deep-sequencing. B, Overview of the Ribo-tag mouse and schematic drawing of Ribo-seq strategy for cell-type–specific ribosome profiling. A cell-specific promotor (αMHC [alpha-myosin heavy chain] for cardiac myocytes) drives the expression of Cre which induces cell-type–specific HA-tagged RPL22. HA (hemagglutinin)-tagged ribosomes from left ventricle lysates are isolated by affinity purification, subjected to ribosome footprint isolation (Ribo-seq) or polysome profiling (translating ribosome affinity purification [TRAP]-seq) for subsequent deep sequencing and read mapping.
Figure 2.
Figure 2.
Cell-type–specific ribosome profiling in the mouse heart. A, Overview of Ribo-seq and RNA-seq approach combined with Ribo-tag. Predicted actively translated open reading frames (ORFs) from Ribo-seq data of mouse ventricular tissue and predicted active translation of using the Rp-bp approach. B, Schematic drawing of Ribo-seq strategy for cell-type–specific ribosome profiling. C, Immunoblotting of αMHC-Cre:Ribo-tag and Cdh5-CreERT2:Ribo-tag left ventricle and liver lysates. D, Immunoblot of αMHC-Cre:Ribo-tag and Cdh5-CreERT2:Ribo-tag left ventricle lysates after anti-HA (hemagglutinin) immunoprecipitation. E (upper), Immunofluorescence microscopy of heart sections from αMHC-Cre:Ribo-tag hearts. HA antibody (green), actinin (red), and nuclei (blue). Scale bar =100 μm. E (lower), Enrichment of transcripts after anti-HA immunoprecipitation from αMHC-Cre:Ribo-tag lysates. N=3; *P<0.01. F (upper), Immunofluorescence microscopy of heart sections from Cdh5-CreERT2:Ribo-tag hearts. Scale bar =100 μm. F (lower), Enrichment of transcripts after anti-HA immunoprecipitation from Cdh5-CreERT2:Ribo-tag left ventricle lysates. n=3; *P<0.01. Two-tailed Student unpaired t test for E and F. G, Comparison of αMHC-Cre and Cdh5-Cre Ribo-seq libraries. Endothelial-enriched transcripts (red dots) and myocyte-enriched transcripts (blue dots; log2-fold change >2). N=2 individual libraries for each condition. H, Clustering analysis of endothelial and myocyte-enriched transcripts. Hierarchical clustering analysis was performed with the R package ‘pheatmap’ using ‘ward.D2’ and ‘euclidean’ distance algorithm. Scale: scaled gene expression. Enrichment of significant gene ontology terms in the group of regulated genes (Fisher exact test, −log10 P value). I, Ribo-seq (red), RNA-seq (blue), and TRAP (translating ribosome affinity purification)-seq (green) coverage plots for the M. musculus genome loci containing MOXI (ncRNA with a translating ORF) and Yif1a (reads mapped to the 5′ UTR). dORF indicates downstream open reading frame; LE, long exposure; MOXI, micropeptide regulator of β-oxidation; ncRNA, noncoding RNA; SE, short exposure; uORF, upstream open reading frame; and UTR, untranslated regions.
Figure 3.
Figure 3.
Cardiac myocyte-specific Ribo-seq identifies myocyte translational regulation during cardiac stress by pressure overload. A, Experimental strategy for identification of the translatome and transcriptome during cardiac growth. B, Heart-weight-to-body-weight ratio (HW/BW) 3h, 2d, and 2w after transverse aortic constriction (TAC) surgery. N≥3 for each time point; *P<0.01. One-way ANOVA. C, Principal component analysis of RNA-seq and Ribo-seq libraries after TAC surgery. N≥3 for each time point. D, Translational or transcriptional control in response to TAC surgery. Transcripts were considered significant when false discovery rate <0.05 and Ribo-seq log2-fold change of count per million >1 (upregulated) or <−1 (down-regulated). Venn diagram shows relative relationship between TAC 3h, TAC 2d, and TAC 2w regulation. N≥3 for each time point. E, Enrichment of gene ontology terms (biological process) in differentially expressed transcripts after TAC surgery. −log10 P values, Fisher exact test. FC indicates fold change.
Figure 4.
Figure 4.
Regulated transcript networks after acute and chronic cardiac stress. AC, Scatter plots of Ribo-seq vs RNA-seq in sham- and transverse aortic constriction (TAC)-operated mice. Transcripts were considered significant when false discovery rate <0.05. Gray dots indicate no significant change. Significant change at translational level is shown in red, at transcriptional level in blue, and regulation at both translational and transcriptional levels in green. N≥3 for each time point. D, Enrichment of Kyoto Encyclopedia of Genes and Genomes (KEGG) terms for differentially expressed genes. −log10 P values, Fisher exact test. ECM indicates extracellular matrix; FDR, false discovery rate; STAT, signal transducer and activator of transcription; and TCA, tricarboxylic acid cycle.
Figure 5.
Figure 5.
Regulated transcript networks after acute and chronic hemodynamic stress. Unbiased clustering analysis of Ribo-seq and RNA-seq of DEGs 3h, 2d, and 2w after transverse aortic constriction (TAC) surgery. Different colors indicate different clusters. Lines of each gene are transparent, and the lines of average values are in bold in each cluster. Numbers indicate significant genes by RNA-seq or Ribo-seq in the cluster and the total number of genes within the cluster (n). Scale: scaled gene expression. cAMP indicates cyclic adenosine monophosphate; ECM, extracellular matrix; ER, endoplasmic reticulum; TCA, tricarboxylic acid cycle; and TGF, transforming growth factor.
Figure 6.
Figure 6.
Mass spectrometry-based validation of translationally regulated transcripts. A, Gene-based scatterplot showing the correlation between Ribo-seq (red) or RNA-seq expression levels (blue) and protein abundance derived from isolated myocytes 2 days post surgery. Correlation coefficients are Pearson r values. B, Scatter plot of Ribo-seq or RNA-seq vs changes in protein abundances after transverse aortic constriction (TAC) surgery. Gray dots indicate no significant change, differentially expressed genes (DEGs) at translational level (Ribo-seq) are shown in red, DEGs at transcriptional level (RNA-seq) in green. Correlation coefficients are Pearson’s r values. C, Transcriptional and translational regulation of DEGs and changes in overall protein abundance of genes related to different biological processes from identified clusters in Figure 5. Translationally regulated transcripts (Ribo-seq, false discovery rate [FDR] <0.05) are highlighted in red, transcriptionally regulated transcripts (RNA-seq, FDR <0.05) in green. D, Examples for translational regulation (eEF2, Rps5, and Trdn) and transcriptional regulation (Manf). N=7 Sham, n=4 TAC. Mass spectrometry was performed on myocytes from n≥3 individual mice after TAC or Sham surgery. *FDR <0.05. CPM indicates counts per million.
Figure 7.
Figure 7.
Upstream open reading frame (ORF) expression after transverse aortic constriction (TAC) surgery. A, Scheme of RNA and regulatory elements. B, Number of different ORF types between the different conditions. N≥3 for each time point. C, Ribo-seq coverage plots for the M. musculus genome locus containing Fblx3. N≥3 for each time point; *false discovery rate <0.05. D, Percentage of transcripts with uORF in different clusters (Figure 5). Arrows indicate direction and transcriptional (blue) or translational regulation (red). E, Cumulative fraction of transcripts relative to their fold change of Ribo-seq. F, Cumulative fraction of transcripts relative to their fold change of RNA-seq. P<0.001, Mann-Whitney U test. G, Venn diagram showing conserved uORFs across 3 different species. H, Transcripts with uORFs show decreased translational efficiency in myocytes. N=2; P<0.001, Mann-Whitney U test. Whiskers represent 5% to 95% CI. I, Cumulative fraction of transcripts relative to their fold change of Ribo-seq for conserved uORFs in response to TAC. P<0.001, Mann-Whitney U test. AUG indicates start codon; CDS, coding sequence; CPM, counts per million; NRVMs, neonatal rat ventricular myocytes; ouORF, overlapping upstream ORF; STOP, stop codon; uORF, upstream ORF; and UTR, untranslated region.
Figure 8.
Figure 8.
Regulation of gene expression by upstream open reading frame (uORFs). A, Ribo-seq counts per million (CPM) for transcripts in cluster 4 at different time points after transverse aortic constriction (TAC) surgery. N≥3 for each time point; **P<0.01 Kruskal-Wallis test. Whiskers represent 5% to 95% CI. B, RNA-seq CPM for transcripts in cluster 4 at different time points after TAC surgery. N≥3 for each time point. C, Venn diagram showing overlap between significantly less translated transcripts containing a regulatory uORF at 2d and 2w after TAC. Enrichment of gene ontology terms (biological process) in differentially expressed transcripts after TAC surgery with uORFs. −log10 P values, Fisher exact test. D, Ribo-seq (red), RNA-seq (blue), and coverage plots for the H. sapiens and M. musculus genome loci containing FNIP1 (folliculin-interacting protein 1) with reads mapped to the 5′ UTR. E, Ribo-seq CPM and RNA-seq CPM for Fnip1 and Flcn (folliculin) at different time points after TAC surgery. *False discovery rate (FDR) <0.05, **FDR <0.01. F, RNA-seq counts for FNIP1 and FLCN in human heart samples. N=4. G, Immunoblots and (H) quantification for FNIP1 and FLCN in human heart samples confirming decreased expression in dilated cardiomyopathies (DCM). P<0.05; n≥5. Two-tailed Student unpaired t test. CDS indicates coding sequence.

References

    1. Mudd JO, Kass DA. Tackling heart failure in the twenty-first century. Nature. 2008;451:919–928. doi: 10.1038/nature06798. - PubMed
    1. Preissl S, Schwaderer M, Raulf A, Hesse M, Grüning BA, Köbele C, Backofen R, Fleischmann BK, Hein L, Gilsbach R. Deciphering the epigenetic code of cardiac myocyte transcription. Circ Res. 2015;117:413–423. doi: 10.1161/CIRCRESAHA.115.306337. - PubMed
    1. Lau E, Cao Q, Lam MPY, Wang J, Ng DCM, Bleakley BJ, Lee JM, Liem DA, Wang D, Hermjakob H, et al. Integrated omics dissection of proteome dynamics during cardiac remodeling. Nat Commun. 2018:9, 120. - PMC - PubMed
    1. Thum T, Condorelli G. Long noncoding RNAs and microRNAs in cardiovascular pathophysiology. Circ Res. 2015;116:751–762. doi: 10.1161/CIRCRESAHA.116.303549. - PubMed
    1. Pinto AR, Ilinykh A, Ivey MJ, Kuwabara JT, D’Antoni ML, Debuque R, Chandran A, Wang L, Arora K, Rosenthal NA, et al. Revisiting cardiac cellular composition. Circ Res. 2016;118:400–409. doi: 10.1161/CIRCRESAHA.115.307778. - PMC - PubMed

Publication types