. 2019 Aug 23;294(34):12581-12598.
doi: 10.1074/jbc.RA119.007601. Epub 2019 Jul 8.

In vivo stabilization of OPA1 in hepatocytes potentiates mitochondrial respiration and gluconeogenesis in a prohibitin-dependent way

Affiliations

In vivo stabilization of OPA1 in hepatocytes potentiates mitochondrial respiration and gluconeogenesis in a prohibitin-dependent way

Lingzi Li et al. J Biol Chem. .

Abstract

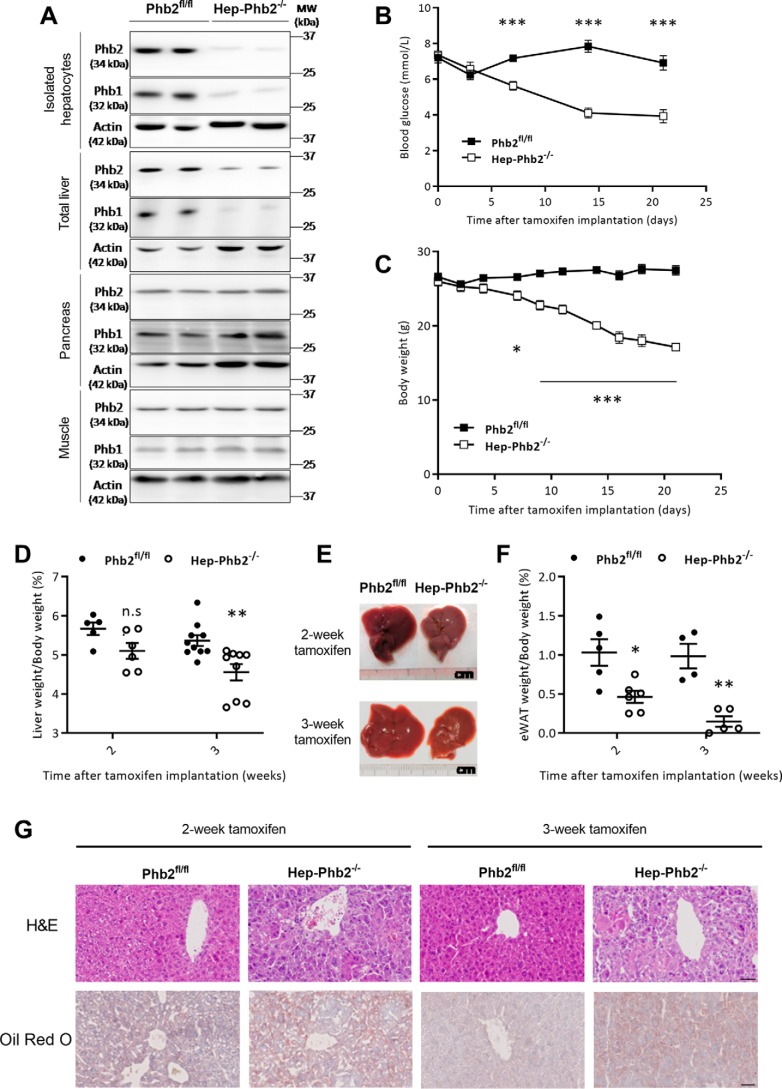
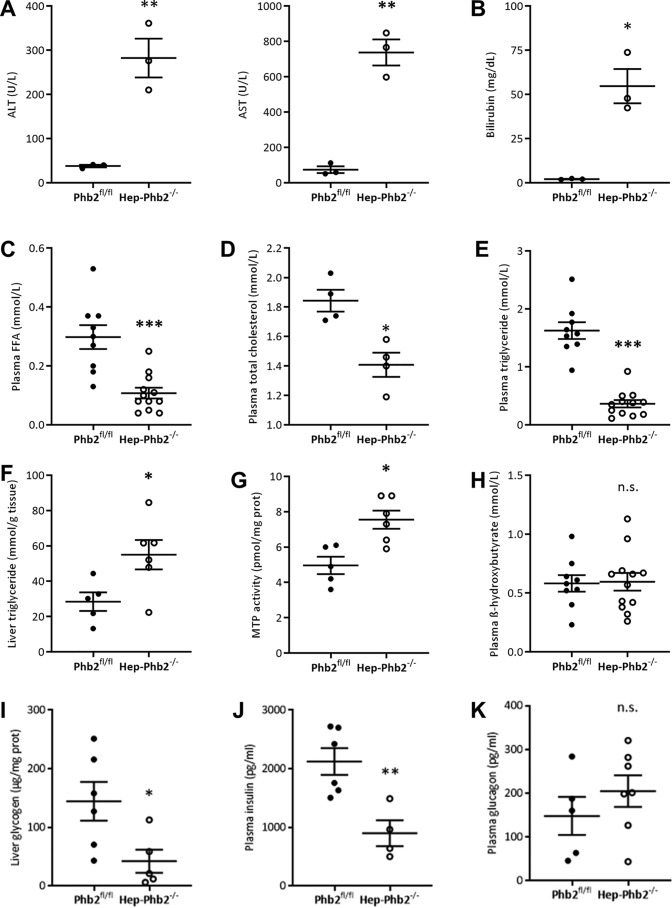
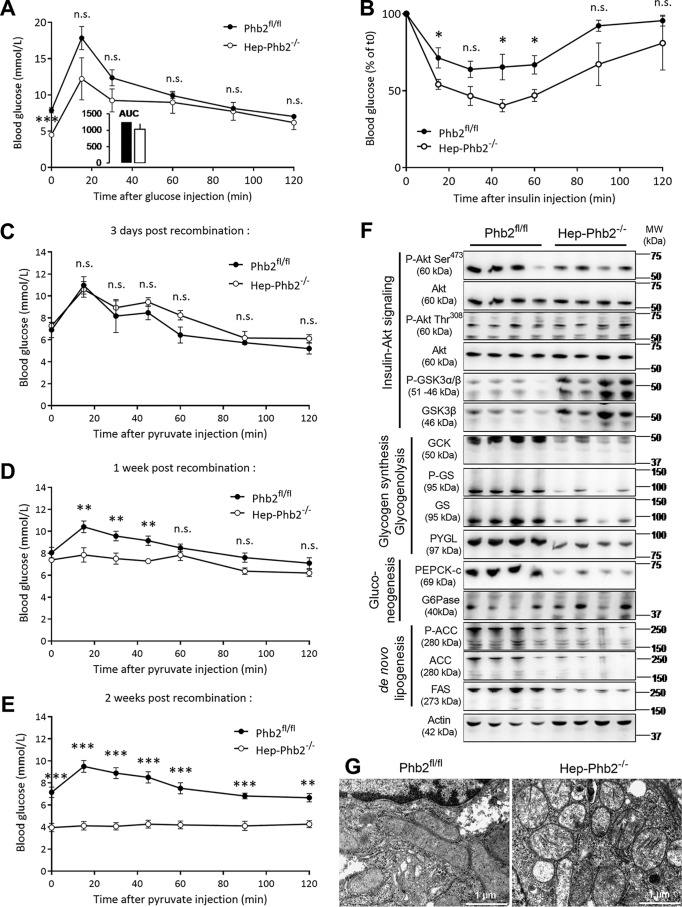
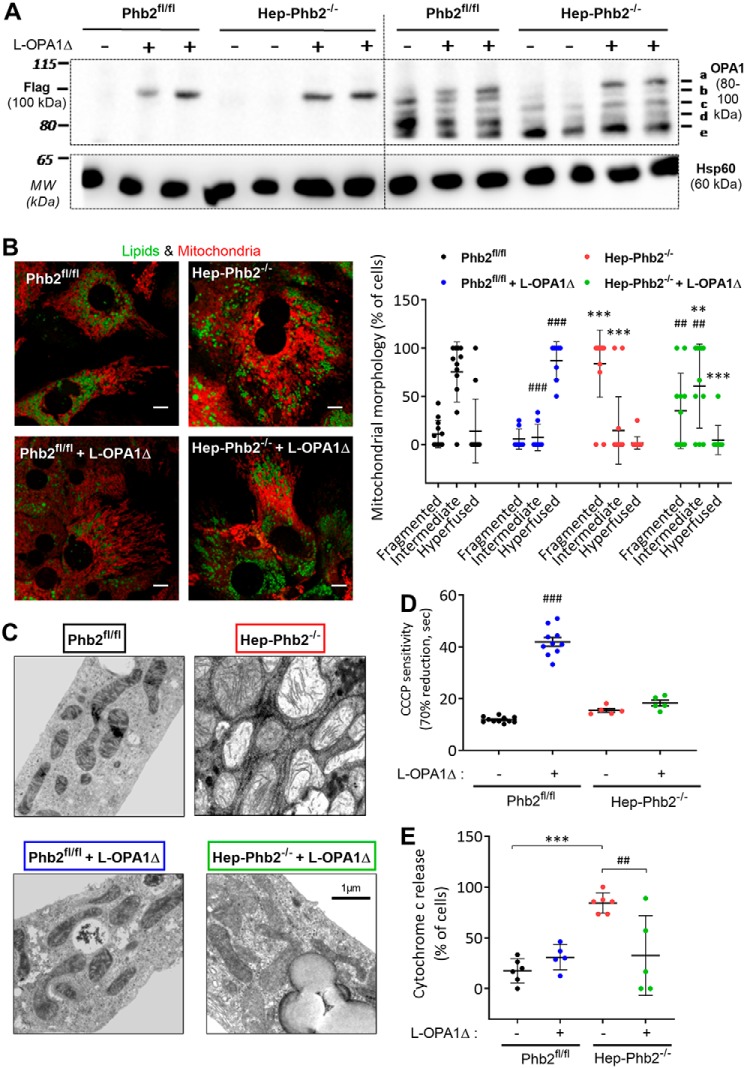
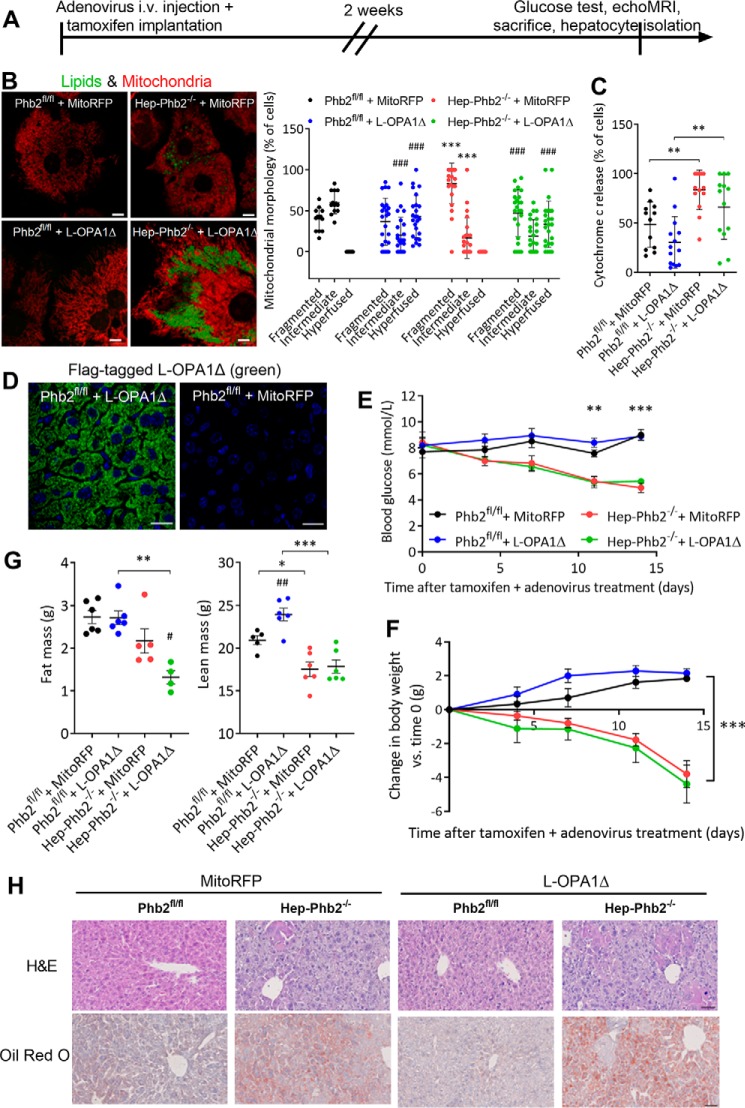
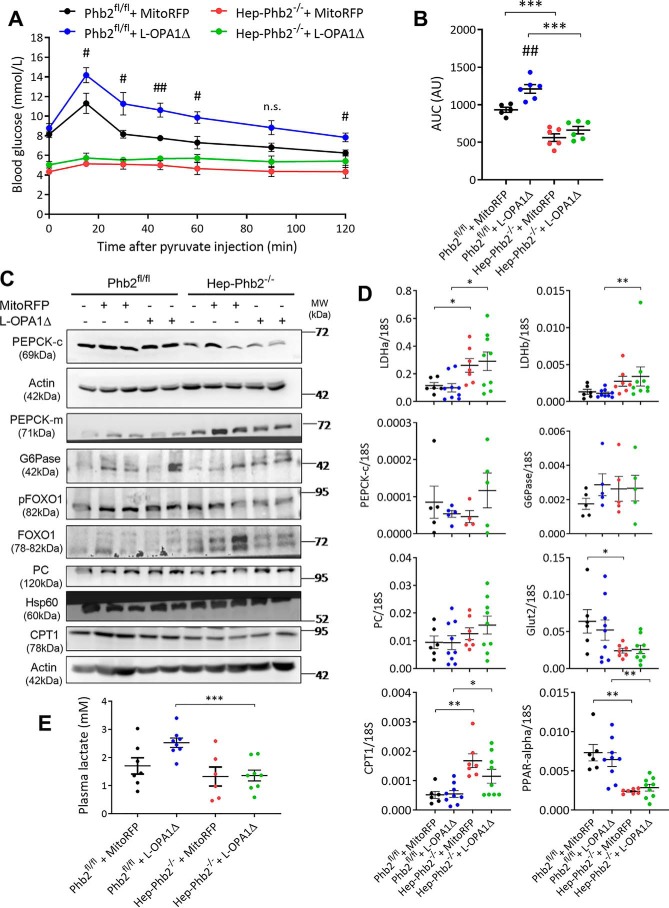
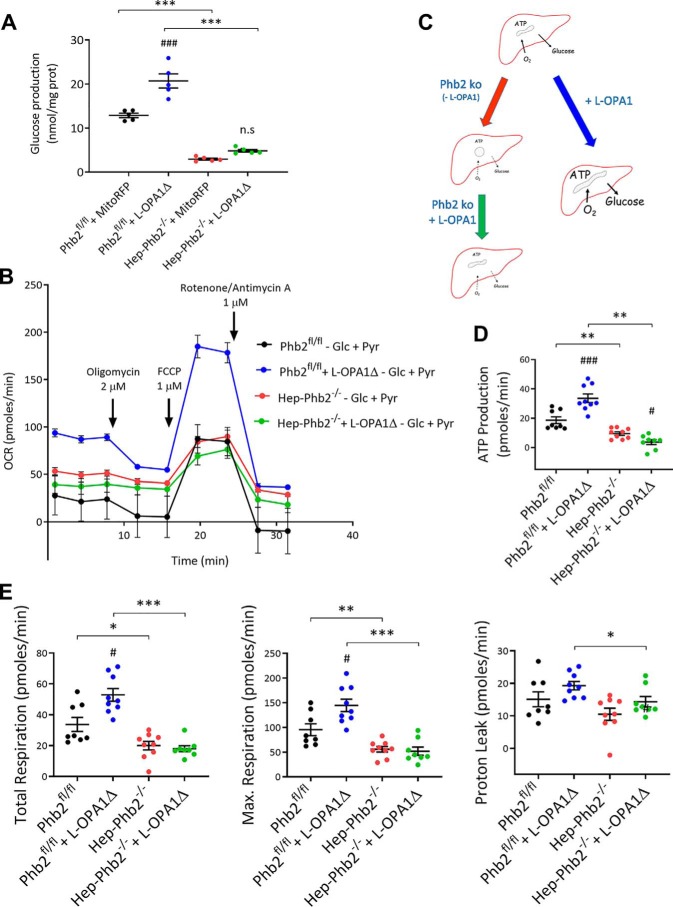
Patients with fatty liver diseases present altered mitochondrial morphology and impaired metabolic function. Mitochondrial dynamics and related cell function require the uncleaved form of the dynamin-like GTPase OPA1. Stabilization of OPA1 might then confer a protective mechanism against stress-induced tissue damages. To study the putative role of hepatic mitochondrial morphology in a sick liver, we expressed a cleavage-resistant long form of OPA1 (L-OPA1Δ) in the liver of a mouse model with mitochondrial liver dysfunction (i.e. the hepatocyte-specific prohibitin-2 knockout (Hep-Phb2-/-) mice). Liver prohibitin-2 deficiency caused excessive proteolytic cleavage of L-OPA1, mitochondrial fragmentation, and increased apoptosis. These molecular alterations were associated with lipid accumulation, abolished gluconeogenesis, and extensive liver damage. Such liver dysfunction was associated with severe hypoglycemia. In prohibitin-2 knockout mice, expression of L-OPA1Δ by in vivo adenovirus delivery restored the morphology but not the function of mitochondria in hepatocytes. In prohibitin-competent mice, elongation of liver mitochondria by expression of L-OPA1Δ resulted in excessive glucose production associated with increased mitochondrial respiration. In conclusion, mitochondrial dynamics participates in the control of hepatic glucose production.

Keywords: OPA1; gluconeogenesis; hepatocyte; liver; liver metabolism; mitochondria; mitochondrial metabolism; prohibitins.


Conflict of interest statement

The authors declare that they have no conflicts of interest with the contents of this article

Figures

Figure 1.
Figure 1.
Hep-Phb2−/− mice develop hypoglycemia, lose body weight, and accumulate lipids in the liver. A, Western blots showing prohibitin expression in isolated hepatocytes and tissue lysates of liver, pancreas, and skeletal muscle from control and Hep-Phb2−/− mice 2 weeks after tamoxifen-induced recombination. B, blood glucose levels under fed conditions after tamoxifen-induced recombination (n = 3–15 for control and n = 8–16 for Hep-Phb2−/− mice). C, body weight after tamoxifen-induced recombination (n = 10–15 for control and n = 8–16 for Hep-Phb2−/− mice). D, liver weight (normalized to body weight) 2 and 3 weeks after tamoxifen-induced recombination (n = 5–6 per group at week 2 and n = 9–10 per group at week 3). E, representative photographs of livers from control and Hep-Phb2−/− mice 2 and 3 weeks after tamoxifen-induced recombination. F, eWAT (normalized to body weight) 2 and 3 weeks after tamoxifen-induced recombination (n = 4–6 per group). G, H&E and Oil Red O sections on livers of control and Hep-Phb2−/− mice 2 and 3 weeks after tamoxifen-induced recombination. Scale bar, 50 μm. Values are expressed as mean ± S.E. (error bars); n.s., no significant difference; *, p < 0.05; **, p < 0.01; ***, p < 0.001 between two groups.
Figure 2.
Figure 2.
Prohibitin deletion leads to liver injuries with disrupted lipid and glucose metabolisms. A, plasma levels of liver injury markers alanine aminotransferase (ALT) and aspartate aminotransferase (AST) in control and Hep-Phb2−/− mice 2 weeks after tamoxifen-induced recombination (n = 3 per group). B, plasma levels of bilirubin (n = 3 per group). C, plasma levels of free fatty acid (FFA) (n = 9 for control and n = 12 for Hep-Phb2−/− mice). D, plasma levels of total cholesterol (n = 4 per group). E, plasma levels of triglyceride (n = 9 for control and n = 12 for Hep-Phb2−/− mice). F, triglyceride contents in liver (n = 5 for control and n = 6 for Hep-Phb2−/− mice). G, liver MTP activity (n = 5 for control and n = 6 for Hep-Phb2−/− mice). H, plasma levels of ketone body β-hydroxybutyrate (n = 9 for control and n = 12 for Hep-Phb2−/− mice). I, liver glycogen content under fed conditions (n = 6 for control and n = 5 for Hep-Phb2−/− mice). J, plasma insulin levels under fed conditions (n = 6 for control and n = 4 for Hep-Phb2−/− mice). K, plasma glucagon levels under fed conditions (n = 5 for control and n = 7 for Hep-Phb2−/− mice). Values are expressed as mean ± S.E. (error bars). n.s., no significant difference; *, p < 0.05; **, p < 0.01; ***, p < 0.001 between two groups.
Figure 3.
Figure 3.
Prohibitin deletion results in abolished gluconeogenesis and altered mitochondrial ultrastructure. A, intraperitoneal glucose tolerance test (ipGTT) with 2 g/kg glucose injected in 6-h-fasted control and Hep-Phb2−/− mice 2 weeks after tamoxifen-induced recombination (n = 7 for control and n = 5 for Hep-Phb2−/− mice). B, intraperitoneal insulin tolerance test (ipITT) with 0.75 units/kg insulin injected in fed control and Hep-Phb2−/− mice 2 weeks after tamoxifen-induced recombination (n = 6 per group). C–E, pyruvate challenge test with 2 g/kg sodium pyruvate injected in 6-h-fasted control and Hep-Phb2−/− mice 3 days, 1 week, and 2 weeks after tamoxifen-induced recombination (n = 3–8 per group). F, Western blot analysis of hepatic components of insulin signaling, glycogen synthesis, glycogenolysis, gluconeogenesis, and de novo lipogenesis under fed conditions. G, electron micrographs of livers from control and Hep-Phb2−/− mice 2 weeks after tamoxifen-induced recombination. Scale bar, 1 μm. Values are expressed as mean ± S.E. (error bars). n.s., no significant difference; *, p < 0.05; **, p < 0.01; ***, p < 0.001 between two groups.
Figure 4.
Figure 4.
In vitro L-OPA1Δ expression promotes mitochondrial fusion, delays uncoupler-induced mitochondrial depolarization, and increases resistance to apoptosis. A, Western blots of primary hepatocytes transduced with adenovirus expressing L-OPA1Δ with FLAG tags. The left half and right half of the gel were loaded with the same series of samples but incubated with anti-FLAG (left) and anti-OPA1 antibodies (right), respectively. OPA1 bands were labeled a, b, c, d, and e as described previously (62, 65, 66). B, representative confocal images showing MitoTracker Orange–labeled mitochondria (red) and BODIPY-labeled lipids (green) on primary hepatocytes with or without L-OPA1Δ adenovirus transduction. Scale bar, 10 μm. Quantification of two independent experiments (78 hepatocytes were counted on average per experiment). C, electron micrographs of primary hepatocytes from control and Hep-Phb2−/− mice with or without L-OPA1Δ adenovirus transduction (representative images of 14–52 per condition). Scale bar, 1 μm. D, mitochondrial membrane potential analysis indicated by TMRM fluorescence over mitochondrial regions in primary hepatocytes after 10 μm CCCP addition. Analysis of the time for 70% reduction of initial TMRM fluorescence signal from three independent experiments (n = 10–11 per condition for control hepatocytes, n = 5 per condition for knockout hepatocytes). E, quantification of the percentage of cells with cytochrome c release from two independent experiments (229 hepatocytes were counted on average per experiment, mean ± S.D. (error bars)). Values are means ± S.D.; *, p < 0.05; **, p < 0.01; ***, p < 0.001 between control and knockout conditions; #, p < 0.05; ##, p < 0.01; ###, p < 0.001 between L-OPA1Δ nontransduced and transduced conditions.
Figure 5.
Figure 5.
In vivo expression of L-OPA1Δ restores mitochondrial morphology but fails to rescue hepatic apoptosis and lipid accumulation, hypoglycemia, and loss of body weight in Hep-Phb2−/− mice. A, flow chart for in vivo expression of L-OPA1Δ by adenoviral gene transfer. Control and Hep-Phb2−/− mice were injected with adenovirus expressing MitoRFP or L-OPA1Δ via the tail vein, and on the same day, tamoxifen was implanted to induce prohibitin deletion. Hepatocyte isolation was performed 2 weeks after adenovirus injection/tamoxifen implantation. B, representative confocal images showing MitoTracker Orange–labeled mitochondria (red) and BODIPY-labeled lipids (green) on primary hepatocytes with or without L-OPA1Δ adenovirus transduction. Scale bar, 10 μm. Shown is quantification of isolated hepatocytes exhibiting hyperfused, intermediate, and fragmented mitochondria from two independent experiments (392 hepatocytes were counted on average per experiment, mean ± S.D. (error bars)). C, quantification of the percentage of cells with cytochrome c release from two independent experiments (396 hepatocytes were counted on average per experiment, mean ± S.D.). D, representative immunofluorescence images on liver frozen sections stained with anti-FLAG antibody, Alexa Fluor 488 conjugate (green), to examine expression efficiency of FLAG-tagged L-OPA1Δ following adenoviral gene transfer. Scale bar, 20 μm. E, blood glucose levels under fed conditions after adenovirus injection/tamoxifen implantation (n = 5–6 per group, mean ± S.E.). F, body weights normalized to time 0 after adenovirus injection/tamoxifen implantation (n = 5–6 per group, mean ± S.E.). G, body composition of mice measured 2 weeks after adenovirus injection/tamoxifen implantation (n = 5–6 per group, mean ± S.E.). H, H&E and Oil Red O sections on livers of control and Hep-Phb2−/− mice 2 weeks after adenovirus injection/tamoxifen implantation. Scale bar, 50 μm. n.s., no significant difference; *, p < 0.05; **, p < 0.01; ***, p < 0.001 between control and knockout conditions; #, p < 0.05; ##, p < 0.01; ###, p < 0.001 between L-OPA1Δ nontransduced and transduced conditions.
Figure 6.
Figure 6.
In vivo expression of L-OPA1Δ potentiates endogenous glucose production in prohibitin-competent mice. A and B, pyruvate challenge using (2 g/kg) on 6-h-fasted control and Hep-Phb2−/− mice 2 weeks after adenovirus injection/tamoxifen implantation; B, corresponding AUC (n = 5–6 per group). C, Western blot analysis of hepatic expression of PEPCK-c, PEPCK-m, G6Pase, pFOXO1, FOXO1, PC, and CPT1 in liver lysates from mice 2 weeks after adenovirus injection/tamoxifen implantation. Actin and Hsp60 served as loading controls. D, mRNA levels for LDHa, LDHb, PEPCK-c, G6Pase, PC, Glut2, CPT, and PPAR-α in liver from mice 2 weeks after adenovirus injection/tamoxifen implantation (n = 4–9 per group). E, plasma lactate concentration from mice 2 weeks after adenovirus injection/tamoxifen implantation (n = 6–8 per group). Values are expressed as mean ± S.E. (error bars); *, p < 0.05; **, p < 0.01; ***, p < 0.001 between control and knockout condition; #, p < 0.05; ##, p < 0.01; ###, p < 0.001 between L-OPA1Δ nontransduced and transduced conditions.
Figure 7.
Figure 7.
Expression of L-OPA1Δ enhances gluconeogenesis, mitochondrial respiration, and ATP production in isolated hepatocytes. A, glucose production by hepatocytes isolated from control and Hep-Phb2−/− mice 2 weeks after tamoxifen implantation and MitoRFP or L-OPA1Δ adenovirus injection. Gluconeogenesis was stimulated with 10 mm lactate plus 10 mm pyruvate (n = 5 per group). B, oxygen consumption rate (OCR monitored by Seahorse XF-96 instrument) measured on isolated hepatocytes transduced with control MitoRFP or L-OPA1Δ adenoviruses. OCR was stimulated with 5 mm glucose plus 2 mm pyruvate followed by the sequential addition of the indicated inhibitors (n = 8–9 per group). C, sketch presenting the different situations according to the respective experimental interventions. D and E, ATP production, total respiration, maximal respiration, and proton leak calculated from OCR data (n = 8–9 per group). Values are expressed as mean ± S.E. (error bars). *, p < 0.05; **, p < 0.01; ***, p < 0.001 between control and knockout conditions; #, p < 0.05; ##, p < 0.01; ###, p < 0.001 between L-OPA1Δ nontransduced and transduced conditions.

Comment in

Similar articles

Cited by

References

    1. Petersen M. C., Vatner D. F., and Shulman G. I. (2017) Regulation of hepatic glucose metabolism in health and disease. Nat. Rev. Endocrinol. 13, 572–587 10.1038/nrendo.2017.80 - DOI - PMC - PubMed
    1. Bellentani S., Scaglioni F., Marino M., and Bedogni G. (2010) Epidemiology of non-alcoholic fatty liver disease. Dig. Dis. 28, 155–161 10.1159/000282080 - DOI - PubMed
    1. Loomba R., and Sanyal A. J. (2013) The global NAFLD epidemic. Nat. Rev. Gastroenterol. Hepatol. 10, 686–690 10.1038/nrgastro.2013.171 - DOI - PubMed
    1. Fromenty B., and Pessayre D. (1995) Inhibition of mitochondrial β-oxidation as a mechanism of hepatotoxicity. Pharmacol. Ther. 67, 101–154 10.1016/0163-7258(95)00012-6 - DOI - PubMed
    1. Exton J. H. (1972) Gluconeogenesis. Metabolism 21, 945–990 10.1016/0026-0495(72)90028-5 - DOI - PubMed

Publication types

LinkOut - more resources