. 2019 Oct;9(10):1452-1467.
doi: 10.1158/2159-8290.CD-19-0298. Epub 2019 Jul 8.

Altered Nuclear Export Signal Recognition as a Driver of Oncogenesis

Affiliations

Altered Nuclear Export Signal Recognition as a Driver of Oncogenesis

Justin Taylor et al. Cancer Discov. 2019 Oct.

Abstract

Altered expression of XPO1, the main nuclear export receptor in eukaryotic cells, has been observed in cancer, and XPO1 has been a focus of anticancer drug development. However, mechanistic evidence for cancer-specific alterations in XPO1 function is lacking. Here, genomic analysis of 42,793 cancers identified recurrent and previously unrecognized mutational hotspots in XPO1. XPO1 mutations exhibited striking lineage specificity, with enrichment in a variety of B-cell malignancies, and introduction of single amino acid substitutions in XPO1 initiated clonal, B-cell malignancy in vivo. Proteomic characterization identified that mutant XPO1 altered the nucleocytoplasmic distribution of hundreds of proteins in a sequence-specific manner that promoted oncogenesis. XPO1 mutations preferentially sensitized cells to inhibitors of nuclear export, providing a biomarker of response to this family of drugs. These data reveal a new class of oncogenic alteration based on change-of-function mutations in nuclear export signal recognition and identify therapeutic targets based on altered nucleocytoplasmic trafficking. SIGNIFICANCE: Here, we identify that heterozygous mutations in the main nuclear exporter in eukaryotic cells, XPO1, are positively selected in cancer and promote the initiation of clonal B-cell malignancies. XPO1 mutations alter nuclear export signal recognition in a sequence-specific manner and sensitize cells to compounds in clinical development inhibiting XPO1 function.This article is highlighted in the In This Issue feature, p. 1325.


Conflict of interest statement

Conflict of interest disclosure: O.A.-W. has served as a consultant for H3B Biomedicine, Foundation Medicine Inc, Merck, and Janssen; O.A.-W. has received prior research funding from H3B Biomedicine unrelated to the current manuscript.

Figures

Figure 1.
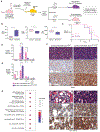
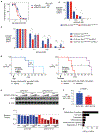
Figure 1.. XPO1 hotspot mutations promote proliferation in vivo.
A, Lollipop plot of the distribution and frequency of XPO1 mutations across cancer patients and identification of statistically significant XPO1 mutational hotspots (false discovery rate < 1%). B, Frequency of XPO1 E571 mutations by cancer type in 42,793 sequenced tumors (CNS = central nervous system; CUP = cancer of unknown primary). The number of individual patients with XPO1 E571 mutations within each disease category is also shown. C, Fraction of XPO1 E571 mutations by subtype of lymphoid malignancy (DLBCL = diffuse large B-cell lymphoma). D, Imaging of luciferase-labeled XPO1 WT and E571K mutant NALM-6 cells in vivo after xenografting into NSG mice. Four NSG mice were engrafted in each group. E, Kaplan-Meier survival curves of the mice from (D). Survival was computed using the Kaplan-Meier estimator (*P = 0.02). F, Spleen weights and representative photos from CD19-cre Xpo1WT/WT and CD19-cre Xpo1E571K/WT mice (n = 5 mice/group; ruler represents centimeters). G, Number of colonies of bone marrow cells from Xpo1WT and Xpo1E571K/WT mice in methylcellulose media containing IL-7 (n = 3 mice/group). Equal numbers of cells were replated. Differences were calculated using a two-sided Student’s t-test. *P < 0.05, **P < 0.01, ***P < 0.001.
Figure 2.
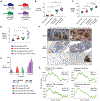
Figure 2.. Endogenous expression of Xpo1 E571K mutation in mice enhances proliferation and promotes B-cell transformation.
A, Kaplan-Meier survival curve of CD19-cre Xpo1WT/WT and CD19-cre Xpo1E571K/WT mice treated monthly with vehicle or allo-immunization with sheep red blood cells (SRBC; n = 10 mice/group). B, Number of mature myeloid and lymphoid cells in the bone marrow and C, B-cell subsets in spleens of 12-week-old CD19-cre Xpo1WT/WT (n = 5 mice) and CD19-cre Xpo1E571K/WT mice (n = 5 mice) (MZ = marginal zone [CD19+ CD21hi IgMhi B220+ CD23]; MZP = marginal zone precursor [CD19+ CD21hi IgMhi B220+ CD23]; FOL = follicular [CD19+ CD21+ IgM+ IgD+], T = transitional [CD19+ CD21lo IgMhi CD93+]). D, Spleen weights and E, representative images of spleens at time of death from mice in (A) (ruler represents inches). F, Frequency of germinal center (B220+ FAS+ GL7+) B-cells in spleens from CD19-cre Xpo1E571K/WT or CD19-cre Xpo1WT/WT mice one week after SRBC or vehicle treatment (n = 7 mice/group). G, Flow cytometry of tumors from three independent CD19-cre Xpo1E571K/WT mice showing B220/CD5/CD23 triple-positive cells in peripheral blood. Differences were calculated using a two-sided Student’s t-test. *P < 0.05, **P < 0.01.
Figure 3.
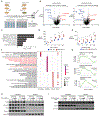
Figure 3.. Xpo1 mutations cooperate with MYC overexpression to drive lymphomagenesis.
A, Schema of the method to analyze the effect of the Xpo1 E571K mutation on MYC-driven B-cell lymphomagenesis in vivo. CAG-creERT Xpo1E571K/WT -Myc mice were generated on a CD45.2 C57BL/6J mice background and then 1×10⁶ bone marrow (BM) mononuclear cells were transplanted into lethally irradiated CD45.1 C57BL/6J recipient mice. Following 2 weeks of engraftment, tamoxifen was administered intraperitoneally (I.P.) to half of the recipients to result in expression of the mutant allele while vehicle was administered to the other half of the recipients. B, Complete blood counts (WBC = white blood cells; Hgb = hemoglobin; PLT = platelets) from CAG-creERT Xpo1E571K/WT -Myc mice with (tamoxifen) or without (vehicle) induction of the Xpo1E571K/WT at end-stage disease (n = 5 recipient mice/group). C, Kaplan-Meier survival curves of recipients of BM from CAG-creERT Xpo1E571K/WT -Myc following tamoxifen or vehicle treatment resulting in expression of Xpo1 mutant allele or Xpo1 wild-type configuration respectively (n = 5 mice/group). Number of mature myeloid and lymphoid cells in the D, BM and E, spleen of recipients of mice from (C) at end-stage disease (n = 5 recipient mice/group). F, Hematoxyiln and eosin stain (top), anti-Ki67 immunohistochemical (IHC) stain (middle), and anti-B220 IHC stain (bottom) in spleen (first three rows) and bone marrow (bottom three rows) from CAG-creERT Xpo1WT/WT -Myc and CAG-creERT Xpo1E571K/WT -Myc mice. Scale bars: 100 μm (left) and 20 μm (right). G, Gene ontology analysis for biological processes significantly enriched in differentiatlly expressed genes from mRNA sequencing of CAG-creERT Xpo1E571K/WT -Myc versus CAG-creERT Xpo1WT/WT -Myc tumors. (FDR: False Discovery Rate; NES: Normalized Enrichment Score). Survival was computed using the Kaplan-Meier estimator. Differences were calculated using a two-sided Student’s t-test, *P < 0.05.
Figure 4:
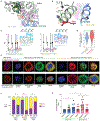
Figure 4:. Xpo1 mutations cooperate with BCL2 overexpression to drive lymphomagenesis.
A, Schematic showing the four genotypes of mice created by crossing CD19-cre Xpo1E571K/WT and Vav-BCL2 mice. B, Absolute number of B-cells in the peripheral blood and C, spleen weight of 12-week-old CD19-cre Xpo1WT/WT, CD19-cre Xpo1E571K/WT, CD19-cre Xpo1WT/WT Vav-BCL2, and CD19-cre Xpo1E571K/WT Vav-BCL2 mice (n = 7 mice/group). D, Number of BrdU+ (bromodeoxyuridine) splenic B220+ B-cells from 12-week-old mice (BrdU was administered in vivo and animals sacrificed 48 hours later for analysis). E, Number of colonies grown from BM cells from respective genotypes in IL-7 containing methylcellulose. F, Anti-B220 immunohistochemistry in CD19-cre Xpo1WT/WT Vav-BCL2 and CD19-cre Xpo1E571K/WT Vav-BCL2 mice. Scale bars: 200 μm G, Gene set enrichment analysis of key pathways dysregulated from mRNA sequencing of CD19-cre Xpo1E571K/WT Vav-BCL2 versus CD19-cre Xpo1WT/WT Vav-BCL2 mice (FDR: False Discovery Rate; NES: Normalized Enrichment Score). Differences were calculated using a two-sided Student’s t-test, *P < 0.05, **P < 0.01, ***P < 0.001, ****P < 0.0001.
Figure 5.
Figure 5.. Aberrant nuclear/cytoplasmic compartmentalization of proteins and enhanced immune signaling in XPO1 mutant cells.
A, Schema of SILAC (stable isotope labeling of amino acids in culture)-based mass spectrometry analysis of nuclear and cytoplasmic proteins from isogenic NALM-6 XPO1E571K/WT and XPO1WT/WT cells. SILAC experiments were performed in biological triplicate. B, Volcano plots of differential protein abundance in XPO1E571K/WT compared to XPO1WT/WT cells in nucleus (left) and cytoplasm (right) from experiment in (A). X-axis represents fold-change with dotted lines indicating fold change ratios = ∣2∣ and Y-axis represents significance with dotted lines at –log10[P-value] of 1.30. C, Enrichment analysis of proteins mislocalized in XPO1 mutant relative to WT cells from (B) (red line indicates pathways with significant enrichment at –log10[P-value] of 1.30). D, Quantification of NF-κB luciferase reporter activity after stimulation of cells with TNF-α, and E, NFAT luciferase reporter activity after stimulation with PMA/ionomycin. Differences were calculated using a two-sided Student’s t-test. *P < 0.05, **P < 0.01, ***P < 0.001. F, Gene ontology analysis for biological processes significantly enriched in CD19-cre Xpo1E571K/WT versus CD19-cre Xpo1WT/WT mice across several subpopulations of B cells. G, Gene set enrichment analysis of key pathways dysregulated from RNA-seq of CLL patients with or without XPO1 E571K mutations (“NES” in this case represents the normalized enrichment score). H, Western blot of nuclear and cytoplasmic P-p65 and IκBα after stimulation of XPO1 mutant or WT cells with two doses of TNFα. I, Western blot of nuclear NFAT2 after stimulation of XPO1 mutant or WT cells with PMA and two doses of ionomycin.
Figure 6.
Figure 6.. XPO1 mutations alter nuclear export of cargo proteins based on the charge of amino acids C-terminal to their nuclear export signal (NES).
A, Structure of XPO1 (gray) in complex with a protein cargo (protein kinase inhibitor [PKI]; in blue) having a classical NES (structure as previously published (37)). In green is the GTP-binding nuclear protein Ran, while the position of the two tumor-specific XPO1 hotspot mutations (E571 and D624) are labeled in red. B, In light green is the helix of XPO1 (gray) from which mutant E571 (red) directly interacts with the classical NES sequence (LALKLAGLDI) of the protein cargo (PKI; light blue). Critical hydrophobic positions on the cargo required for interactions with XPO1 are colored dark blue and shown as wireframes along with those interacting XPO1 residues. Gray lines show the hydrophobic interactions XPO1 and PKI. C, Sequence logos illustrating the amino acid residue content of putative NESs predicted in proteins differentially exported in XPO1 mutant relative to wild-type (WT) cells from the experiment in Figure 4A. Ф1-4 indicate the four hydrophobic amino acid positions (consisting of leucine, isoleucine, valine, phenylalanine, or methionine) in the consensus NES of XPO1 cargo proteins. Insets show the four amino acids C-terminal to the last hydrophobic amino acid residue within the NES (negatively charged residues shown in blue; positively charged residues shown in red). D, Violin plots quantifying the net charge of the four amino acids following Ф4 in proteins with enhanced versus reduced export in cells expressing the XPO1 E571K mutation. E, Confocal microscopy images of cells expressing YFP-XPO1WT (left three panels) or YFP-XPO1E571K/WT (right three panels) constructs with a nuclear export reporter plasmid bearing IκBα NES mutagenized to possess either a positively (top) or negatively (bottom) charged C-terminal end (reporters alone on far left panels). Of note, the function of transfected XPO1 E571K or XPO1 WT was evaluated in isolation from endogenous XPO1 in these experiments as cells were exposed to the XPO1 inhibitor leptomycin B and both XPO1 WT and E571K cDNAs also contained the C528S mutation (a mutation conferring resistance to leptomycin B (50); see Supplementary Figure S6D). Scale bar: 5 μm. F, Ratio of enhanced (purple) or reduced (yellow) nuclear export of IκBα NES reporter in each condition from (B) (where “C” represents cytoplasmic localization of the reporter and “N” nuclear localization of the reporter). Bars represent an average of measurements of 10-12 cells by two independent assessments with error bars representing the standard deviation between assessments. G, Mean cytoplasmic to nuclear ratio of intensity of IκBα NES reporter signal in each condition from (B) as measured by image analysis software. Individual points represent cytoplasmic to nuclear ratio and error bars represent standard deviation. *P < 0.05, **P < 0.01. Quantification of differences were calculated using a two-sided Student’s t-test.
Figure 7.
Figure 7.. Enhanced sensitivity of XPO1 mutant cells to XPO1 inhibition in vitro and in vivo.
A, Dose response curve and IC50 values of isogeneic NALM-6 XPO1WT or XPO1E571K/WT cell lines treated with selinexor. B, Number of colonies from bone marrow mononuclear cells (BM MNCs) from CD19-cre Xpo1WT/WT and Xpo1E571K/WT mice grown in IL-7 containing methylcellulose with either vehicle (DMSO) or increasing doses of KPT-330. Bar graphs represent the number of colonies with each treatment relative to vehicle controls. C, Number of colonies from BM MNCs from Vav-BCL2 CD19-cre Xpo1WT/WT or Vav-BCL2 CD19-cre Xpo1E571K/WT knock-in mice treated with either vehicle (DMSO) or selinexor. D, Kaplan-Meier curves of CAG-creERT Xpo1E571K/WT -Myc mice without induction of the Xpo1E571K/WT mutation (left) or with induction of the mutation (tamoxifen; right) treated with selinexor or vehicle. E, XPO1 protein levels by western blot (top; quantification below) in NALM-6 XPO1WT or XPO1E571K/WT cell lines treated with selinexor for 16 or 24 hours (5, 10 and 50nM doses). F, Bar plots of cell free, in vitro binding affinity (Kd) values of the binding of KPT-185 to purified XPO1 wild-type or XPO1 E571K protein. G, Gene ontology analysis of proteins retained in the nucleus in XPO1E571K/WT cells relative to wild-type after XPO1 inhibition (red line indicates pathways with significant enrichment at –log10[P-value] of 1.30). Differences were calculated using a two-sided Student’s t-test. *P < 0.05, ** P < 0.01.

Comment in

  • Delivering to the wrong address.
    Foronda M. Foronda M. Nat Rev Cancer. 2019 Oct;19(10):542-543. doi: 10.1038/s41568-019-0200-2. Nat Rev Cancer. 2019. PMID: 31439948 No abstract available.

References

    1. Stade K, Ford CS, Guthrie C, Weis K. Exportin 1 (Crm1p) is an essential nuclear export factor. Cell. 1997;90:1041–50. - PubMed
    1. Fukuda M, Asano S, Nakamura T, Adachi M, Yoshida M, Yanagida M, et al. CRM1 is responsible for intracellular transport mediated by the nuclear export signal. Nature. 1997;390:308–11. - PubMed
    1. Ossareh-Nazari B, Bachelerie F, Dargemont C. Evidence for a role of CRM1 in signal-mediated nuclear protein export. Science. 1997;278:141–4. - PubMed
    1. Jeyasekharan AD, Liu Y, Hattori H, Pisupati V, Jonsdottir AB, Rajendra E, et al. A cancer-associated BRCA2 mutation reveals masked nuclear export signals controlling localization. Nat Struct Mol Biol. 2013;20:1191–8. - PMC - PubMed
    1. Pauty J, Couturier AM, Rodrigue A, Caron MC, Coulombe Y, Dellaire G, et al. Cancer-causing mutations in the tumor suppressor PALB2 reveal a novel cancer mechanism using a hidden nuclear export signal in the WD40 repeat motif. Nucleic Acids Res. 2017;45:2644–57. - PMC - PubMed

Publication types

MeSH terms

Substances