. 2019 Jul 23;116(30):15160-15169.
doi: 10.1073/pnas.1904096116. Epub 2019 Jul 8.

Adaptation by naïve CD4+ T cells to self-antigen-dependent TCR signaling induces functional heterogeneity and tolerance

Affiliations

Adaptation by naïve CD4+ T cells to self-antigen-dependent TCR signaling induces functional heterogeneity and tolerance

Wendy M Zinzow-Kramer et al. Proc Natl Acad Sci U S A. .

Abstract

Naïve CD4+ T cells experience weak T cell receptor (TCR) signals induced by self-peptides presented by MHC II. To investigate how these "basal" TCR signals influence responses to agonist TCR ligand stimulation, we analyzed naïve CD4+ cells expressing varying amounts of CD5, Ly6C, and Nur77-GFP, markers that reflect the strength of basal TCR signaling. Phenotypic analyses indicate that the broadest range of basal TCR signal strength can be visualized by a combination of Nur77-GFP and Ly6C. A range of basal TCR signaling is detectable even in populations that express identical TCRs. Whereas moderate basal TCR signal strength correlates with higher IL-2 secretion at early time points following TCR stimulation, weak basal TCR signaling correlated with higher IL-2 secretion at later time points. We identify a population of Nur77-GFPHI Ly6C- cells that could not be reliably marked by either of CD5, Ly6C, or Nur77-GFP alone. These cells experience the strongest basal TCR signaling, consistently produce less IL-2, and express PD-1 and markers associated with anergy, such as Grail and Cbl-b. We propose that adaptation to the strength of basal TCR signaling drives the phenotypic and functional heterogeneity of naïve CD4+ cells.

Keywords: CD5; Nur77; T cell activation; T cell anergy; basal TCR signaling.


Conflict of interest statement

The authors declare no conflict of interest.

Figures

Fig. 1.
Fig. 1.
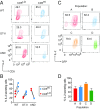
Increased Nur77-GFP and CD5 inversely correlates with IL-2 secretion. (A) Overlaid histograms show the expression of GFP, CD69, and CD25 on the sorted GFPLO (red), GFPMED (blue), and GFPHI (orange) populations that were not stimulated (Upper row) or stimulated (Lower row) before the IL-2 secretion assay. Non-TCR transgenic T cells were stimulated with APCs plus soluble anti-CD3 antibodies, OT-II TCR transgenic cells were stimulated with APCs plus OVA peptide, and AND TCR transgenic T cells were stimulated with I-Ek–expressing APCs from C3H mice, plus MCC peptide. (B) Contour plots show the expression of GFP and secreted IL-2 in the indicated unstimulated and stimulated samples. The numbers indicate the percentage of events within the IL-2+ gate. (C) Bar graph displays the normalized ratio of the percentages of IL-2+ cells from the GFPLO sample divided by the GFPHI sample. Symbols indicate the individual replicates and the bars represent the mean. Error bars represent SEM. Data shown are representative of n = 3 or 6 independent experiments. (D) Contour plots show the expression of CD5 and secreted IL-2 in the indicated unstimulated and stimulated samples. The numbers indicate the percentage of events within the IL-2+ gate. (E) Bar graph displays the normalized ratio of the percentages of IL-2+ cells from the CD5LO sample divided by the CD5HI sample. Symbols indicate the individual replicates and the bars represent the mean. Error bars represent SEM. Data shown are representative of n = 3 independent experiments.
Fig. 2.
Fig. 2.
Early IL-2 responses differ between CD5HI and Nur77-GFPHI cells. (A) Histogram shows cells sorted for low or high CD5 expression. Contour plots show CD5 and IL-2 staining after an IL-2 secretion assay. Numbers represent the percentage of cells within the indicated gate. Data are representative of n = 3 independent experiments. (B) Histogram shows cells sorted for low or high Nur77-GFP expression. Contour plots show GFP and IL-2 staining after an IL-2 secretion assay. Numbers represent the percentage of cells within the indicated gate. Data are representative of n = 3 independent experiments. (C) Bar graph shows the mean log2 fold-change between the percentages of IL-2–secreting cells in the CD5LO or GFPLO population divided by the percentages of IL-2–secreting cells in the CD5HI or GFPHI population. Error bars represent SD. Data are from n = 3 independent experiments.
Fig. 3.
Fig. 3.
Heterogeneous expression of Nur77-GFP, CD5, and Ly6C on naïve CD4+ cells. (A) Contour plots show the expression of the indicated markers on CD4+ CD44LO CD62LHI Foxp3-RFP cells from the indicated mouse strains. (B) Contour plots show the expression of the indicated markers on total CD4+ Foxp3-RFP+ cells from the indicated mouse strains. (C) Contour plots show Nur77-GFP and Foxp3-RFP expression on total CD4+ cells from the indicated mouse strains. (D) Overlaid histograms show the expression of Nur77-GFP by Ly6C and Ly6C+ Tregs. Data shown are representative of n = 3 independent experiments.
Fig. 4.
Fig. 4.
Nur77-GFPHI Ly6C cells are a population not consistently identified by a CD5HI phenotype. (A) Schematic shows the 4 arbitrary gates based on Nur77-GFP fluorescence and Ly6C staining used in this study. Letters indicate the designation applied to each population. (B) Bar graph shows the percentages of CD5LO or CD5HI cells that fall within population A through D gates in the indicated mouse strains. (C) Contour plots show the expression of Nur77-GFP and Ly6C on the total naïve CD4+ cell population, CD5LO and CD5HI cells. CD5LO are the lowest 15% and CD5HI cells are the highest 15% of naïve CD4+ cells by CD5 expression. Numbers indicate the percentage of cells within each gate, and are the numbers presented in the graphs in B. Representative of n = 3 independent experiments. (D) Bar graphs show the percentages of IL-2–secreting cells from sorted populations A to D, after 4 or 16 h of stimulation with APCs and anti-CD3. Error bars represent SEM. Data are from n = 3 experiments.
Fig. 5.
Fig. 5.
Attenuated agonist-induced TCR signal strength in cells with high basal TCR signaling. (A) Contour plot shows GFP and Ly6C expression on non-TCR transgenic CD4+ CD44LO cells, and the 4 gates indicating populations A to D. Overlaid histogram shows the ratio of (Ca2+-bound Indo-1) divided by (Ca2+-unbound Indo-1) over time for each of the 4 gated populations. Arrows indicate the time of addition of soluble anti-CD3 or cross-linking secondary antibodies. Data are representative of n = 3 independent experiments. (B) Contour plots show staining intensity of ERK phospho-Thr-202/Tyr-204 and Nur77-GFP in unstimulated and anti-CD3 stimulated non-TCR transgenic CD4+ cells. Overlaid histograms show the distribution of cells gated on low or high GFP expression and the intensity of phospho-ERK staining in the GFPLO (red) and GFPHI (blue) populations. Data representative of n = 3 experiments.
Fig. 6.
Fig. 6.
Decreased IL-2 response by Nur77-GFPHI Ly6C cells is not rescued by bypassing TCR-proximal signals. (A) Contour plots show expression of CD5 and secreted IL-2 following stimulation with PMA and ionomycin for 16 h. (Left) Sorted CD5LO cells and (Right) sorted CD5HI cells from the indicated mouse strains. Numbers indicate the percentage of cells within the IL-2+ gate. Data representative of n = 2 or 3 experiments. (B) Graph displays the percentage of CD5LO and CD5HI staining positive for secreted IL-2 following PMA and ionomycin stimulation. Individual dots indicate replicates and the lines connect data points from the same experiment. (C) Contour plots show the expression of Nur77-GFP and secreted IL-2 by populations A to D following stimulation with PMA and ionomycin. Numbers indicate the percentage of cells within the IL-2+ gate. Data representative of n = 3 experiments. (D) Bar graph displays the percentage of IL-2 secreting cells following PMA and ionomycin stimulation. Bars represent the mean and error bars represent SEM, n = 3 individual experiments.
Fig. 7.
Fig. 7.
The stability of GFP and Ly6C expression on naïve CD4+ cells in vivo. (A, Upper) Contour and dot plots show GFP and Ly6C expression on sorted donor cells before adoptive transfer. Letters indicate the 4 cell populations sorted. (Lower) Contour plots show GFP and Ly6C expression by donor cells 4- and 10-d posttransfer into WT CD45.1+ hosts. Numbers indicate the percentage of events within each gate. Data representative of n = 2 experiments. (B) Contour plots show GFP and Ly6C expression on donor non-TCR transgenic Foxp3 CD4+ CD44LO cells pretransfer and posttransfer into WT or MHC class II-deficient hosts. Data representative of n = 2 experiments. (C) Naïve, Foxp3 OT-II TCR transgenic CD4+ cells were sorted based on GFP and Ly6C expression into four populations (A to D as shown in dot plot). Sorted cells were adoptively transferred into congenic WT hosts, which were immunized with OVA peptide-pulsed APCs. Contour plots show GFP and Ly6C expression on donor cells 72 h after immunization. Histograms show dilution of CellTrace violet by the indicated populations. Data representative of n = 2 experiments.
Fig. 8.
Fig. 8.
Anergic phenotype in naïve cells with the highest basal TCR signal strength. (A, Top) Contour plots show the gating scheme for populations A to D based on GFP and Ly6C expression. Shown are naïve CD4+ CD44LO CD62LHI Foxp3 cells on non-TCR transgenic, OT-II, or AND backgrounds. (Middle) Histograms show PD-1 expression on populations A to D. (Bottom) Contour plots show GFP and PD-1 expression on the indicated populations. Data representative of n = 3 experiments. (B) Bar graph shows the relative expression of Grail (Rnf128) mRNA expression from non-TCR transgenic cells sorted with population A to D phenotype based on GFP and Ly6C expression. Values were normalized to a sample of total naïve CD4+ cells. Error bars represent SD. Data representative of n = 2 independent experiments. (C) Immunoblot analysis of Cbl-b expression in whole cell lysates of naïve CD4+ CD44LO cells sorted based on GFP and Ly6C (populations A to D). Numbers represent the ratio of Cbl-b to ERK 2, normalized to population A. Data representative of n = 2 experiments. (D) Naïve Foxp3 OT-II transgenic cells were sorted based on GFP and Ly6C expression as shown in the pre- and postsort contour plots. Sorted cells were stimulated with APCs and OVA peptide with exogenous IL-2 alone or in combination with 10 ng/mL TGF-β. Contour plots show the expression of Foxp3-RFP after 72 h in culture. Numbers indicate the percentage of events within the indicated quadrant. Data are representative of n = 2 experiments.

Similar articles

Cited by

References

    1. Hogquist K. A., Jameson S. C., The self-obsession of T cells: How TCR signaling thresholds affect fate ‘decisions’ and effector function. Nat. Immunol. 15, 815–823 (2014). - PMC - PubMed
    1. Myers D. R., Zikherman J., Roose J. P., Tonic signals: Why do lymphocytes bother? Trends Immunol. 38, 844–857 (2017). - PMC - PubMed
    1. Vrisekoop N., Monteiro J. P., Mandl J. N., Germain R. N., Revisiting thymic positive selection and the mature T cell repertoire for antigen. Immunity 41, 181–190 (2014). - PMC - PubMed
    1. Schluns K. S., Kieper W. C., Jameson S. C., Lefrançois L., Interleukin-7 mediates the homeostasis of naïve and memory CD8 T cells in vivo. Nat. Immunol. 1, 426–432 (2000). - PubMed
    1. Sprent J., Surh C. D., Normal T cell homeostasis: The conversion of naive cells into memory-phenotype cells. Nat. Immunol. 12, 478–484 (2011). - PMC - PubMed

Publication types

MeSH terms

LinkOut - more resources