

Mesenchymal stem cells prevent the progression of diabetic nephropathy by improving mitochondrial function in tubular epithelial cells
- PMID: 31285429
- PMCID: PMC6802630
- DOI: 10.1038/s12276-019-0268-5
Mesenchymal stem cells prevent the progression of diabetic nephropathy by improving mitochondrial function in tubular epithelial cells
Abstract
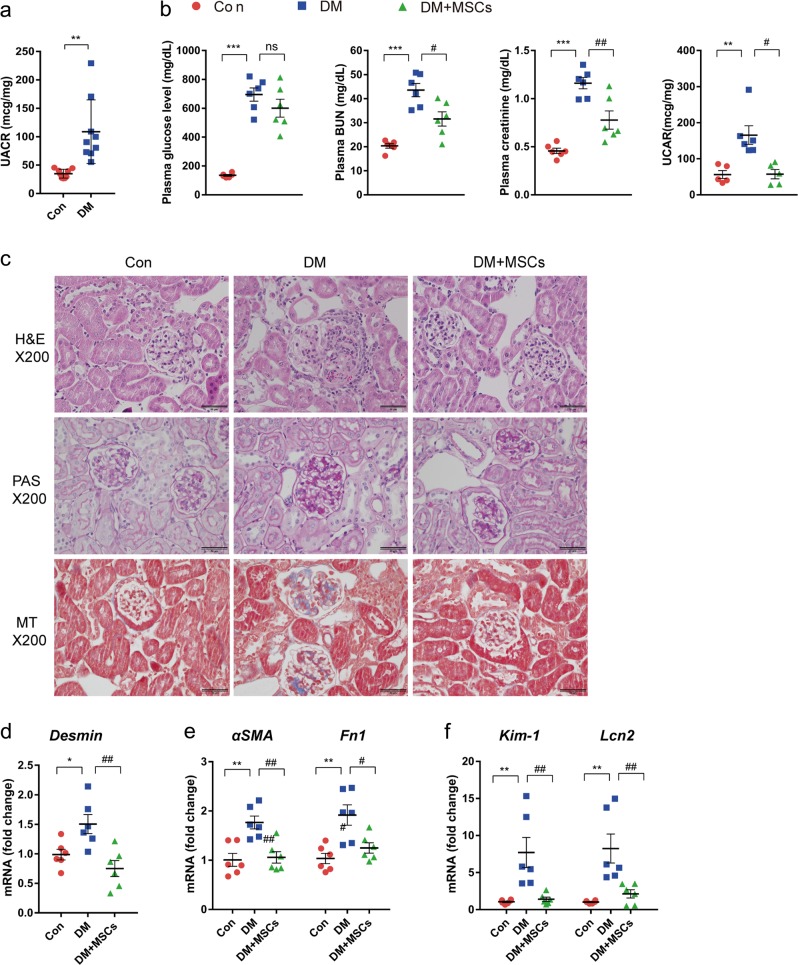
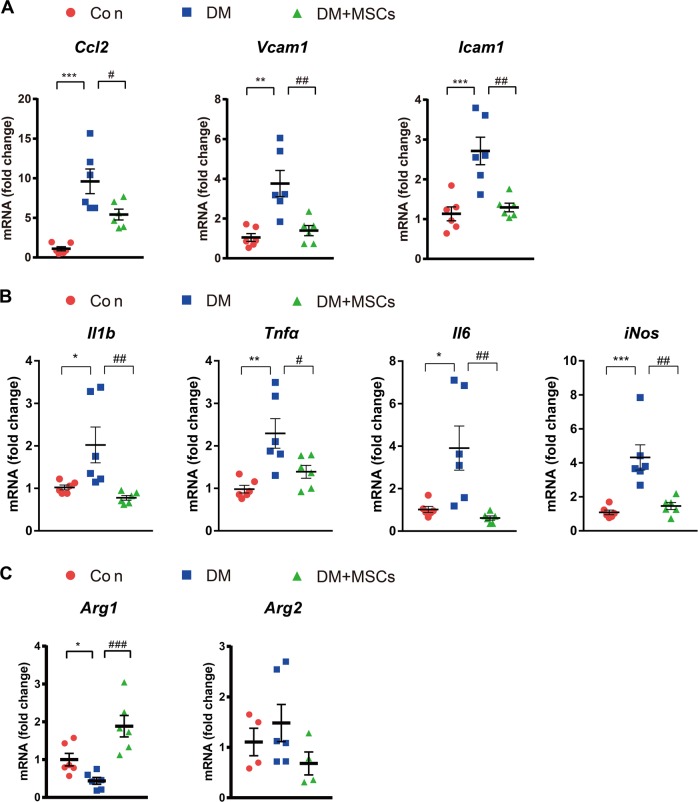
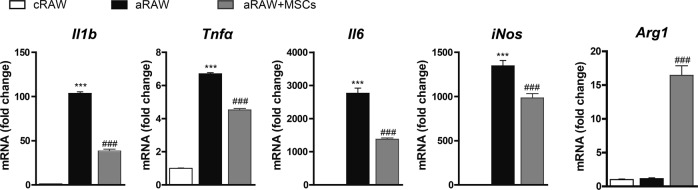
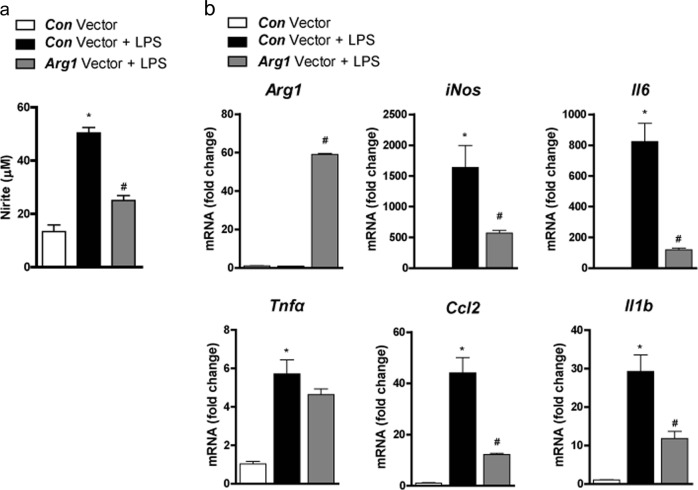
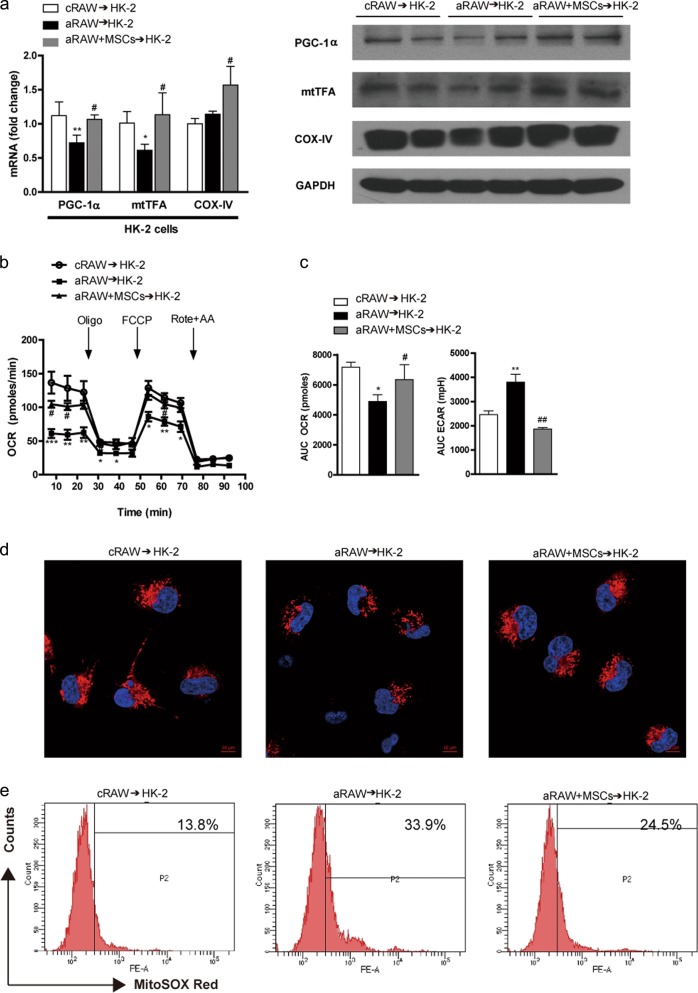
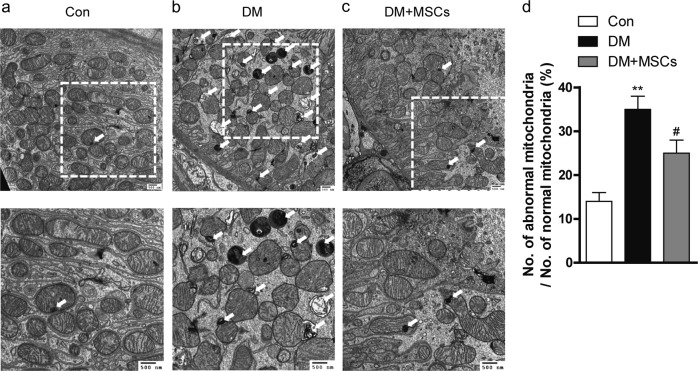
The administration of mesenchymal stem cells (MSCs) was shown to attenuate overt as well as early diabetic nephropathy in rodents, but the underlying mechanism of this beneficial effect is largely unknown. Inflammation and mitochondrial dysfunction are major pathogenic factors in diabetic nephropathy. In this study, we found that the repeated administration of MSCs prevents albuminuria and injury to tubular epithelial cells (TECs), an important element in the progression of diabetic nephropathy, by improving mitochondrial function. The expression of M1 macrophage markers was significantly increased in diabetic kidneys compared with that in control kidneys. Interestingly, the expression of arginase-1 (Arg1), an important M2 macrophage marker, was reduced in diabetic kidneys and increased by MSC treatment. In cultured TECs, conditioned media from lipopolysaccharide-activated macrophages reduced peroxisomal proliferator-activated receptor gamma coactivator 1α (Pgc1a) expression and impaired mitochondrial function. The coculture of macrophages with MSCs increased and decreased the expression of Arg1 and M1 markers, respectively. Treatment with conditioned media from cocultured macrophages prevented activated macrophage-induced mitochondrial dysfunction in TECs. In the absence of MSC coculture, Arg1 overexpression in macrophages reversed Pgc1a suppression in TECs. These observations suggest that MSCs prevent the progression of diabetic nephropathy by reversing mitochondrial dysfunction in TECs via the induction of Arg1 in macrophages.
Conflict of interest statement
The authors declare that they have no conflict of interest.
Figures


Similar articles
-
Mitochondrial transfer from mesenchymal stem cells to macrophages restricts inflammation and alleviates kidney injury in diabetic nephropathy mice via PGC-1α activation.Stem Cells. 2021 Jul;39(7):913-928. doi: 10.1002/stem.3375. Epub 2021 Apr 16. Stem Cells. 2021. PMID: 33739541
-
Mitochondria transfer from mesenchymal stem cells structurally and functionally repairs renal proximal tubular epithelial cells in diabetic nephropathy in vivo.Sci Rep. 2019 Mar 26;9(1):5184. doi: 10.1038/s41598-019-40163-y. Sci Rep. 2019. PMID: 30914727 Free PMC article.
-
Human umbilical cord-derived mesenchymal stem cells prevent the progression of early diabetic nephropathy through inhibiting inflammation and fibrosis.Stem Cell Res Ther. 2020 Aug 3;11(1):336. doi: 10.1186/s13287-020-01852-y. Stem Cell Res Ther. 2020. PMID: 32746936 Free PMC article.
-
Targeting Mitochondria and Reactive Oxygen Species-Driven Pathogenesis in Diabetic Nephropathy.Rev Diabet Stud. 2015 Spring-Summer;12(1-2):134-56. doi: 10.1900/RDS.2015.12.134. Epub 2015 Aug 10. Rev Diabet Stud. 2015. PMID: 26676666 Free PMC article. Review.
-
Research advance in mesenchymal stem cell-based therapy for diabetic nephropathy.Arch Physiol Biochem. 2025 Jun;131(3):379-392. doi: 10.1080/13813455.2024.2447532. Epub 2024 Dec 30. Arch Physiol Biochem. 2025. PMID: 40482673 Review.
Cited by
-
Combined Placental Mesenchymal Stem Cells with Guided Nanoparticles Effective Against Diabetic Nephropathy in Mouse Model.Int J Nanomedicine. 2024 Jan 26;19:901-915. doi: 10.2147/IJN.S446733. eCollection 2024. Int J Nanomedicine. 2024. PMID: 38293609 Free PMC article.
-
The future of diabetic kidney disease management: what to expect from the experimental studies?J Nephrol. 2020 Dec;33(6):1151-1161. doi: 10.1007/s40620-020-00724-1. Epub 2020 Mar 27. J Nephrol. 2020. PMID: 32221858 Review.
-
The Mitochondrial Kinase PINK1 in Diabetic Kidney Disease.Int J Mol Sci. 2021 Feb 3;22(4):1525. doi: 10.3390/ijms22041525. Int J Mol Sci. 2021. PMID: 33546409 Free PMC article. Review.
-
hUC-MSC preserves erectile function by restoring mitochondrial mass of penile smooth muscle cells in a rat model of cavernous nerve injury via SIRT1/PGC-1a/TFAM signaling.Biol Res. 2025 Jan 27;58(1):8. doi: 10.1186/s40659-024-00578-y. Biol Res. 2025. PMID: 39871297 Free PMC article.
-
The therapeutic effect of mesenchymal stem cells in diabetic kidney disease.J Mol Med (Berl). 2024 Apr;102(4):537-570. doi: 10.1007/s00109-024-02432-w. Epub 2024 Feb 29. J Mol Med (Berl). 2024. PMID: 38418620 Free PMC article. Review.
References
-
- USRDS: the United States renal data system. Am. J. Kidney Dis.42, 1–230 (2003). - PubMed
Publication types
MeSH terms
Substances
Grants and funding
- 2015M3D6A1065362/Ministry of Health and Welfare (Ministry of Health, Welfare and Family Affairs)/International
- 2015M3D6A1065362/Ministry of Health and Welfare (Ministry of Health, Welfare and Family Affairs)/International
- 2015M3D6A1065362/Ministry of Health and Welfare (Ministry of Health, Welfare and Family Affairs)/International
- 2015M3D6A1065362/Ministry of Health and Welfare (Ministry of Health, Welfare and Family Affairs)/International
- 2015M3D6A1065362/Ministry of Health and Welfare (Ministry of Health, Welfare and Family Affairs)/International
- 2015M3D6A1065362/Ministry of Health and Welfare (Ministry of Health, Welfare and Family Affairs)/International
- 2015M3D6A1065362/Ministry of Health and Welfare (Ministry of Health, Welfare and Family Affairs)/International
- 2015M3D6A1065362/Ministry of Health and Welfare (Ministry of Health, Welfare and Family Affairs)/International
- 2015M3D6A1065362/Ministry of Health and Welfare (Ministry of Health, Welfare and Family Affairs)/International
- 2015M3D6A1065362/Ministry of Health and Welfare (Ministry of Health, Welfare and Family Affairs)/International
- 2015M3D6A1065362/Ministry of Health and Welfare (Ministry of Health, Welfare and Family Affairs)/International
- 2015M3D6A1065362/Ministry of Health and Welfare (Ministry of Health, Welfare and Family Affairs)/International
- 2015M3D6A1065362/Ministry of Health and Welfare (Ministry of Health, Welfare and Family Affairs)/International
- 2015M3D6A1065362/Ministry of Health and Welfare (Ministry of Health, Welfare and Family Affairs)/International
- 2015M3D6A1065362/Ministry of Health and Welfare (Ministry of Health, Welfare and Family Affairs)/International
- 2015M3D6A1065362/Ministry of Health and Welfare (Ministry of Health, Welfare and Family Affairs)/International
- 2015M3D6A1065362/Ministry of Health and Welfare (Ministry of Health, Welfare and Family Affairs)/International
- 2015M3D6A1065362/Ministry of Science, ICT and Future Planning (MSIP)/International
- 2015M3D6A1065362/Ministry of Science, ICT and Future Planning (MSIP)/International
- 2015M3D6A1065362/Ministry of Science, ICT and Future Planning (MSIP)/International
- 2015M3D6A1065362/Ministry of Science, ICT and Future Planning (MSIP)/International
- 2015M3D6A1065362/Ministry of Science, ICT and Future Planning (MSIP)/International
- 2015M3D6A1065362/Ministry of Science, ICT and Future Planning (MSIP)/International
- 2015M3D6A1065362/Ministry of Science, ICT and Future Planning (MSIP)/International
- 2015M3D6A1065362/Ministry of Science, ICT and Future Planning (MSIP)/International
- 2015M3D6A1065362/Ministry of Science, ICT and Future Planning (MSIP)/International
- 2015M3D6A1065362/Ministry of Science, ICT and Future Planning (MSIP)/International
- 2015M3D6A1065362/Ministry of Science, ICT and Future Planning (MSIP)/International
- 2015M3D6A1065362/Ministry of Science, ICT and Future Planning (MSIP)/International
- 2015M3D6A1065362/Ministry of Science, ICT and Future Planning (MSIP)/International
- 2015M3D6A1065362/Ministry of Science, ICT and Future Planning (MSIP)/International
- 2015M3D6A1065362/Ministry of Science, ICT and Future Planning (MSIP)/International
- 2015M3D6A1065362/Ministry of Science, ICT and Future Planning (MSIP)/International
- 2015M3D6A1065362/Ministry of Science, ICT and Future Planning (MSIP)/International
- 2015M3D6A1065362/Ministry of Science, ICT and Future Planning (MSIP)/International
LinkOut - more resources
Full Text Sources
Medical
Research Materials
Miscellaneous
