. 2019 Jul 8;10(1):3004.
doi: 10.1038/s41467-019-11046-7.

Chemical genomics reveals histone deacetylases are required for core regulatory transcription

Affiliations

Chemical genomics reveals histone deacetylases are required for core regulatory transcription

Berkley E Gryder et al. Nat Commun. .

Abstract

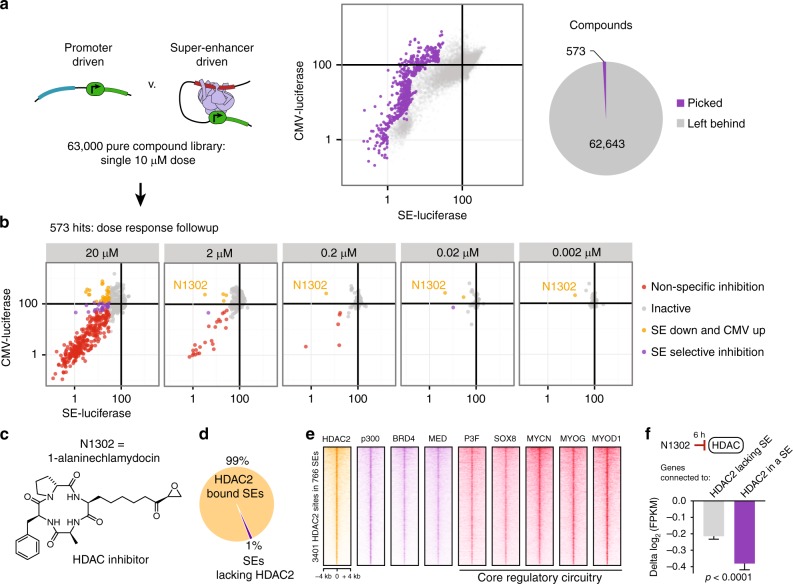
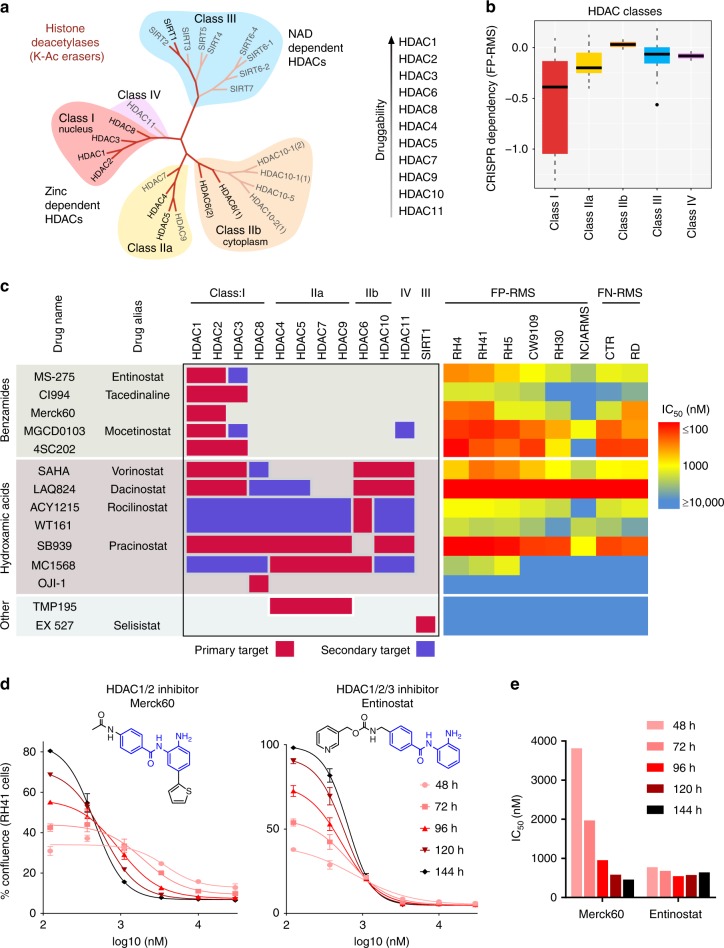
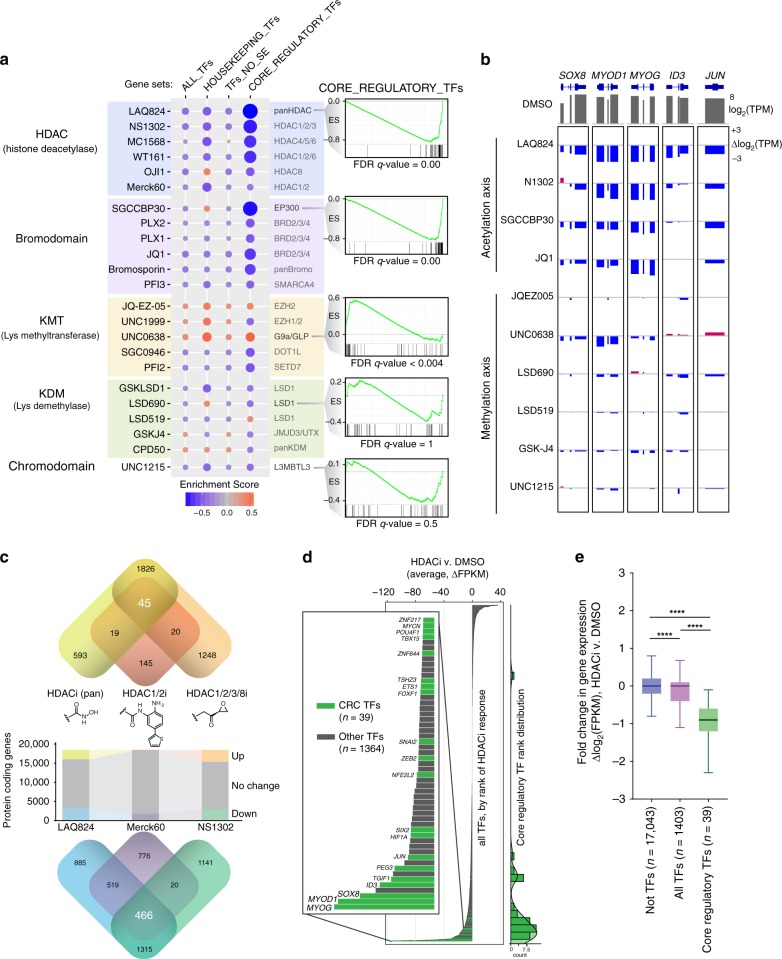
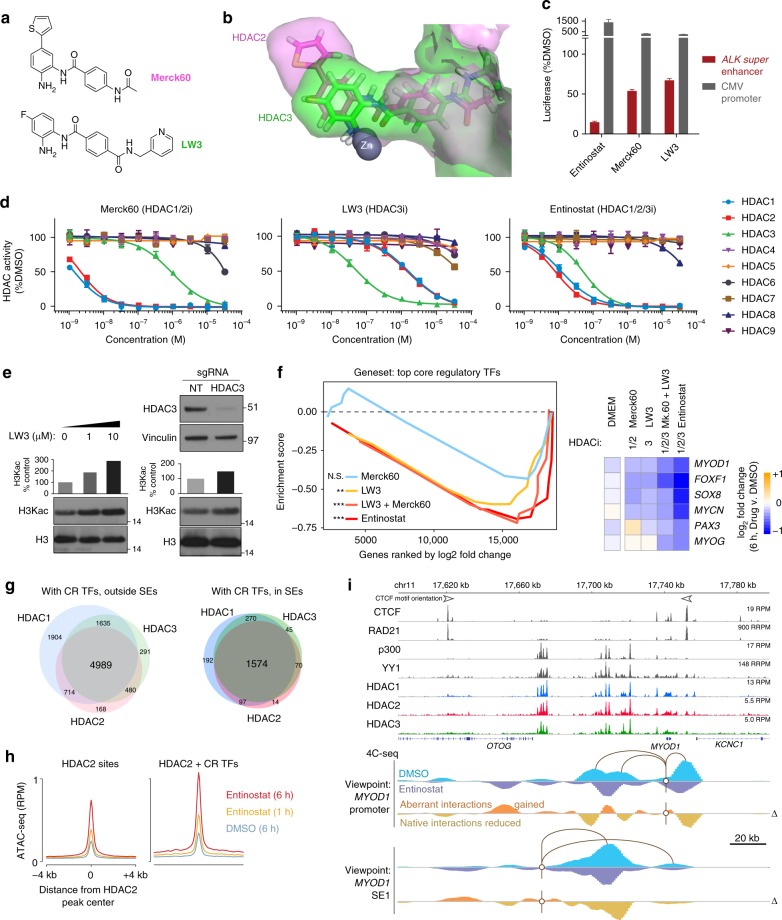
Identity determining transcription factors (TFs), or core regulatory (CR) TFs, are governed by cell-type specific super enhancers (SEs). Drugs to selectively inhibit CR circuitry are of high interest for cancer treatment. In alveolar rhabdomyosarcoma, PAX3-FOXO1 activates SEs to induce the expression of other CR TFs, providing a model system for studying cancer cell addiction to CR transcription. Using chemical genetics, the systematic screening of chemical matter for a biological outcome, here we report on a screen for epigenetic chemical probes able to distinguish between SE-driven transcription and constitutive transcription. We find that chemical probes along the acetylation-axis, and not the methylation-axis, selectively disrupt CR transcription. Additionally, we find that histone deacetylases (HDACs) are essential for CR TF transcription. We further dissect the contribution of HDAC isoforms using selective inhibitors, including the newly developed selective HDAC3 inhibitor LW3. We show HDAC1/2/3 are the co-essential isoforms that when co-inhibited halt CR transcription, making CR TF sites hyper-accessible and disrupting chromatin looping.


Conflict of interest statement

All authors declare no competing interests.

Figures

Fig. 1
Fig. 1
Chemical genomics of core regulatory TF-driven transcription. a Genetic regulatory element activated by CR TFs at the ALK SE in FP-RMS. CR TF-binding region highlighted in gray was cloned upstream of luciferase into a lentiviral expression vector for high-throughput chemical screening. b Chemical benchmarking of CMV-promoter driven transcription vs. super enhancer-driven transcription, by dose-dependent inhibition of luciferase expression in FP-RMS cells (RH4). Compounds shown are illustrative of key steps in RNA-Pol2 transcription: initiation (CDK7, XBP dependent), elongation (CDK9 dependent), and enhancer-mediated (BRD4 dependent). Measurements are mean and standard deviation of four technical replicates. c Scatter plots of chemical probe selectivity among target classes. Color representative of four transcriptional response categories as shown: non-specific inhibition (high activity against both constructs), inactive, SE-down regulating which also increase CMV-promoter-driven transcription, and SE selective inhibition. d Maximum SE selectivity per compound, rank ordered. Mechanistic classes of compounds are distinguished by bar color as shown. e Overlay of SE-dependent transcriptional response with cell viability at 24 and 48 h of drug exposure for a SE-selective inhibitor (HDAC inhibitor Vorinostat) and a transcriptionally unselective compound (LSD1 inhibitor LSD690). Heatmap above dose–response curves is calculated as the difference between SE-transcription and cell viability. Points represent mean and standard deviation of three technical replicates
Fig. 2
Fig. 2
HDAC is a key chemical vulnerability core regulatory TF-driven transcription. a First pass screening of 63,000 pure compounds against constitutive promoter-driven (CMV) and SE-driven luciferase. Assay was performed after 24 h of 10 µM exposure to each drug in duplicate. 573 of the most selective small molecules were chosen for follow-up screening. b Validation of 573 hits by dose–response screening identified the molecules that continued to perform as SE-selective transcriptional inhibitors at lower doses, most notably compound N1302. Points represent the mean of four technical replicates. c Structure of N1302, 1-alaninechlamydocin, an epoxide-containing cyclic tetrapeptide known to potently inhibit histone deacetylases. d HDAC2 occupies virtually all super enhancers. Pie chart depicts super enhancers in RH4 cells either bound (99%) or unbound (1%) by HDAC2 assessed by overlap of high-confidence (q < 10−9) ChIP-seq peaks. e HDAC2 sites (n = 3401) in SEs (n = 766) are co-bound by enzymatically opposing HAT (p300), BRD4, mediator, and core regulatory TFs. ChIP-seq signal is plotted as heatmaps of 8 kb surrounding each HDAC2 peak, as detected in FP-RMS (RH4 cells). f HDAC inhibitor has selective transcriptional impact on SE-associated, HDAC2 proximal genes. N1302 was dosed in RH4 cells for 6 h at 1 µM. Error bars represent 95% confidence interval; P-value was calculated by Welch’s unpaired t-test
Fig. 3
Fig. 3
Chemical phylogenetics of HDAC sensitivity. a Phylogenetic tree of histone deacetylases. b CRISPR screening of HDAC isoforms in FP-RMS cells from Broad Achilles dataset reveals strongest dependency on Class I. The panel shows summary statistics as a box (quartiles) and whisker (1.5*inter-quartile range) plot. c Diverse HDAC inhibitors with varying selectivity for HDAC isoforms, shown on the left, with each compounds concentration of half-maximal efficacy (IC50) on the right (measured by impact on cell growth over time). d Dose–response curves of RH41 cell growth impaired by benzamide-based inhibitors of HDAC1/2 (Merck60) and HDAC1/2/3 (Entinostat) over time. Points represent mean and error bars show SEM of triplicate measurements. e Rapid stabilization of IC50 from Entinostat, compared to gradual decline in IC50 with Merck60, corresponding to RH41 cell growth data presented in b
Fig. 4
Fig. 4
Transcriptome-wide impact of epigenetic probes on core regulatory TF transcription. a Chemical informer set of epigenetic probes reveals selective effect on transcription of core regulatory TF genes associated with super enhancers, as compared to all TFs, housekeeping TFs, and TFs not SE-associated. Gene set enrichment analysis was performed on RNA-seq measured gene-level transcripts from 6 h treatments with indicated compounds. Size and color of circles are proportional to GSEA enrichment scores. Mechanistic class is indicated to the left of compound names, whose particular protein isoform targets are indicated on the right. Called out example enrichment plots for CR TFs show strong negative enrichment for pan-isoform HDAC inhibitor LAQ824 and inhibitor of p300 bromodomains SGCCBP30 (with false discovery rates < 0.0001). b Suppression of RNA expression of core regulatory TFs upon inhibition of readers, writers, and erasers of the acetylation axis (HDAC, p300 or BRD4), but not by lysine methylation axis (EZH2, G9a, LSD1, JMJD3, or L3MBTL3). Exon level expression changes were quantified from RNA-seq after 6 h of drug treatment, compared to DMSO controls. c Changes in protein-coding genes upon HDAC inhibition with three distinct pharmacophores: hydroxamic acid (LAQ824), benzamide (Merck60), and epoxide (NS1302) zinc-binding groups. Overlap in gene sets for increased and decreased genes are shown above and below, respectively. d Rank order of change in TF gene expression upon HDAC inhibition, with core regulatory TFs highlighted in green. Values are the average delta FPKM across LAQ824, Merck60, and NS1302. Count histogram of CR TF rank is graphed on the right. e Core regulatory TFs are significantly more sensitive to HDAC inhibitors than other TFs, but all TFs (including CR TFs) are also more sensitive than all non-TF genes. Box plots (center line = median, box bounds = quartiles, whiskers = 1.5*inter-quartile range) show log2-fold change in HDACi versus control DMSO. ****P-value < 0.0001 as calculated by a two-tailed t-test with Welch’s correction
Fig. 5
Fig. 5
HDAC isoforms 1, 2 and 3 are co-essential for complete ablation of CR TF functionality. a Chemical structures of LW3 and Merck60. b Overlay of MD model of LW3 in HDAC3 (green) and Merck60 in HDAC2 (magenta). c Super-enhancer selective transcriptional assay shows LW3 is selective for SE activity, compared to CMV-driven transcription. Experiments were performed in quadruplicate, and error bars represent the standard deviation. d HDAC inhibition across isoforms HDAC1–9 reveals selectivity profiles for Merck60, LW3, and Entinostat. Experiments were performed in duplicate for each concentration, with symbols representing the mean and the error bars representing the standard deviation. e On-target effect of LW3 observed at the HDAC substrate (acetylated histone 3 lysine residues), seen by western blot after 6 h of treatment at 0, 1, and 10 µM of LW3 (left), and phenocopied by genetic disruption of HDAC3 by CRISPR-cas9 KO at 48 h (right). f Core regulatory TF transcription (GSEA, left) is selectively halted by LW3 and Entinostat but not Merck60 (at 6 h in RH4 cells, compared to DMSO). Combination of Merck60 (HDAC1 + 2i) and LW3 (HDAC3i) mimics the strong effect of triple HDAC1 + 2 + 3 inhibitor Entinostat. Expression changes are shown for top CR TFs, for all three benzamide HDAC inhibitors (right). NS = not significant, **P < 0.008, ***P < 0.0001, determined by GSEA. g HDAC1, HDAC2, and HDAC3 ChIP-seq peaks overlap with one another at sites of CR TF binding, with greater frequency of all three HDACs overlapping in SEs, shown summarized by Venn diagrams. h ATAC-seq shows increased accessibility to the chromatin template at HDAC2-bound sites, at 1 and 6 h of treatment with Entinostat. Sites are divided into HDAC2-only sites (left) and HDAC2 sites co-bound by all five top core regulatory TFs (SOX8, MYCN, PAX3-FOXO1, MYOG, and MYOD) as measured by ChIP-seq (right). i Aberrant chromatin looping interactions gained, and native interactions lost, upon HDAC inhibition with Entinostat for 6 h, assayed by 4C-seq from the MYOD1 promoter (middle) and the first MYOD1 super enhancer (bottom), with ChIP-seq tracks of CTCF, cohesin (RAD21), p300, YY1, HDAC1, HDAC2, and HDAC3

References

    1. Frye SV. The art of the chemical probe. Nat. Chem. Biol. 2010;6:159. doi: 10.1038/nchembio.296. - DOI - PubMed
    1. Lovén J, et al. Selective inhibition of tumor oncogenes by disruption of super-enhancers. Cell. 2013;153:320–334. doi: 10.1016/j.cell.2013.03.036. - DOI - PMC - PubMed
    1. Chapuy B, et al. Discovery and characterization of super-enhancer-associated dependencies in diffuse large B cell lymphoma. Cancer Cell. 2013;24:777–790. doi: 10.1016/j.ccr.2013.11.003. - DOI - PMC - PubMed
    1. Puissant A, et al. Targeting MYCN in neuroblastoma by BET bromodomain inhibition. Cancer Discov. 2013;3:308–323. doi: 10.1158/2159-8290.CD-12-0418. - DOI - PMC - PubMed
    1. Delmore JakeE, et al. BET bromodomain inhibition as a therapeutic strategy to target c-Myc. Cell. 2011;146:904–917. doi: 10.1016/j.cell.2011.08.017. - DOI - PMC - PubMed

Publication types

MeSH terms