

An Innovative Platform Merging Elemental Analysis and Ftir Imaging for Breast Tissue Analysis
- PMID: 31285452
- PMCID: PMC6614471
- DOI: 10.1038/s41598-019-46056-4
An Innovative Platform Merging Elemental Analysis and Ftir Imaging for Breast Tissue Analysis
Abstract
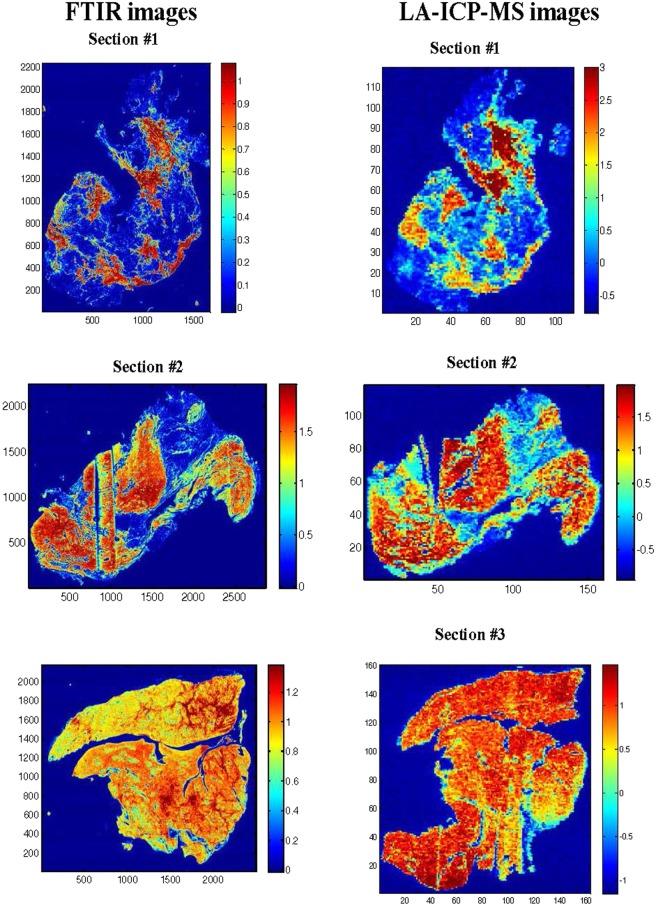
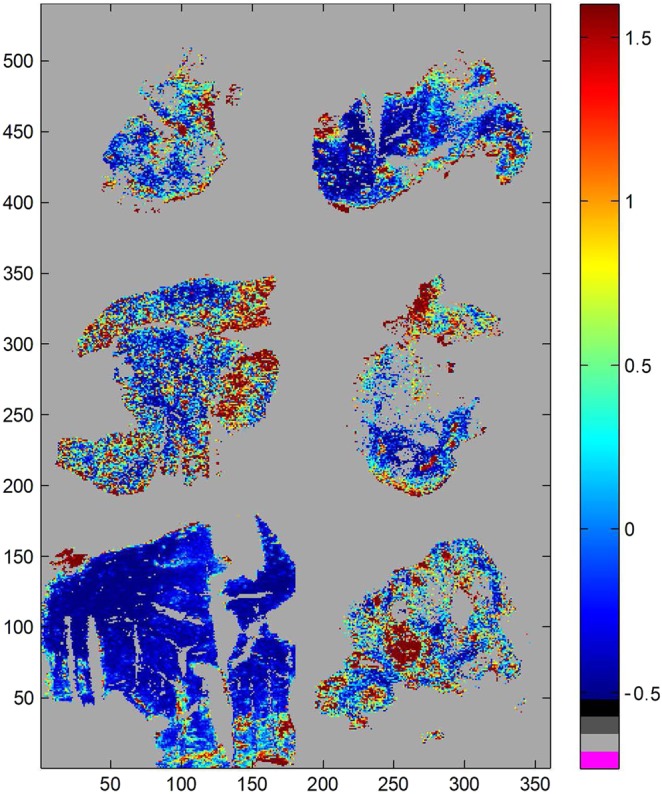
Histopathology and immunohistology remain the gold standard for breast cancer diagnostic. Yet, these approaches do not usually provide a sufficiently detailed characterization of the pathology. The purpose of this work is to demonstrate for the first time that elemental analysis and Fourier transform infrared spectroscopy microscopic examination of breast tissue sections can be merged into one dataset to provide a single set of markers based on both organic molecules and inorganic trace elements. For illustrating the method, 6 mammary tissue sections were used. Fourier transform infrared (FTIR) spectroscopy images reported a fingerprint of the organic molecules present in the tissue section and laser ablation elemental analysis (LA-ICP-MS) images brought inorganic element profiles. The 6 tissue sections provided 31 106 and 150,000 spectra for FTIR and LA-ICP-MS spectra respectively. The results bring the proof of concept that breast tissue can be analyzed simultaneously by FTIR spectroscopy and laser ablation elemental analysis (LA-ICP-MS) to provide in both case reasonably high resolution images. We show how to bring the images obtained by the two methods to a same spatial resolution and how to use image registration to analyze the data originating from both techniques as one block of data. We finally demonstrates the elemental analysis is orthogonal to all FTIR markers as no significant correlation is found between FTIR and LA-ICP-MS data. Combining FTIR and LA-ICP-MS imaging becomes possible, providing two orthogonal methods which can bring an unprecedented diversity of information on the tissue. This opens a new avenue of tissue section analyses providing unprecedented diagnostic potential.
Conflict of interest statement
The authors declare no competing interests.
Figures


Similar articles
-
Fourier Transform Infrared (FT-IR) and Laser Ablation Inductively Coupled Plasma-Mass Spectrometry (LA-ICP-MS) Imaging of Cerebral Ischemia: Combined Analysis of Rat Brain Thin Cuts Toward Improved Tissue Classification.Appl Spectrosc. 2018 Feb;72(2):241-250. doi: 10.1177/0003702817734618. Epub 2017 Oct 25. Appl Spectrosc. 2018. PMID: 28905634
-
Imaging of metals, metalloids, and non-metals by laser ablation inductively coupled plasma mass spectrometry (LA-ICP-MS) in biological tissues.Methods Mol Biol. 2010;656:51-82. doi: 10.1007/978-1-60761-746-4_3. Methods Mol Biol. 2010. PMID: 20680584
-
Expanding the boundaries of atomic spectroscopy at the single-cell level: critical review of SP-ICP-MS, LIBS and LA-ICP-MS advances for the elemental analysis of tissues and single cells.Anal Bioanal Chem. 2023 Nov;415(28):6931-6950. doi: 10.1007/s00216-023-04721-8. Epub 2023 May 10. Anal Bioanal Chem. 2023. PMID: 37162524 Free PMC article. Review.
-
Imaging mass spectrometry of elements in forensic cases by LA-ICP-MS.Int J Legal Med. 2017 Mar;131(2):497-500. doi: 10.1007/s00414-016-1414-4. Epub 2016 Aug 10. Int J Legal Med. 2017. PMID: 27507011
-
Bioimaging mass spectrometry of trace elements - recent advance and applications of LA-ICP-MS: A review.Anal Chim Acta. 2014 Jul 4;835:1-18. doi: 10.1016/j.aca.2014.04.048. Epub 2014 Apr 26. Anal Chim Acta. 2014. PMID: 24952624 Review.
Cited by
-
Investigation of Biochemical Alterations in Ischemic Stroke Using Fourier Transform Infrared Imaging Spectroscopy-A Preliminary Study.Brain Sci. 2019 Oct 25;9(11):293. doi: 10.3390/brainsci9110293. Brain Sci. 2019. PMID: 31717715 Free PMC article.
-
Toward a SERS Diagnostic Tool for Discrimination between Cancerous and Normal Bladder Tissues via Analysis of the Extracellular Fluid.ACS Omega. 2022 Mar 17;7(12):10539-10549. doi: 10.1021/acsomega.2c00058. eCollection 2022 Mar 29. ACS Omega. 2022. PMID: 35382275 Free PMC article.
-
Non-Invasive Disease Specific Biomarker Detection Using Infrared Spectroscopy: A Review.Molecules. 2023 Mar 2;28(5):2320. doi: 10.3390/molecules28052320. Molecules. 2023. PMID: 36903576 Free PMC article. Review.
-
Significance of platinum distribution to predict platinum resistance in ovarian cancer after platinum treatment in neoadjuvant chemotherapy.Sci Rep. 2022 Mar 16;12(1):4513. doi: 10.1038/s41598-022-08503-7. Sci Rep. 2022. PMID: 35296733 Free PMC article.
-
Study of oxaliplatin penetration into ovaries of patients treated with hyperthermic intraperitoneal chemotherapy (HIPEC) for peritoneal metastases of colorectal and appendiceal origin using mass spectrometry imaging.Pleura Peritoneum. 2021 Mar 24;6(2):67-74. doi: 10.1515/pp-2020-0149. eCollection 2021 Jun. Pleura Peritoneum. 2021. PMID: 34179340 Free PMC article.
References
Publication types
MeSH terms
Substances
LinkOut - more resources
Full Text Sources
Medical
