

Tissue amino acid profiles are characteristic of tumor type, malignant phenotype, and tumor progression in pancreatic tumors
- PMID: 31285536
- PMCID: PMC6614459
- DOI: 10.1038/s41598-019-46404-4
Tissue amino acid profiles are characteristic of tumor type, malignant phenotype, and tumor progression in pancreatic tumors
Abstract
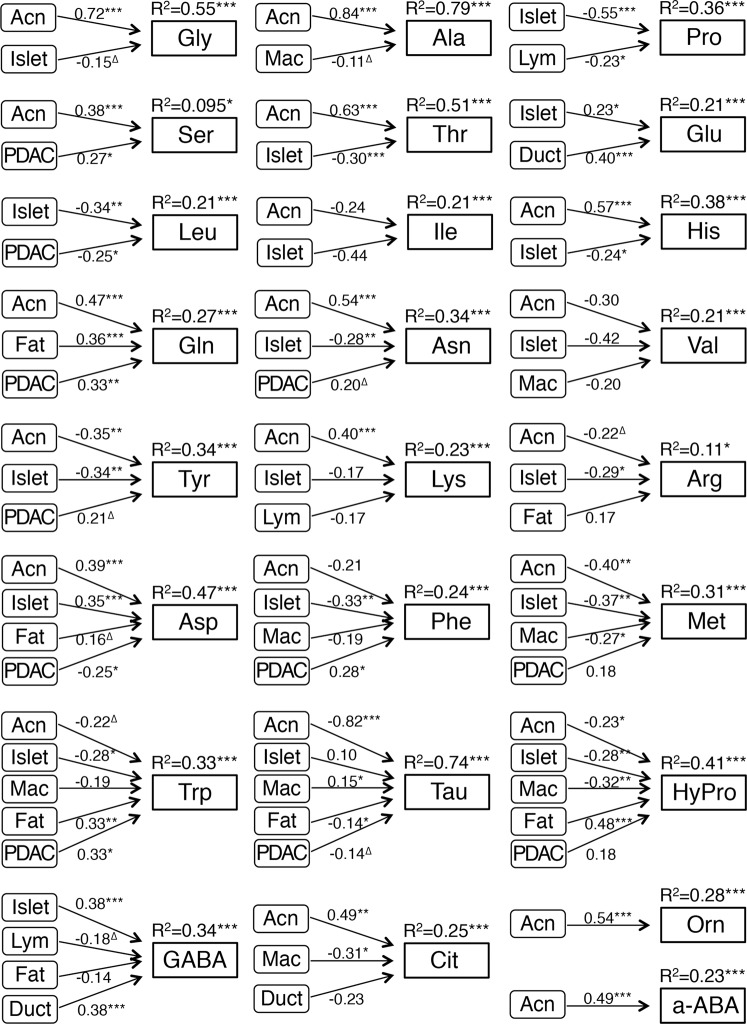
Tissue amino acid profiles depend on the cell types and extracellular components that constitute the tissue, and their functions and activities. We aimed to characterize the tissue amino acid profiles in several types of pancreatic tumors and lesions. We examined tissue amino acid profiles in 311 patients with pancreatic tumors or lesions. We used newly developed LC-MS/MS methods to obtain the profiles, which were compared with clinicopathological data. Each tumor or lesion presented a characteristic tissue amino acid profile. Certain amino acids were markedly altered during the multistep pancreatic carcinogenesis and pancreatic ductal adenocarcinoma (PDAC) progression. A tissue amino acid index (TAAI) was developed based on the amino acids that were notably changed during both carcinogenesis and cancer progression. Univariate and multivariate survival analyses revealed that PDAC patients with a high TAAI exhibited a significantly shorter survival rate, and these findings were validated using a second cohort. We suggest that tissue amino acid profiles are characteristic for normal tissue type, tumor histological type, and pathological lesion, and are representative of the cancer grade or progression stage in multistep carcinogenesis and of malignant characteristics. The TAAI could serve as an independent prognosticator for patients with PDAC.
Conflict of interest statement
The authors have read the journal’s policy and report the following conflicts: S.T., C.O., S.K., A.I. and N.O. are employees of Ajinomoto, Co., Inc. N.H. received research grants from Ajinomoto, Co., Inc. Y.I., R.Y.I., M.E., S.N., Y.K. and K.S. report no disclosures.
Figures


Similar articles
-
Distinct serum metabolomics profiles associated with malignant progression in the KrasG12D mouse model of pancreatic ductal adenocarcinoma.BMC Genomics. 2015;16 Suppl 1(Suppl 1):S1. doi: 10.1186/1471-2164-16-S1-S1. Epub 2015 Jan 15. BMC Genomics. 2015. PMID: 25923219 Free PMC article.
-
Glypican-3 and KRT19 are markers associating with metastasis and poor prognosis of pancreatic ductal adenocarcinoma.Cancer Biomark. 2016;17(4):397-404. doi: 10.3233/CBM-160655. Cancer Biomark. 2016. PMID: 27689616
-
Linc00675 is a novel marker of short survival and recurrence in patients with pancreatic ductal adenocarcinoma.World J Gastroenterol. 2015 Aug 21;21(31):9348-57. doi: 10.3748/wjg.v21.i31.9348. World J Gastroenterol. 2015. PMID: 26309360 Free PMC article.
-
Comparison of ILK and ERP29 expressions in benign and malignant pancreatic lesions and their clinicopathological significances in pancreatic ductal adenocarcinomas.Clin Transl Oncol. 2016 Apr;18(4):352-9. doi: 10.1007/s12094-015-1331-x. Epub 2016 Feb 18. Clin Transl Oncol. 2016. PMID: 26887611
-
The critical roles of activated stellate cells-mediated paracrine signaling, metabolism and onco-immunology in pancreatic ductal adenocarcinoma.Mol Cancer. 2018 Feb 19;17(1):62. doi: 10.1186/s12943-018-0815-z. Mol Cancer. 2018. PMID: 29458370 Free PMC article. Review.
Cited by
-
Role of different immune cells and metabolic pathways in modulating the immune response in pancreatic cancer (Review).Mol Med Rep. 2020 Dec;22(6):4981-4991. doi: 10.3892/mmr.2020.11622. Epub 2020 Oct 21. Mol Med Rep. 2020. PMID: 33174057 Free PMC article. Review.
-
Amino acid profiles in the tissue and serum of patients with liver cancer.Open Med (Wars). 2022 Nov 18;17(1):1797-1802. doi: 10.1515/med-2022-0589. eCollection 2022. Open Med (Wars). 2022. PMID: 36447523 Free PMC article.
-
Metabolic syndrome related gene signature predicts the prognosis of patients with pancreatic ductal carcinoma. A novel link between metabolic dysregulation and pancreatic ductal carcinoma.Cancer Cell Int. 2021 Dec 20;21(1):698. doi: 10.1186/s12935-021-02378-w. Cancer Cell Int. 2021. PMID: 34930261 Free PMC article.
-
Human pancreatic cancer cells under nutrient deprivation are vulnerable to redox system inhibition.J Biol Chem. 2020 Dec 4;295(49):16678-16690. doi: 10.1074/jbc.RA120.013893. Epub 2020 Sep 25. J Biol Chem. 2020. PMID: 32978257 Free PMC article.
-
Preoperative AminoIndex Cancer Screening (AICS) abnormalities predict postoperative recurrence in patients undergoing curative resection for non-small cell lung cancer.BMC Cancer. 2020 Nov 12;20(1):1100. doi: 10.1186/s12885-020-07575-w. BMC Cancer. 2020. PMID: 33183251 Free PMC article.
References
-
- Hanahan, D. & Weinberg, R. A. Hallmarks of cancer: the next generation. Cell144, 646–674, S0092-8674(11)00127-9 (2011). - PubMed
Publication types
MeSH terms
Substances
LinkOut - more resources
Full Text Sources
Medical
