. 2020 Feb;27(2):773-789.
doi: 10.1038/s41418-019-0387-5. Epub 2019 Jul 8.

The antimalarial drug amodiaquine stabilizes p53 through ribosome biogenesis stress, independently of its autophagy-inhibitory activity

Affiliations

The antimalarial drug amodiaquine stabilizes p53 through ribosome biogenesis stress, independently of its autophagy-inhibitory activity

Jaime A Espinoza et al. Cell Death Differ. 2020 Feb.

Abstract

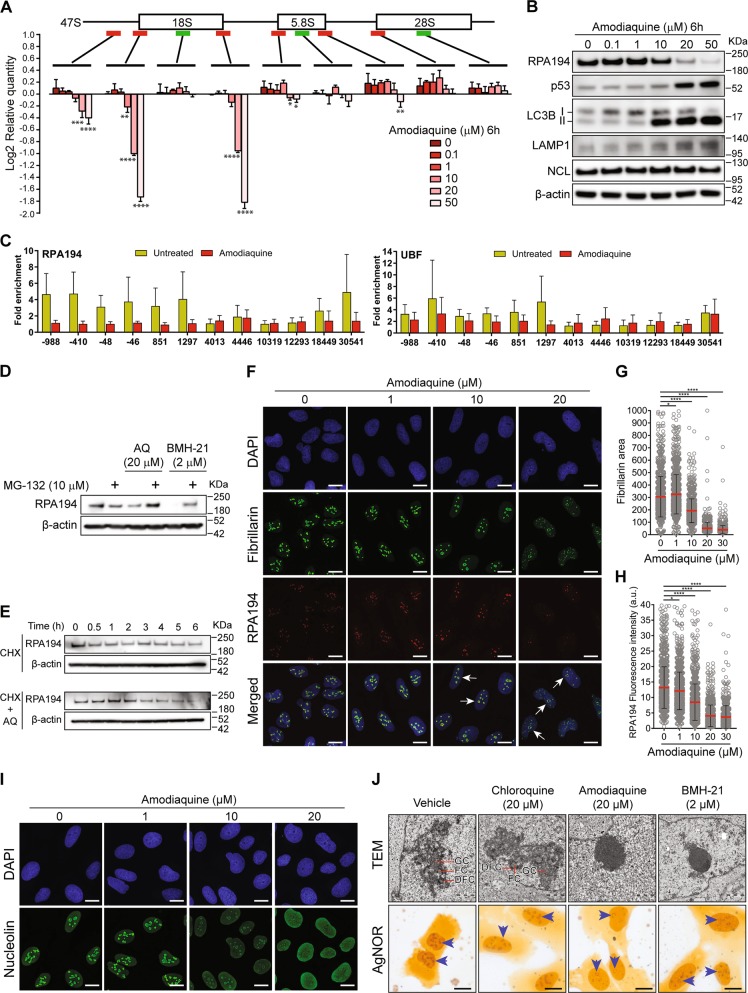
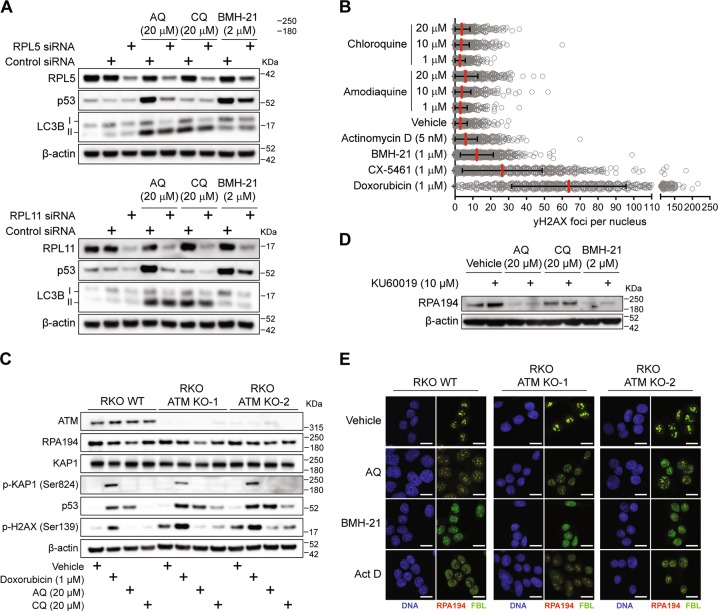
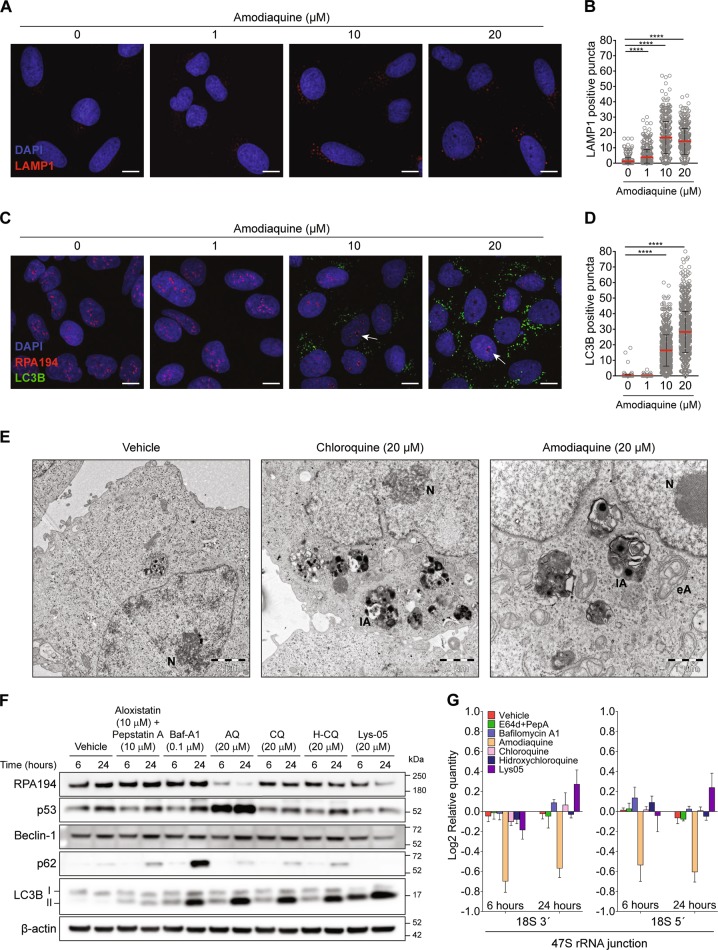
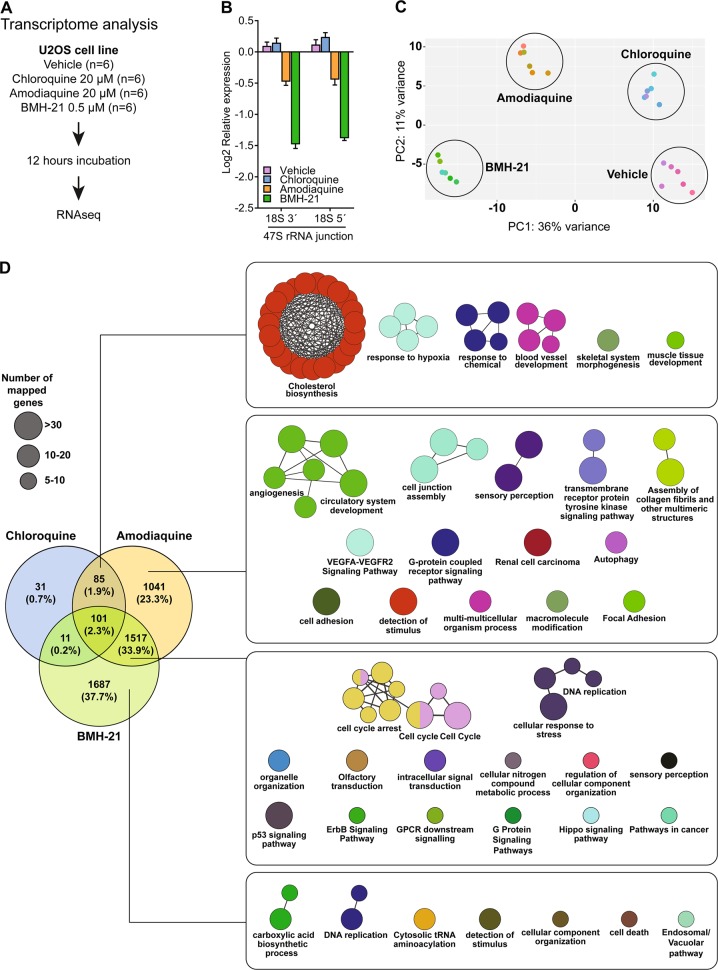
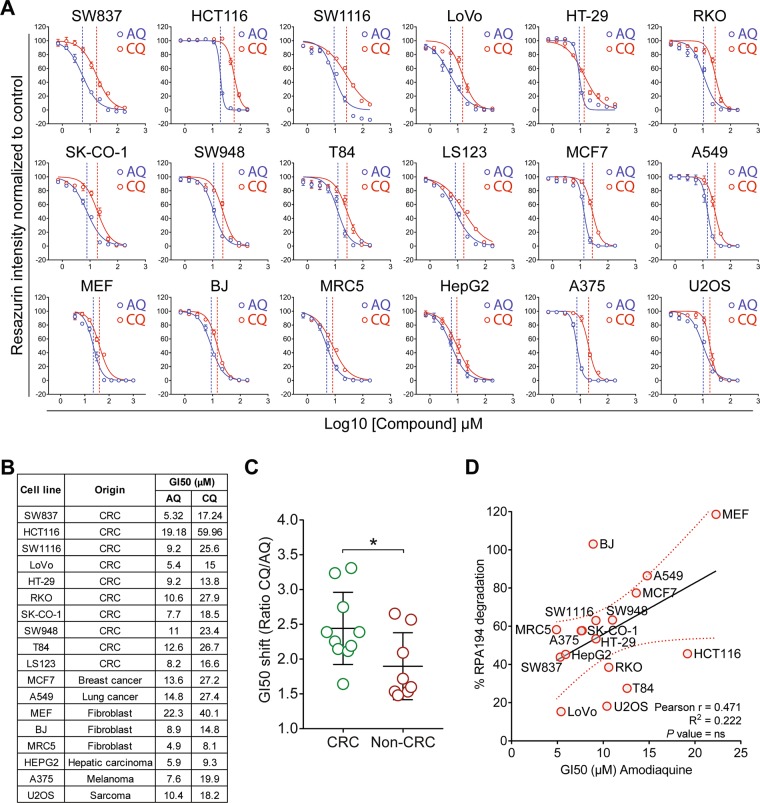
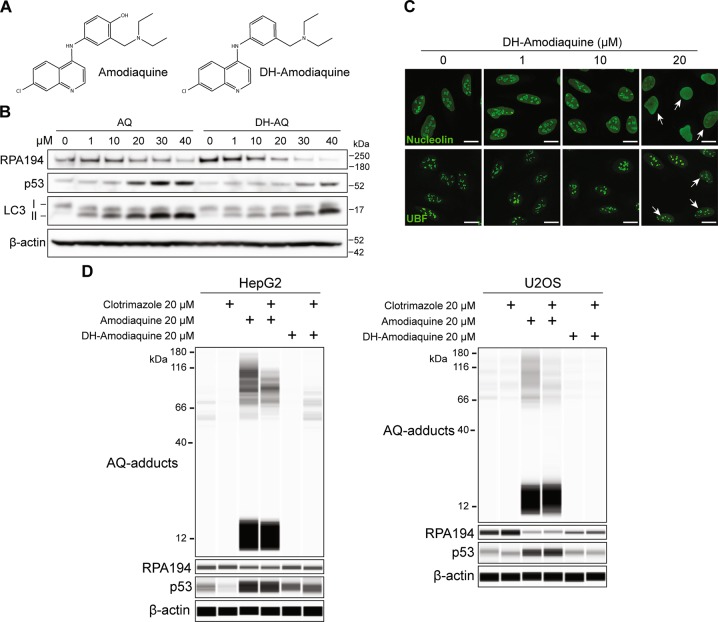
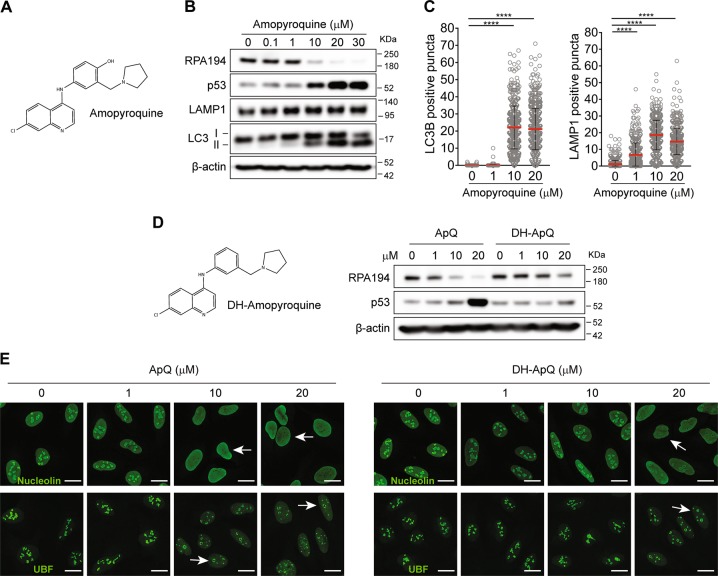
Pharmacological inhibition of ribosome biogenesis is a promising avenue for cancer therapy. Herein, we report a novel activity of the FDA-approved antimalarial drug amodiaquine which inhibits rRNA transcription, a rate-limiting step for ribosome biogenesis, in a dose-dependent manner. Amodiaquine triggers degradation of the catalytic subunit of RNA polymerase I (Pol I), with ensuing RPL5/RPL11-dependent stabilization of p53. Pol I shutdown occurs in the absence of DNA damage and without the subsequent ATM-dependent inhibition of rRNA transcription. RNAseq analysis revealed mechanistic similarities of amodiaquine with BMH-21, the first-in-class Pol I inhibitor, and with chloroquine, the antimalarial analog of amodiaquine, with well-established autophagy-inhibitory activity. Interestingly, autophagy inhibition caused by amodiaquine is not involved in the inhibition of rRNA transcription, suggesting two independent anticancer mechanisms. In vitro, amodiaquine is more efficient than chloroquine in restraining the proliferation of human cell lines derived from colorectal carcinomas, a cancer type with predicted susceptibility to ribosome biogenesis stress. Taken together, our data reveal an unsuspected activity of a drug approved and used in the clinics for over 30 years, and provide rationale for repurposing amodiaquine in cancer therapy.


Conflict of interest statement

The authors declare that they have no conflict of interest.

Figures

Fig. 1
Fig. 1
Amodiaquine inhibits ribosome biogenesis. a RT-qPCR analysis of 47S rRNA precursor demonstrated a reduction of 47S transcription in U2OS cells treated with increasing concentrations of AQ. Red bars: 47S-specific primers; Green bars: regions shared with mature rRNAs. Data shown as mean ± SD of triplicate wells and are representative of triplicate treatments; Statistical significance was calculated by one-way ANOVA using log-transformed data and Dunnett’s multiple test comparison (*p < 0.05, **p < 0.01, ***p < 0.001, ****p < 0.001). b Immunoblot analysis of U2O2 cells treated as in a shows reduction of RPA194 protein, along with p53 activation and LC3-II and LAMP1 accumulation in U2OS cells treated with increasing doses of AQ during 6 h. Nucleolin (NCL) levels show no change. c Chip-qPCR analyses revealed a reduction of RPA194 binding to rDNA sequence, but UBF binding was less affected. U2OS cells treated with 20 µM of AQ during 6 h (n = 3). Data shown as mean ± SD of triplicate wells and are representative of three independent experiments. d Degradation of RPA194 induced by AQ is proteasome dependent. U2OS cells were treated with proteasome inhibitor MG-132 during 1 h before addition of AQ and BMH-21 during 6 h. e U2OS cells were incubated with cyclohexamide (CHX) in the absence and presence of AQ during 6 h. f Immunofluorescence analysis showed a decrease in RPA194 signal and disruption of fibrillarin’s localization pattern. U2OS cells treated with 20 µM of AQ during 6 h. Nuclear DNA was counterstained with DAPI. White arrows indicate nucleolar caps. Scale bars, 10 µm. g, h Quantification of fibrillarin area and RPA194 intensity in >800 cells per condition, treated as in f. Data shown as mean ± SD and is representative of two independent experiments; Statistical significance was calculated by one-way ANOVA using Kruskal–Wallis test and Dunn’s multiple test comparison (*p < 0.05, **p < 0.01, ***p < 0.001, ****p < 0.001). i Nucleolin is translocated into the nucleoplasm. Nuclear DNA was counterstained with DAPI. U2OS cells treated with increasing doses of AQ during 6 h. Scale bars, 10 µm j U2OS cells were treated with CQ, AQ and BHM-21 during 6 h and fixed for transmission electron microscopy (TEM) for nucleoli analysis. Scale bars, 1 µm; GC granular component, FC fibrillar center, DFC dense fibrillar component. AgNOR staining was used to identify changes in nucleolar organizer regions. Blue arrows indicate nucleolus. Scale bars, 10 µm
Fig. 2
Fig. 2
Amodiaquine stabilizes p53 through RPL5/RPL11 nucleolar checkpoint and does not require ATM activation. a Knockdown of RPL5 and RPL11 prevent p53 activation after exposure to AQ. Cells were treated with siRNA against RPL5 and RPL11 for 24 h. After, cells were incubated with AQ, CQ, and BHM-21 during an additional 6 h. β-actin levels were used as loading control. b Quantification of γ-H2AX positive foci number per nucleus after 24 h of incubation with CQ, AQ, actinomycin D, BMH-21, CX-5461 and doxorubicin (>1000 cells per group). Data shown as mean ± SD of duplicate wells and are representative of two independent experiments. (c) ATM is not required for RPA194 degradation and p53 activation induced by AQ. Immunoblot analysis for ATM, RPA194, KAP1, p-KAP1, p53, p-H2AX, and β-actin in WT RKO colon cancer cell line and two ATM knockout clones. Cells were incubated with doxorubicin, AQ, and CQ during 6 h. d ATM inhibition does not prevent RPA194 degradation. U2OS cells were pretreated with the ATM inhibitor KU60019 during 1 h and then incubated with AQ, CQ, and BMH-21 during 6 h. e Nucleolar caps induced by AQ do not require ATM. Immunofluorescence staining of RPA194 and fibrillarin in WT RKO colon cancer cell line and two ATM knockout clones treated as in c. Scale bars, 10 µm
Fig. 3
Fig. 3
Ribosome biogenesis stress induced by amodiaquine is not related to its autophagy inhibition activity. a AQ induces accumulation of LAMP1-positive and c LC3-positive puncta along with RPA194 positive nucleolar caps. U2OS cells were treated with increasing doses of AQ during 6 h and stained. White arrows indicates nucleolar caps. Scale bars, 5 µm. b Quantification of LAMP1-positive and d LC3B-positive puncta in cells treated as in a and c. Statistical significance was calculated by one-way ANOVA using Kruskal–Wallis test and Dunn’s multiple test comparison (*p < 0.05, **p < 0.01, ***p < 0.001, ****p < 0.001). e Ultrastructural analysis shows accumulation of cytoplasmic vesicles along with alteration of nucleolar structure induced by AQ. Transmission electron microscopy of U2OS cells treated during 6 h with CQ and AQ. N nucleolus; eA early autophagosome; lA late autophagosome. f Comparison between autophagy inhibitors shows that only AQ induces degradation of RPA194 and activation of p53. Immunoblot analysis of RPA194, p53, beclin-1, p62, LC3B, and β-actin in U2OS cells treated with aloxistatin + pepstatin A, bafilomycin-A1 (Baf-A1), amodiaquine (AQ), chloroquine (CQ), hidroxychloroquine (H-CQ) and Lys-05 during 6 and 24 h. g RT-qPCR analysis of 18S 3′and 18S 5′ junction of the 47S rRNA precursor in cells treated as in f. Data shown as mean ± SD of triplicate wells and are representative of three independent experiments
Fig. 4
Fig. 4
Transcriptional perturbation induced by Amodiaquine resembles that of Chloroquine and BMH-21. a Experimental design for RNAseq analysis. b AQ reduces the synthesis of 47S with less intensity than BMH-21. RT-qPCR analysis for the 18S 3′ and 5′ junctions in the 47S rRNA transcript for cells treated as in a. Data shown as mean ± SD of three treatments. c Principal component analysis based on RNAseq data, color-coded according to each treatment. The scatter plot shows the position of samples based on the two first principal components. d Gene ontology and pathway analysis comparing common and unique features among differentially expressed genes disrupted by AQ, CQ, and BMH-21. ClueGO integrates GO terms and pathways to create a functionally organized network. Node size represents amount of mapped genes and node color is assigned randomly. Nodes with two colors contains genes that converged from different databases
Fig. 5
Fig. 5
Amodiaquine is more cytotoxic than chloroquine, particularly in colorectal cancer cells a Dose responses curves and b growth-inhibitory concentrations (GI50s) of AQ and CQ in a panel of colorectal (CRC) and non-CRC cell lines. Cells were incubated with compounds for 72 h. Fitted dose response curves display mean and standard deviation from three experiments. In a, dashed vertical lines represent the growth-inhibitory concentrations (GI50). c CRC cell lines are more sensitive to AQ than non-CRC lines. Comparison of GI50 shift between AQ and CQ in CRC and non-CRC cell lines using CQ/AQ ratios calculated from triplicate dose response curves. Ratios were analyzed using unpaired t test; *P value < 0.05. d Correlation between GI50s obtained after 72 h and RPA194 degradation obtained by quantitative immunoblot after 6 h of incubation with AQ
Fig. 6
Fig. 6
AQ-induced protein adduction is not involved in nucleolar stress a Chemical structures of amodiaquine and its analog without the reactive group, deshydroxy-amodiaquine (DH-AQ). b Immunoblot analysis of RPA194, p53 and LC3 in U2OS cells treated with increasing doses of AQ and its nonreactive analog DH-AQ during 6 h. c Nucleolin translocation and UBF-positive nucleolar (white arrows) caps were detected by immunofluorescence in U2OS cells treated as in a. Scale bars, 10 µm. d Capillary immunoblot of HepG2 and U2OS cells treated with 20 µM of AQ and DH-AQ during 6 h. Cells were treated with 20 µM of clotrimazole for 1 h prior to adding AQ and DH-AQ, maintaining the same concentration of clotrimazole for the next 6 h of incubation. AQ-adducts were detected using a monoclonal antibody against AQ
Fig. 7
Fig. 7
Amopyroquine exerts nucleolar stress in a similar way as its analog amodiaquine a Chemical structure of amopyroquine (ApQ). b ApQ induces similar alterations to those of AQ. Immunoblot analysis of RPA194, p53, LC3, LAMP1, and nucleolin in U2OS cells treated with increasing doses of AQ during 6 h. c Quantification of LC3B and LAMP1-positive puncta in cells treated as in b. d ApQ analog without the reactive group (deshydroxy-amopyroquine; DH-ApQ) shows somewhat less activation of p53 and less RPA194 degradation. Immunoblot analysis of RPA194 and p53 in U2OS cells treated with increasing doses of ApQ and its analog DH-ApQ during 6 h. e DH-ApQ has less activity than ApQ inducing nucleolin translocation and generation of UBF-positive nucleolar. Immunofluorescence analysis of U2OS cells treated as in d. White arrows indicate nucleolin translocation into nucleoplasm and UBF-positive nucleolar caps. Scale bars, 10 µm

Similar articles

Cited by

References

    1. Pelletier J, Thomas G, Volarevic S. Ribosome biogenesis in cancer: new players and therapeutic avenues. Nat Rev Cancer. 2018;18:51–63. - PubMed
    1. Wang M, Lemos B. Ribosomal DNA copy number amplification and loss in human cancers is linked to tumor genetic context, nucleolus activity, and proliferation. PLoS Genet. 2017;13:e1006994. - PMC - PubMed
    1. Derenzini M, Montanaro L, Trere D. What the nucleolus says to a tumour pathologist. Histopathology. 2009;54:753–62. - PubMed
    1. Bywater MJ, Poortinga G, Sanij E, Hein N, Peck A, Cullinane C, et al. Inhibition of RNA polymerase I as a therapeutic strategy to promote cancer-specific activation of p53. Cancer Cell. 2012;22:51–65. - PMC - PubMed
    1. Zhao J, Yuan X, Frodin M, Grummt I. ERK-dependent phosphorylation of the transcription initiation factor TIF-IA is required for RNA polymerase I transcription and cell growth. Mol Cell. 2003;11:405–13. - PubMed

Publication types

MeSH terms